AQUATIC MICROBIAL ECOLOGY Aquat Microb Ecol
Vol. 36: 201–211, 2004
Published September 14
Diversity of cyanobacteria and heterotrophic bacteria in cyanobacterial blooms in Lake Joutikas, Finland E. Kolmonen1,*, K. Sivonen1, J. Rapala2, 3, K. Haukka1 1
University of Helsinki, Department of Applied Chemistry and Microbiology, Viikki Biocenter, PO Box 56, 00014 Helsinki University, Finland 2 Finnish Environment Institute, PO Box 140, 00251 Helsinki, Finland
3
Present address: National Product Control Agency for Welfare and Health, PO Box 210, 00531 Helsinki, Finland
ABSTRACT: Water samples were collected in August 2001 and 2002 from the eutrophic Lake Joutikas during cyanobacterial blooms. DNA and RNA were isolated from size fractionated samples and the diversity of the bacteria present in each fraction was studied by PCR amplification of partial 16S rRNA and denaturing gradient gel electrophoresis (DGGE) fingerprinting. Major bands from the gels were sequenced for further identification. Cyanobacteria were also identified and counted under the microscope. Anabaena/Aphanizomenon were the most abundant cyanobacteria in both years, although the dominant species was different each year. When comparing the 2 techniques, equal numbers of abundant Anabaena/Aphanizomenon morphotypes were detected by microscopy and phylotypes by DGGE. The genera Microcystis and Synechococcus appeared more abundant in the DGGE analysis than under the microscope. In the heterotrophic bacterial community variation was observed between the bloom samples from the 2 years. Verrucomicrobia was the most abundant group in both years in both DNA- and RNA-derived profiles. Otherwise the patterns based on DNAand RNA-derived DGGE-profiles differed, especially in 2002. The presence of Actinobacteria and Chloroflexi was less pronounced in RNA-based than in DNA-based analysis. This indicates that their relative biomass was smaller than estimated by DNA-analysis. It might also indicate that they were metabolically inactive. In contrast, in 2002, the CFB group (Cytophaga-Flavobacterium-Bacteroides) and δ-Proteobacteria were more prominent in the RNA-based than in the DNA-based profiles. Thus they probably formed a substantial fraction of biomass and/or were active members in the blooms. KEY WORDS: Cyanobacteria · Heterotrophic bacteria · DGGE · DNA · RNA · Diversity Resale or republication not permitted without written consent of the publisher
Toxic cyanobacterial blooms, i.e. mass occurrences, are a worldwide problem for water quality, especially in eutrophic lakes. The diversity of the co-existing heterotrophic bacteria in the bloom and their effects on human and animal health as well as their possible interactions with cyanobacteria are poorly known. In general, bacterial community composition depends on predation and the organic material available. Different bacterial communities have been shown to develop on the cyanobacterial detritus and green algal detritus
(van Hannen et al. 1999a,b). It has been suggested that nitrogen and products from carbon dioxide fixation are transferred from cyanobacteria to attached bacteria in a bloom (Paerl 1984) and that the activity of associated bacteria responds to cyanobacterial exudates (Wang & Priscu 1994). Endotoxins are a group of toxins that are components of the cell wall of cyanobacteria and gram-negative bacteria (Kuiper-Goodman et al. 1999). High endotoxin concentrations occasionally detected in cyanobacterial blooms might be produced by coexisting gram-negative bacteria (Rapala et al. 2002). However, only a little is known about the co-existing
*Email:
[email protected]
© Inter-Research 2004 · www.int-res.com
INTRODUCTION
202
Aquat Microb Ecol 36: 201–211, 2004
bacteria in cyanobacterial blooms whereas freshwater bacterial communities in general have been studied extensively (e.g. Hiorns et al. 1997, Konopka et al. 1999, Crump et al. 1999, Casamayor et al. 2000, 2002, Glöckner et al. 2000, Lindström & Leskinen 2002, Zwart et al. 2002). In spite of improved culturing techniques, most microorganisms in aquatic ecosystems still remain uncultured (Zwart et al. 2002). Therefore, molecular biology techniques such as denaturing gradient gel electrophoresis (DGGE) using the 16S rRNA as a molecular marker are commonly used for diversity studies. In DGGE, DNA fragments of the same length can be separated on the basis of melting domain structure and nucleotide composition (Muyzer & Smalla 1998). In studies of aquatic bacterial communities both 16S rRNA gene and reverse transcribed rRNA have been used in the DGGE analysis. Several authors have used RNA-derived DGGE patterns to infer the potentially active bacterial population (Teske et al. 1996, Bernard et al. 2000, Schäfer et al. 2001, Winter et al. 2001, Troussellier et al. 2002). Although active cells tend to have more RNA than inactive ones, the RNA content varies greatly among species (Flärdh et al. 1992, Lee & Kemp 1994, Binder & Liu 1998, Fegatella et al. 1998). This makes the use of rRNA as an indicator of activity problematic in natural mixed-species communities. The content of rRNA has also been found to correlate with the cell volume (Kemp et al. 1993, Binder & Liu 1998) and thus RNA-based DGGE analysis could alternatively be interpreted to reveal those bacteria that form a substantial fraction of biomass in the system. Little is known about the bacterial communities associated with cyanobacteria in freshwater lakes. We wanted to find out which cyanobacteria and hetero-
Table 1. Description of Lake Joutikas and physical and chemical characteristics of water. nd: not determined Variable
Surface area (km2) Mean depth (m) Maximum depth (m) Total phosphorus (mg P l–1) Total nitrogen (mg N l–1) Chlorophyll a (mg l–1) NH4-N (mg l–1) Water temperature (°C) Oxygen (mg l–1) Conductivity (mS m–1) Water colour (mg Pt l–1) pH Secchi depth (m) Microcystin (µg l–1)
Date Aug 22, 2001 Aug 20, 2002 0.11 2.51 3.81 nd nd 160 93 20.0 nd nd nd 7.2 0.7 0.67
63 1700 71 110 21.3 4.6 8.5 60 7.3 0.5 14
trophic bacteria are present in the cyanobacterial blooms. We isolated both DNA and RNA from the water and bloom samples collected in 2 years and subjected them to DGGE analysis and sequencing of 16S rRNA fragments. We also compared the cyanobacterial DGGE patterns to the results of traditional microscopic examination of cyanobacteria.
MATERIALS AND METHODS Study site and sampling of bacteria. Water samples were taken from Lake Joutikas on August 23, 2001, and August 22, 2002. Lake Joutikas is a eutrophic lake situated in Southern Finland. It is a small and shallow lake (Table 1) where heavy cyanobacterial blooms have been a common phenomenon for many summers. Water samples for nucleic acid extractions were collected by a tube sampler from a depth of 0 to 0.3 m. Five µm filters (Osmonics, Polycarbonate, 47 mm) were used to collect cyanobacteria, and 1 µm (Osmonics, Polycarbonate, 47 mm) and 0.2 µm filters (Pall corporation, Supor-200, 47 mm) to collect the rest of the bacteria. Filtrations were performed by the lakeside within 30 min of sampling. Separate bloom samples from the surface water (approximately 1 cm layer) were also taken. Both the filters and the bloom samples were placed into 2 ml polypropylene tubes (Nalgene) and frozen immediately in liquid nitrogen. In the laboratory, samples for RNA isolation were stored at –80°C and samples for DNA isolation at –20°C. In addition, from samples collected by the Uusimaa Regional Environment Centre on August 22, 2001, and August 20, 2002, toxin concentrations were analyzed, cyanobacteria were identified under the microscope, the cells of the different cyanobacterial genera were counted and the cell counts converted to biomasses using the database of the Finnish Environment Institute (unpubl.). Physical and chemical characteristics of water were analyzed by the Uusimaa Regional Environment Centre (Table 1). Nucleic acid extraction. DNA and RNA were extracted by bead beating and the CTAB (cetyltrimethyl-ammonium bromide) method with FastPrep tubes and FastPrepFP120 bead beating system (Bio 101). Frozen filters were transferred to the FastPrep tubes (lysis matrix A for DNA and lysis matrix C for RNA) containing 1 ml of cold lysis buffer (100 mM TrisHCl, pH 8, 1.5% SDS, 10 mM EDTA, 1% deoxycholate, 1% Igepal-CA630, 5 mM thiourea, 10 mM dithiothreitol). The cells were disrupted mechanically with the FastPrepFP120 bead beater at 5.0 m s–1 for 30 s. After homogenisation the tubes were placed on ice for 5 min and then centrifuged for 1 min at 15 300 × g. The supernatant (1 ml) was divided between two 2 ml tubes and 225 µl of 5 M NaCl and 170 µl of 10%
Kolmonen et al.: Diversity of bacteria in cyanobacterial blooms
CTAB in 0.7 M NaCl were added and mixed. The tubes were incubated for 20 min at 65°C. An equal volume of chloroform was added, the tubes were mixed and centrifuged at 10 600 × g for 10 min. DNA and RNA samples from 5 µm filters in 2002 were treated 2 or 3 times with 10% CTAB to reduce the amount of polysaccharides. The upper phase was collected in aliquots of 450 µl into new 1.5 ml Eppendorf tubes. The samples were precipitated with ice-cold 96% ethanol and dissolved in 50 µl H2O. DNA extracts were further purified by either a PrepA-Gene purification kit (Bio-Rad) (year 2001) or a NucleoTrap purification kit (Macherey-Nagel) (year 2002). Aliquots of RNA samples were treated with RNase-free DNase (Promega) for 30 min at 37°C. DNase was inactivated and removed by phenol-chloroform extraction followed by ethanol precipitation. The quality of DNA was checked in 1.5% agarose gel and the total RNA in 1.2% agarose formaldehyde gels. Reverse transcription of RNA. RNA was converted to cDNA in reverse transcription. The 20 µl reaction volume contained 7.5 µl of RNA, 1.5 µl of random nonamers, 500 µM dNTPs, 2 µl of 10 × M-MuLV buffer, 200 U of M-MuLV reverse transcriptase (Finnzymes) and 7 µl of DEPC-water. The absence of contaminating DNA in RNA samples was tested by performing the PCR reaction without reverse transcription step (RT negative control). Extracted total nucleic acids (including DNA) were amplified for positive control and sterile water for negative control of PCR. After PCR, aliquots of the RT products together with positive and negative controls were analysed by electrophoresis in 1.5% agarose gel. PCR amplification of 16S rRNA fragments. Eubacterial 16S rRNA gene primers F-968-GC and R-1401 (Nübel et al. 1996) were used to amplify PCR products for DGGE. PCR reactions were performed in a volume of 25 µl containing 2 µl of template DNA or cDNA, 200 nM of primers F-968-GC and R-1401, 200 µM dNTP solution, 2.5 µl of 10 × reaction buffer, 1 M Betaine (Sigma), 0.3 U of DyNAzymeTM II DNA Polymerase (Finnzymes) and sterile water up to 25 µl. The PCR program consisted of a denaturing step of 94°C for 3 min followed by 35 cycles of 94°C for 1 min, 51°C for 1 min and 72°C for 2 min. A final extension step of 72°C for 10 min was then performed. The size and purity of the amplification products were checked in 1.5% agarose gel. Two parallel PCR reactions from each sample were prepared and combined after amplification by ethanol precipitation and dissolved in 25 µl of water. The combined PCR products were loaded into the DGGE gel. DGGE analysis. Approximately 400 bp long DNA- and RNA-derived amplification products were analyzed in parallel in DGGE gels. DGGE buffers and gels were prepared according to the manufacturer’s instructions for
203
the DcodeTM Universal Mutation Detection system (BioRad). A peristaltic pump system together with the Gradient Maker (Amersham Pharmacia Biotech) was used for casting of the gels. PCR products were separated in 6% polyacrylamide gels in 0.5 × TAE (20 mM Tris-acetate, 10 mM acetate, 0.5 mM Na2EDTA) with a denaturing gradient from 35 to 55% denaturants (urea and formamide). DGGE gels were polymerised over night. Electrophoresis was performed for 4.5 h at a constant voltage of 150 V and a temperature of 60°C in the DcodeTM apparatus containing a magnetic stirrer bar. After electrophoresis, the gels were stained for 40 min with Gelstar nucleic acid stain (BioWhittaker Molecular Applications) and recorded under UV-light using Kodak 1D image analysis software. Standards for the DGGE gels were prepared by running PCR amplified DNA samples isolated from cyanobacterial cultures or lake samples in DGGE and excising 5 intense DGGE bands at different levels from the gel so that the majority of the bands in the Lake Joutikas samples were located between the positions of the shortest and furthest migrating standard bands. A mixture of these PCR products was used as a standard in each DGGE gel. Three standard lanes were included on every gel. The DNA- and RNA-derived samples were analysed side by side in DGGE gels. The presence and intensity of bands in DGGE gels was transformed into numerical data by GelCompar 4.1 software (Applied Maths BVBA). The software measured an optical density profile through each DGGE lane (sample), and calculated the band positions and relative (%) intensity of each band against the whole lane (100%). Sequencing of PCR products. Prominent DNA bands were excised from the DGGE gels with a sterile scalpel and eluted from the gel slices by sterile water at 4°C overnight. These eluted products were reamplified and the PCR products were separated again in DGGE. Separated products were reamplified with primers F-968, without the GC-clamp, and R-1401 and purified by Microcon PCR purification tubes (Millipore). The purified products were sequenced with the Big Dye cycle sequencing ready reaction kit (Applied Biosystems) according to the manufacturer’s instructions using the reverse primer R-1401. Sequencing reactions were analysed by an Applied Biosystems 310 genetic analyser. More than 100 bands were sequenced to get all the main bands at different positions on the gel sequenced at least once. Finally, 33 different good quality sequences were obtained. Analysis of data. A BLAST search (Altschul et al. 1997) at the GenBank database was performed for the 16S rRNA sequences retrieved from the lake samples. Our sequences were aligned with the sequences of the highest similarity using the ARB software package
204
Aquat Microb Ecol 36: 201–211, 2004
(version; Linux Beta 030822, O. Strunk and W. Ludwig, Technische Universität München [www.arb-home. de]). The full-length sequences were added to the ARB database by using the maximum parsimony tool. Shorter sequences (< 600 bases, including the sequences of this study and the Changjiang River sequences) were added to the tree with the ARB parsimony tool, which allows the addition of short sequences to existing phylogenetic trees without changing global tree topologies. Alignments were checked and corrected manually. Dendrograms for each phylogenetic group were obtained by using the Phylip DNAPARS parsimony tool included in the ARB software.
RESULTS The sequence similarities for the 33 different sequences obtained from the DGGE bands are shown in Table 2. The phylogenetic analysis of the sequences gave 9 distinct clusters: Actinobacteria, CFB (Cytophaga-Flavobacterium-Bacteroides), Chloroflexi (formerly called green nonsulfur bacteria), Verrucomicrobia, α-, β-, γ- and δ-Proteobacteria and Cyanobacteria (Fig. 1A–F). Most of the sequences had nearest relatives among uncultured species sequenced from freshwater environments in other studies. In the BLAST search the DGGE bands of cyanobacteria showed 98 to 100% similarity to several Anabaena or Microcystis species. Only the names that were listed first are shown in Table 2. Based on microscopic analysis of the cyanobacterial community genera Anabaena and Aphanizomenon were the most prevalent genera of the bloom in both years (Fig. 2). The total biomass of Anabaena was about 3-fold in 2002 (17.9 mg l–1) compared to 2001 (5.9 mg l–1). For these genera the microscopy and sequencing results of DGGE bands corresponded well. In 2001, 4 different Anabaena/Aphanizomenon morphotypes were prevalent in the bloom according to microscopic identification (Anabaena fusca, Anabaena macrospora, Aphanizomenon flexuosum, and Aphanizomenon gracile) and also 4 strong bands representing phylotypes of Anabaena/Aphanizomenon were detected from the DGGE gels (bands 2, 3, 4 and 7). In 2002 only one dominant Anabaena morphotype (A. macrospora) was identified under the microscope and accordingly only one intense band (7) was seen in the DGGE gel. The biomass of Microcystis was 9-fold in 2001 compared to the year 2002 (Fig. 2). Accordingly, in the DGGE gel, 2 intense bands showing a similarity to Microcystis (5 and 6) were seen in 2001 but in 2002 they were weak (Fig. 3). Yet, their relative intensity
among cyanobacterial bands obtained from the 5 µm filter was rather high (Fig. 3). In DGGE, 2 intense Synechococcus bands (8 and 9) were seen in 2002, one less intense one (9) was seen in 2001 (Fig. 3). As with Microcystis, the relative biomass of Synechococcus detected by microscopy was much lower than indicated by DGGE (Fig. 2). Determined by microscopy, Woronichinia was abundant in both years and Aphanocapsa in 2001, but no sequenced band showed a similarity to these genera. For all cyanobacteria the DNA- and RNA-derived DGGE patterns looked very similar (Fig. 3). The microcystin concentration in the surface sample was 0.67 µg l–1 in 2001 and 14 µg l–1 in 2002 (Table 1). Thus, the cyanobacterial community was more toxic in 2002. The structure of the heterotrophic bacterial community in the Lake Joutikas samples based on DGGE fingerprinting and sequence analysis was somewhat different in 2001 and 2002, but the main bacterial groups remained the same (Figs. 3 & 4). The most abundant bacterial groups in both years were Verrucomicrobia, Actinobacteria and Chloroflexi. Verrucomicrobia was the most abundant group in both years in both DNA- and RNA-derived profiles. The presence of Actinobacteria and Chloroflexi was less pronounced in RNA- than in DNA-derived analysis, especially in 2002. γ-Proteobacteria (bands 20 and 21 in Fig. 3) was an additional abundant group in 2001. Sequences related to α-Proteobacteria (bands 17 and 18) and β-Proteobacteria (band 19) were present as minor groups on DGGE profiles in 2001. δ-Proteobacteria (band 22), 2 Actinobacteria-related bands (28 and 29) and CFB (band 25) were new sequence types which appeared in 2002. The number of Actinobacteriarelated DNA-derived bands was higher in 2002 than 2001 (Fig. 3, 0.2 µm filter), but in general, more bands were observed in 2001 than in 2002 indicating a more diverse community in 2001. For certain phylotypes, the intensities of DNA- and RNA-derived bands differed clearly (Fig. 4). Bands representing Actinobacteria (bands 26, 27, 28, 29 and 30), Chloroflexi (band 23) and one phylotype of Verrucomicrobia (band 13) were intense in DNA-derived DGGE profiles but faint in RNA-derived DGGE profiles, indicating that these phylotypes represented numerically abundant taxa that, however, did not contribute substantially to the biomass and were perhaps inactive. On the other hand, certain representatives of Aphanizomenon sp. (band 10), Verrucomicrobia (band 12), CFB (band 25), and eukaryotic chloroplasts (band 33) had relatively strong bands in the RNA-derived profiles compared to the DNA-derived profiles. These phylotypes probably contributed to the biomass more than their numbers estimated by DNA-analysis would have indicated.
Jo23, 76, 158, 162-01 Jo115-01
Jo62, 97-01 Jo127, 170-01 Jo39-02 Jo61, 87, 136-01 Jo84-01 Jo24-02 Jo88-01, Jo32-02 Jo153-01 Jo51-02 Jo41-02, 52-02 Jo125-01 Jo70-01, 117-01 Jo31-02 Jo145-01
12 13 14 15 16 17
18 19
20 21 22 23 24 25 26 27 28 29 30 31 32 33
Original code for DGGE bands
Jo50, 51, 68, 79, 98-01 Jo1, 24-01 Jo2, 25-01 Jo3, 65-01 Jo27, 42, 53-01 Jo78-01 Jo38, 44-02 Jo46-02 Jo3-02 Jo 126-01 Jo11, 32, 33, 74, 122, 152, 169, 172-01 Jo47, 53-02 Jo95, 123, 135, 150-01 Jo10, 35, 56-02 Jo7, 118, 128, 146-01 Jo119, 147-01 Jo60-01, Jo27-02 Jo151-01
1 2 3 4 5 6 7 8 9 10 11
No. in DGGE gel (Fig. 3)
AJ620842 AJ620843 AJ620844 AJ620845 AJ620846 AJ620847 AJ620848 AJ620849 AJ620850 AJ620851 AJ620852 AJ620853 AJ620854 AJ620855
AJ621043 AJ620841
AJ620835 AJ620836 AJ620837 AJ620838 AJ620839 AJ620840
AJ620824 AJ620825 AJ620826 AJ620827 AJ620828 AJ620829 AJ620830 AJ620831 AJ620832 AJ620833 AJ620834
Accession no.
93 96 97 1000 99 1000 97 1000 1000 1000 1000 95 96 92
96 89
94 99 97 1000 99 93
99 99 98 98 1000 98 1000 98 99 1000 98
Similarity (%)
Uncultured bacterium FukuN106 Uncultured bacterium FukuN106 Uncultured bacterium FukuS27 Uncultured bacterium CR99-2-04 Unidentified eubacterium LD19 Uncultured α-proteobacterium MB13G10 Caulobacter sp. Uncultured beta proteobacterium clone 44a-U1-9 Thiocapsa roseopersicina 1711 Uncultured bacterium LO13.6 Uncultured bacterium mle1-27 Uncultured bacterium clone CR99-24-49 Uncultured bacterium clone CR99-35-18 Uncultured bacterium clone CR98-35-74 Gram-positive bacterium SOGA22 Uncultured bacterium CR99-2-31 Uncultured bacterium clone HT2E3 Uncultured bacterium GKS2-103 Uncultured bacterium CR99-2-40 Unidentified cryptomonad OM283 Rhodomonas abbreviata Chloroplast Guillardia theta
Anabaena solitaria Anabaena flos-aquae NRC525-17 Anabaena flos-aquae NRC525-17 Anabaena flos-aquae NRC525-17 Microcystis flos-aquae UWOCC C3 Microcystis aeruginosa NIES89 Anabaena spiroides Synechococcus sp. TAG Synechococcus sp. BO8807 Aphanizomenon flos-aquae Uncultured bacterium FukuN106
Organism
AF113000 AF358020 AF280857 AF429159 AF428976 AF428956 AJ244799 AF429217 AJ290054 AJ290024 AF429226 U70724 AF545627 AF041468
AJ227766 AY082479
AJ289983 AJ289983 AJ290012 AF429190 AF009974 AY033319
AJ293105 AF247597 AF247597 AF247597 AF139329 U03403 AJ293116 AF448066 AF317074 AY038035 AJ289983
Accession no.
Biofilm of acid mine drainage system
α-Proteobacteria β-Proteobacteria
Prevost lagoon, France Peat soil, UK Wastewater bioreactor Changjiang River, China Changjiang River, China Changjiang River, China Cuttlefish glands, English Channel, France Changjiang River, China Lake Fuchskuhle, Germany Lake Gossenkoellesee, Austria Changjiang River, China Cape Hatteras, NC, USA
Lake Fuchskuhle, Germany Lake Fuchskuhle, Germany Lake Fuchskuhle, Germany Changjiang River, China Lake Loosdrecht, The Netherlands Monterey Bay, CA, USA
Verrucomicrobia Verrucomicrobia Verrucomicrobia Verrucomicrobia Verrucomicrobia α-Proteobacteria
γ-Proteobacteria γ-Proteobacteria δ-Proteobacteria Chloroflexi Chloroflexi CFB Actinobacteria Actinobacteria Actinobacteria Actinobacteria Actinobacteria Cryptophyta Chloroplast Cryptophyta Chloroplast Cryptophyta Chloroplast
Lake Constance, Central Europe Brielse Meer, The Netherlands Lake Fuchskuhle, Germany
Lake Karpjärvi, Finland Buffalo Pound Lake, Canada Buffalo Pound Lake, Canada Buffalo Pound Lake, Canada United States Lake Kawaguchi, Japan Lake Aydat, France
Source
Cyanobacteria Cyanobacteria Cyanobacteria Cyanobacteria Cyanobacteria Cyanobacteria Cyanobacteria Cyanobacteria Cyanobacteria Cyanobacteria Verrucomicrobia
Taxonomic description
Table 2. Sequence similarities of the excised DGGE bands from Lake Joutikas in 2001 and 2002
Kolmonen et al.: Diversity of bacteria in cyanobacterial blooms 205
206
Aquat Microb Ecol 36: 201–211, 2004
Fig. 1. The most parsimonious 16S rRNA trees of bacterial groups detected from Lake Joutikas constructed by ARB. (A) Actinobacteria, (B) Cytophaga-Flavobacterium-Bacteroides (CFB) group, (C) Chloroflexi, (D) Verrucomicrobia, (E) Proteobacteria, and (F) Cyanobacteria. Bands 1 to 33 indicate the bands represented in DGGE gel in Fig. 3 and explained in Table 2. Outgroup for each tree (not shown) was chosen outside the targeted group
Kolmonen et al.: Diversity of bacteria in cyanobacterial blooms
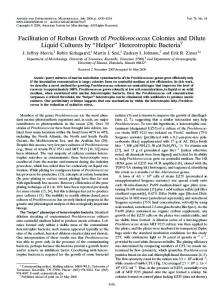
Fig. 2. Relative composition of the cyanobacterial community in blooms in 2001 and 2002 as determined by microscopy (biomasses, µg l–1) and sequencing of DGGE phylotypes (relative intensities of sequenced bands in RNA-derived DGGE gels)
207
Fig. 4. Relative composition of the heterotrophic bacterial community in blooms in 2001 and 2002 as determined by intensities of bands from DNA- and RNA-derived DGGE gels. Bands from the filters with pore sizes 1 and 0.2 µm were used in the diagrams
were the same (Anabaena/Aphanizomenon). The taxonomy of cyanobacteria was previously based on morWe studied the diversity of cyanobacteria and hetphological features, which makes comparison of erotrophic bacteria present in the cyanobacterial microscopic and sequencing results difficult. Curblooms in the eutrophic Lake Joutikas. Different rently, however, cyanobacterial taxonomy is under cyanobacterial species dominated the bloom in the revision to accommodate phylogenetic relationships. studied years but the dominant cyanobacterial genera The genera Anabaena and Aphanizomenon have very similar 16S rRNA gene sequences (Castenholz 2001, Gugger et al. 2002). Seven Anabaena/Aphanizomenon morphotypes were detected under the microscope and 4 of them were very abundant. Six (bands 1, 2, 3, 4, 7 and 10) different genotypes were detected from DGGE gels that belonged to the genera Anabaena/ Aphanizomenon. The same closest relative (Anabaena flos-aquae) was retrieved for bands 2, 3 and 4 from GenBank even if the bands migrated at different levels in the gel. It is possible that these bands were from different subspecies of genera Anabaena/Aphanizomenon or different copies of the 16S rRNA gene in one organism (Iteman et al. 2002). Anabaena is known as the most important toxin-producing genus in Finnish lakes (Sivonen et al. 1990). In our study, in 2002 the cyanobacterial Fig. 3. DGGE patterns of DNA- and RNA-derived 16S rRNA products amplified population was dominated by Anafrom Lake Joutikas samples from years 2001 and 2002. Samples were from filters baena and the detected microcystin with pore size 5, 1 and 0.2 µm and non-filtered bloom sample. For bands numbered 1–33 sequence similarities with GenBank sequences are shown in Table 2 level was higher than in 2001. DISCUSSION
208
Aquat Microb Ecol 36: 201–211, 2004
The genera Anabaena/Aphanizomenon had a greater biomass than genus Microcystis, although their band intensities in DGGE were similar in the 2001 samples. This might be due to different DNA-cell biomass ratios in the 2 genera with different cell morphologies or due to different amplification efficiency in PCR (Wintzingerode et al. 1997). In this study, the cyanobacterial genera that formed only a small part of the biomass under the microscope were not detected by DGGE or their bands were too faint to be excised for sequencing. Microscopy and sequencing results of DGGE bands have also previously been found to correspond with each other so that organisms present at higher cell concentrations were recovered from the sequenced DGGE bands, but not the ones with lower cell concentrations (Casamayor et al. 2000, 2002). Roughly, DGGE cannot detect populations whose abundance is less than 1% of the total cell count (Muyzer et al. 1993). In Lake Joutikas the main heterotrophic bacterial divisions present in the blooms on both sampling dates were Verrucomicrobia, Actinobacteria and Chloroflexi. The same bacterial divisions have been found in other freshwater environments (e.g. Hiorns et al. 1997, Crump et al. 1999, Konopka et al. 1999, Casamayor et al. 2000, 2002, Glöckner et al. 2000, Lindström & Leskinen 2002, Zwart et al. 2002). The CytophagaFlavobacterium-Bacteroides group (CFB), a very common bacterial division in freshwaters, was found in RNA-derived gels in 2002. α-, β-, and γ-Proteobacteria were detected in 2001 but not in 2002. In 2002 δ-Proteobacteria were present instead. Of our sequences representing Verruromicrobia, Jo11-01, Jo10-02 and Jo95-01 were related to the sequences from the group FukuN18 (Zwart et al. 2002), sequence Jo60-01 to group LD19 and sequence Jo119-01 to CL120-10. All Verrucomicrobia found in this study have also been commonly found in other Finnish lakes with various trophic statuses (Haukka et al. unpubl. results). Our sequences Jo41-02, Jo125-01 and Jo153-01, representing Actinobacteria, were related to the sequences from group ACK-M1 (Zwart et al. 2002) as well as to the sequences from other Finnish lakes (Haukka et al. unpubl. results). The actinobacterial band 26, which appeared in a lower position in the gel than the other Actinobacteria, had a sequence further related to the other Actinobacteria sequences found in Lake Joutikas. Two of our sequences belonged to the phototrophic division Chloroflexi, formerly called green non-sulphur bacteria (Björnsson et al. 2002). Sequences belonging to the organisms in this division have previously been found in contrasting environments, e.g. at 500 m depth in the ultra-oligotrophic Crater Lake (Urbach et al. 2001), in the chemocline of the meromictic alpine Lake
Cadagno (Bosshard et al. 2000) and in wastewater treatment plants (Björnsson et al. 2002). Our sequences were very similar to the partial sequences (600 bp) obtained from the Changjiang River or the adjacent lakes (CR99-35-18 and CR99-24-49 by Sekiguchi et al. (2002), but they did not seem to be closely related to any full-length Chloroflexi sequences. The divisions Proteobacteria, Actinobacteria, Verrucomicrobia and the CFB group have previously been found in the cyanobacteria-dominated Lakes Loosdrecht and IJssel in the Netherlands (Zwart et al. 1998, 2002) and in the Adirondack Mountain lakes in the eastern USA, which contained a low number of cyanobacteria (Hiorns et al. 1997). A similar bacterial community composition has also been found in other lakes, reservoirs and rivers (Crump et al. 1999, Glöckner et al. 2000, Trusova & Gladyshev 2002, Sekiguchi et al. 2002, O’Sullivan et al. 2002). Members of the CFB group are very common freshwater bacteria (Kenzaka et al. 1998, Crump et al. 1999, Sekiguchi et al. 2002, O’Sullivan et al. 2002) and they are known to play an important role in the turnover of organic matter (Cottrell & Kirchman 2000). Cytophaga sp., belonging to CFB, is known for its ability to produce exopolysaccharide slime (Larkin 1989), which could explain the large amount of slime in our samples in 2002. Studies of various freshwater microbial communities have shown that the β-proteobacterial group often comprises a large proportion of freshwater bacterial communities (Hiorns et al. 1997, Pernthaler et al. 1998, Glöckner et al. 2000), but it was rare in Lake Joutikas. A primer set of F-968 and R-1401 (Nübel et al. 1996) for the eubacterial 16S rRNA gene region was used in this study while in many other DGGE studies of freshwater (e.g. Casamayor et al. 2000, 2002, Jaspers et al. 2001, J. Pernthaler et al. 2001, Kisand & Wikner 2003) a primer set of F341 and R907 (Muyzer et al. 1995) has been used. The number of CFB and β-Proteobacteriarelated groups that we found from Lake Joutikas were lower than previously found elsewhere in freshwaters by the primer set of F341 and R907. Therefore we checked the sequences of our primers in the ARB database and confirmed their theoretical ability also to amplify CFB and β-proteobacterial sequences. We have also studied less eutrophic Finnish lakes using DGGE with the primers F-968 and R-1401. In the mesoeutrophic Lake Vesijärvi, the meso-oligotrophic Lake Ahvenlammi and the humic Lake Sammalisto Actinobacteria were the most prominent members followed by Verrucomicrobia (our unpubl. results). In all cases the α-, β-, γ- and δ-Proteobacteria, CFB-group and other divisions were detected sporadically. The possible effect of the choice of the primer set in the community composition detected by DGGE is not known.
Kolmonen et al.: Diversity of bacteria in cyanobacterial blooms
In many studies the analysis of RNA-derived DGGE bands has been used to identify the possibly active populations of different environments (Teske et al. 1996, Griffiths et al. 2000, Schäfer et al. 2001, Norris et al. 2002, Troussellier et al. 2002). Indeed, several studies support the use of cellular RNA or the ribosome content, as an indicator of in situ growth rate of a chosen bacterial population in natural assemblages (Poulsen et al. 1993, Binder & Liu 1998, Worden & Binder 2003). However, while the copy number of rRNA gene operons per chromosome is typically under 10 in environmental bacteria (Klappenbach et al. 2000), the number of ribosomes can vary greatly among different species. A marine oligotrophic ultramicrobacterium was found to reach a maximum of 2000 ribosomes per cell in mid-log phase but even 200 ribosomes per cell were sufficient for maximum rates of growth (Fegatella et al. 1998). On the contrary, marine Vibrio cells were found to contain 20 000 to 35 000 ribosomes at the onset, and 8000 ribosomes after 4 d of starvation (Flärdh et al. 1992). Additionally, the number of ribosomes varies between the different phases of the cell cycle depending on e.g. the growth strategy of the species (A. Pernthaler et al. 2001) and temperature (Lee & Kemp 1994). However, in general, it seems that the ribosome content is correlated with the cell size, which in turn is related to biomass (Kemp et al. 1993, Binder & Liu 1998). Thus the RNA-based DGGE analysis might give a better picture than the DNA-based DGGE analysis on those bacteria that form a substantial fraction of biomass in the studied community. In our case, DNA- and RNA-derived DGGE bands of the same samples were different. Typically the actinobacterial bands were strong in DNA- and weak in RNA-derived gels, which would indicate that even if they are numerous their biomass is relatively low in the community. This is supported by the recent results that Actinobacteria can numerically constitute even more than a half of the bacteria in freshwater picoplankton, but they are small in size (Sekar et al. 2003). In addition, their growth strategy might be comparable to such strains as the marine oligotrophic ultramicrobacterium Sphingomonas sp., which was shown to contain a low number of ribosomes even when it is active (Fegatella et al. 1998). However, severe biases have been reported in the use of PCR-based methods and therefore quantitative comparison of the results should be made cautiously (Wintzingerode et al. 1997). Substrate availability, weather conditions such as temperature and light, and predation influence the composition of cyanobacterial and heterotrophic bacterial communities in aquatic environments (Muylaert et al. 2002). The water temperature in Lake Joutikas was over 20°C on both of our sampling dates and during most of the summer. High temperatures together
209
with high phosphorous levels were the probable factors that favoured the growth of cyanobacteria. Cyanobacteria as a source of organic material have been found to lead to a different bacterial community composition than green algae (van Hannen et al. 1999a). The highest abundances of heterotrophic bacteria have previously been observed during and after the cyanobacterial bloom in freshwater (Mayer et al. 1997, Bouvy et al. 2001). The increase in the number of bacteria is probably due to the release of easily utilisable dissolved organic matter from cyanobacterial exudates during the bloom and after its breakdown. Temporal changes in the bacterial community may occur in freshwater in a short period of time (Höfle et al. 1999, Jaspers et al. 2001, Van der Gucht et al. 2001). Complex interactions exist between phytoplankton, bacteria (Riemann et al. 2000), viruses (van Hannen et al. 1999b), protozoa (J. Pernthaler et al. 2001) and zooplankton (Höfle et al. 1999) in aquatic environments that all affect to the composition of the cyanobacterial and other bacterial communities. We were interested in the diversity of cyanobacteria and heterotrophic bacteria occurring together in cyanobacterial blooms. We found typical freshwater bacteria in the blooms. Our results suggest that the heterotrophic bacterial community of the lake is present in a bloom regardless of the autotrophic bacterial phylotypes forming the bloom. Future studies should investigate whether certain heterotrophic bacteria have more specific interactions with cyanobacteria and whether the cyanobacterial toxins have an effect on the diversity and activity of the heterotrophic bacteria. Acknowledgements. We thank P Rajaniemi and R Holopainen for help with sampling, L Villa from the Uusimaa Regional Environment Centre for physical and chemical data, T Finni for the microscopical analyses and L. Lepistö from the Finnish Environment Institute for collecting the microscopy results. C Lyra is acknowledged for critical reading of the manuscript. This work was supported by the EnSTe graduate school, Maj and Tor Nessling foundation and the Academy of Finland.
LITERATURE CITED Altschul SF, Madden TL, Schaffer AA, Zhang J, Zhang Z, Miller W, Lipman DJ (1997) Gapped BLAST and PSIBLAST: a new generation of protein database search programs. Nucleic Acids Res 25:3389–3402 Bernard L, Schäfer H, Joux F, Courties C, Muyzer G, Lebaron P (2000) Genetic diversity of total, active and culturable marine bacteria in coastal seawater. Aquat Microb Ecol 23:1–11 Binder BJ, Liu YC (1998) Growth rate regulation of rRNA content of a marine Synechococcus (Cyanobacterium) strain. Appl Environ Microbiol 64:3346–3351 Björnsson L, Hugenholtz P, Tyson GW, Blackall LL (2002) Filamentous Chloroflexi (green non-sulfur bacteria) are abundant in wastewater treatment processes with biological nutrient removal. Microbiology 148:2309–2318
210
Aquat Microb Ecol 36: 201–211, 2004
Bosshard PP, Santini Y, Grüter D, Stettler R, Bachofen R (2000) Bacterial diversity and community composition in the chemocline of the meromictic alpine Lake Cadagno as revealed by 16S rDNA analysis. FEMS Microbiol Ecol 31: 173–182 Bouvy M, Pagano M, Troussellier M (2001) Effects of a cyanobacterial bloom (Cylindrospermopsis raciborskii) on the bacteria and zooplankton communities in Ingazeira reservoir (northeast Brazil). Aquat Microb Ecol 25: 215–227 Casamayor EO, Schäfer H, Baneras L, Pedrós-Alió C, Muyzer G (2000) Identification of and spatio-temporal differences between microbial assemblages from two neighboring sulfurous lakes: comparison by microscopy and denaturing gradient gel electrophoresis. Appl Environ Microbiol 66:499–508 Casamayor EO, Pedrós-Alió C, Muyzer G, Amann R (2002) Microheterogeneity in 16S ribosomal DNA-defined bacterial populations from a stratified planktonic environment is related to temporal changes and to ecological adaptations. Appl Environ Microbiol 68:1706–1714 Castenholz RW (2001) Phylum BX. Cyanobacteria. In: Boone, DR, Castenholz RW (eds) Bergey’s Manual of Systematic Bacteriology, 2nd edn, Vol 1. Springer-Verlag, New York, p 566–571 Cottrell MT, Kirchman DL (2000) Natural assemblages of marine proteobacteria and members of the CytophagaFlavobacter cluster consuming low- and high-molecularweight dissolved organic matter. Appl Environ Microbiol 66:1692–1697 Crump BC, Armbrust EV, Baross JA (1999) Phylogenetic analysis of particle-attached and free-living bacterial communities in the Columbia River, its estuary, and the adjacent coastal ocean. Appl Environ Microbiol 65:3192–3204 Fegatella F, Lim J, Kjelleberg S, Cavicchioli R (1998) Implications of rRNA operon copy number and ribosome content in the marine oligotrophic ultramicrobacterium Sphingomonas sp. strain RB2256. Appl Environ Microbiol 64: 4433–4438 Flärdh K, Cohen PS, Kjelleberg S (1992) Ribosomes exist in large excess over the apparent demand for protein synthesis during carbon starvation in marine Vibrio sp. strain CCUG 15956. J Bacteriol 174:6780–6788 Glöckner FO, Zaichikov E, Belkova N, Denissova L, Pernthaler J, Pernthaler A, Amann R (2000) Comparative 16S rRNA analysis of lake bacterioplankton reveals globally distributed phylogenetic clusters including an abundant group of actinobacteria. Appl Environ Microbiol 66: 5053–5065 Griffiths RI, Whiteley AS, O’Donnell AG, Bailey MJ (2000) Rapid method for coextraction of DNA and RNA from natural environments for analysis of ribosomal DNA- and rRNA-based microbial community composition. Appl Environ Microbiol 66:5488–5491 Gugger M, Lyra C, Henriksen P, Couté A, Humbert JF, Sivonen K (2002) Phylogenetic comparison of the cyanobacterial genera Anabaena and Aphanizomenon. Int J Syst Evol Microbiol 52:1867–1880 Hiorns WD, Methe BA, Nierzwicki-Bauer SA, Zehr JP (1997) Bacterial diversity in Adirondack mountain lakes as revealed by 16S rRNA gene sequences. Appl Environ Microbiol 63:2957–2960 Höfle MG, Haas H, Dominik K (1999) Seasonal dynamics of bacterioplankton community structure in a eutrophic lake as determined by 5S rRNA analysis. Appl Environ Microbiol 65:3164–3174 Iteman I, Rippka R, Tandeau de Marsac N, Herdman M (2002)
rDNA analyses of planktonic heterocystous cyanobacteria, including members of the genera Anabaenopsis and Cyanospira. Microbiology 148:481–496 Jaspers E, Nauhaus K, Cypionka H, Overmann J (2001) Multitude and temporal variability of ecological niches as indicated by the diversity of cultivated bacterioplankton. FEMS Microbiol Ecol 36:153–164 Kemp PF, Lee S, LaRoche J (1993) Estimating the growth rate of slowly growing marine bacteria from RNA content. Appl Environ Microbiol 59:2594–2601 Kenzaka T, Yamaguchi N, Tani K, Nasu M (1998) rRNAtargeted fluorescent in situ hybridization analysis of bacterial community structure in river water. Microbiology 144:2085–2093 Kisand V, Wikner J (2003) Limited resolution of 16S rDNA DGGE caused by melting properties and closely related DNA sequences. J Microbiol Methods 54:183–191 Klappenbach JA, Dunbar JM, Schmidt TM (2000) rRNA operon copy number reflects ecological strategies of bacteria. Appl Environ Microbiol 66:1328–1333 Konopka A, Bercot T, Nakatsu C (1999) Bacterioplankton community diversity in a series of thermally stratified lakes. Microb Ecol 38:126–135 Kuiper-Goodman T, Falconer I, Fitzgerald J (1999) Human health aspects. In: Chorus I, Bartram J (eds) Toxic cyanobacteria in water. E & FN Spon on behalf of WHO, London, p 113–153 Larkin JM (1989) Nonphotosynthetic, nonfruiting, gliding bacteria. In: Staley JT, Bryant MP, Pfennig, Holt JG (eds) Bergey’s Manual of Systematic Bacteriology, 1st edn, Vol 3. Williams & Wilkins, Baltimore, p 2010–2050 Lee SH, Kemp PF (1994) Single-Cell RNA content of natural marine planktonic bacteria measured by hybridization with multiple 16S rRNA-targeted fluorescent probes. Limnol Oceanogr 39:869–879 Lindström ES, Leskinen E (2002) Do neighboring lakes share common taxa of bacterioplankton? Comparison of 16S rDNA fingerprints and sequences from three geographic regions. Microb Ecol 44:1–9 Mayer J, Dokulil MT, Salbrechter M, Berger M and 6 others (1997) Seasonal successions and trophic relations between phytoplankton, zooplankton, ciliate and bacteria in a hypertrophic shallow lake in Vienna, Austria. Hydrobiologia 342/343:165–174 Muylaert K, Van Der Gucht K, Vloemans N, Meester LD, Gillis M, Vyverman W (2002) Relationship between bacterial community composition and bottom-up versus topdown variables in four eutrophic shallow lakes. Appl Environ Microbiol 68:4740–4750 Muyzer G, Smalla K (1998) Application of denaturing gradient gel electrophoresis (DGGE) and temperature gradient gel electrophoresis (TGGE) in microbial ecology. Antonie Van Leeuwenhoek 73:127–141 Muyzer G, de Waal E, Uitterlinden A (1993) Profiling of complex microbial populations by denaturing gradient gel electrophoresis analysis of polymerase chain reactionamplified genes coding for 16S rRNA. Appl Environ Microbiol 59:695–700 Muyzer G, Teske A, Wirsen CO, Jannasch HW (1995) Phylogenetic relationships of Thiomicrospira species and their identification in deep-sea hydrothermal vent samples by denaturing gradient gel electrophoresis of 16S rDNA fragments. Arch Microbiol 164:165–172 Norris TB, Wraith JM, Castenholz RW, McDermott TR (2002) Soil microbial community structure across a thermal gradient following a geothermal heating event. Appl Environ Microbiol 68:6300–6309
Kolmonen et al.: Diversity of bacteria in cyanobacterial blooms
211
Nübel U, Engelen B, Felske A, Snaidr J, Wieshuber A, Amann RI, Ludwig W, Backhaus H (1996) Sequence heterogeneities of genes encoding 16S rRNAs in Paenibacillus polymyxa detected by temperature gradient gel electrophoresis. J Bacteriol 178:5636–5643 O’Sullivan LA, Weightman AJ, Fry JC (2002) New degenerate Cytophaga-Flexibacter-Bacteroides-specific 16S ribosomal DNA-targeted oligonucleotide probes reveal high bacterial diversity in River Taff epilithon. Appl Environ Microbiol 68:201–210 Paerl HW (1984) Transfer of N2 and CO2 fixation products from Anabaena oscillarioides to associated bacteria during inorganic carbon sufficiency and deficiency. J Phycol 20:600–608 Pernthaler J, Glöckner FO, Unterholzner S, Alfreider A, Psenner R, Amann R (1998) Seasonal community and population dynamics of pelagic bacteria and archaea in a high mountain lake. Appl Environ Microbiol 64:4299–4306 Pernthaler A, Pernthaler J, Eilers H, Amann R (2001) Growth patterns of two marine isolates: adaptations to substrate patchiness? Appl Environ Microbiol 67:4077–4083 ˇ Pernthaler J, Posch T, Simek K, Vrba J and 5 others (2001) Predator-specific enrichment of actinobacteria from a cosmopolitan freshwater clade in mixed continuous culture. Appl Environ Microbiol 67:2145–2155 Poulsen LK, Ballard G, Stahl DA (1993) Use of rRNA fluorescence in situ hybridization for measuring the activity of single cells in young and established biofilms. Appl Environ Microbiol 59:1354–1360 Rapala J, Lahti K, Räsänen LA, Esala AL, Niemelä SI, Sivonen K (2002) Endotoxins associated with cyanobacteria and their removal during drinking water treatment. Water Res 36:2627–2635 Riemann L, Steward GF, Azam F (2000) Dynamics of bacterial community composition and activity during a mesocosm diatom bloom. Appl Environ Microbiol 66:578–587 Schäfer H, Bernard L, Courties C, Lebaron P and 7 others (2001) Microbial community dynamics in Mediterranean nutrient-enriched seawater mesocosms: changes in the genetic diversity of bacterial populations. FEMS Microbiol Ecol 34:243–253 Sekar R, Pernthaler A, Pernthaler J, Warnecke F, Posch T, Amann R (2003) An improved protocol for quantification of freshwater Actinobacteria by fluorescence in situ hybridization. Appl Environ Microbiol 69:2928–2935 Sekiguchi H, Watanabe M, Nakahara T, Xu B, Uchiyama H (2002) Succession of bacterial community structure along the Changjiang River determined by denaturing gradient gel electrophoresis and clone library analysis. Appl Environ Microbiol 68:5142–5150 Sivonen K, Niemelä SI, Niemi RM, Lepistö L, Luoma TH, Räsänen LA (1990) Toxic cyanobacteria (blue-green algae) in Finnish fresh and coastal waters. Hydrobiologia 190:267–275
Teske A, Wawer C, Muyzer G, Ramsing NB (1996) Distribution of sulfate-reducing bacteria in a stratified fjord (Mariager Fjord, Denmark) as evaluated by most-probable-number counts and denaturing gradient gel electrophoresis of PCR-amplified ribosomal DNA fragments. Appl Environ Microbiol 62:1405–1415 Troussellier M, Schäfer H, Batailler N, Bernard L and 5 others (2002) Bacterial activity and genetic richness along an estuarine gradient (Rhone River plume, France). Aquat Microb Ecol 28:13–24 Trusova MY, Gladyshev MI (2002) Phylogenetic diversity of winter bacterioplankton of eutrophic Siberian reservoirs as revealed by 16S rRNA gene sequence. Microb Ecol 44: 252–259 Urbach E, Vergin KL, Young L, Morse A (2001) Unusual bacterioplankton community structure in ultra-oligotrophic Crater Lake. Limnol Oceanogr 46:557–572 Van der Gucht K, Sabbe K, De Meester L, Vloemans N, Zwart G, Gillis M, Vyverman W (2001) Contrasting bacterioplankton community composition and seasonal dynamics in two neighbouring hypertrophic freshwater lakes. Environ Microbiol 3:680–690 van Hannen EJ, Mooij W, van Agterveld MP, Gons HJ, Laanbroek HJ (1999a) Detritus-dependent development of the microbial community in an experimental system: qualitative analysis by denaturing gradient gel electrophoresis. Appl Environ Microbiol 65:2478–2484 van Hannen EJ, Zwart G, van Agterveld MP, Gons HJ, Ebert J, Laanbroek HJ (1999b) Changes in bacterial and eukaryotic community structure after mass lysis of filamentous cyanobacteria associated with viruses. Appl Environ Microbiol 65:795–801 Wang L, Priscu JC (1994) Stimulation of aquatic bacterial activity by cyanobacteria. Hydrobiologia 277:145–158 Winter C, Moeseneder MM, Herndl GJ (2001) Impact of UV radiation on bacterioplankton community composition. Appl Environ Microbiol 67:665–672 Wintzingerode F, Göbel UB, Stackebrandt E (1997) Determination of microbial diversity in environmental samples: pitfalls of PCR-based rRNA analysis. FEMS Microbiol Rev 21:213–229 Worden AZ, Binder BJ (2003) Growth regulation of rRNA content in Prochlorococcus and Synechococcus (marine cyanobacteria) measured by whole-cell hybridization of rRNA-targeted peptide nucleic acids. J Phycol 39: 527–534 Zwart G, Huismans R, van Agterveld MP, Van de Peer Y and 6 others (1998) Divergent members of the bacterial division Verrucomicrobiales in a temperate freshwater lake. FEMS Microbol Ecol 25:159–169 Zwart G, Crump BC, Kamst-van Agterveld MP, Hagen F, Han S (2002) Typical freshwater bacteria: an analysis of available 16S rRNA gene sequences from plankton of lakes and rivers. Aquat Microb Ecol 28:141–155
Editorial responsibility: David Caron, Los Angeles, California, USA
Submitted: January 28, 2004; Accepted: May 28, 2004 Proofs received from author(s): September 2, 2004