proposed as the barcode source to identify and delimit all animal species (CBOL, Consortium for the Barcode of. Life, available at http://www.barcoding.si.edu/ ...
Available online at www.pelagiaresearchlibrary.com
Pelagia Research Library European Journal of Experimental Biology, 2012, 2 (6):2158-2165
ISSN: 2248 –9215 CODEN (USA): EJEBAU
DNA Barcoding of selected dragonfly species (Libellulidae and Aeshnidae) for species authentication with phylogenetic assessment Pushparaj Karthika1, *Chitravel Vadivalagan1, Chinnapan Gunasekaran1, Shanmugam Anandhakumar2 1
Conservation Biology Laboratory, Department of Zoology, Bharathiar University, Coimbatore 2 Computation Biology Laboratory, Department of Bioinformatics, Bharathiar University, Coimbatore
_____________________________________________________________________________________________ ABSTRACT Dragonflies are the bio indicators of the aquatic ecosystem. Knowledge and studies on the diversity of dragonflies in India is very high. Identification by traditional taxonomy often leads to misidentification. Incidence of sexual dimorphism is found to be high particularly in the Libellulidae and Aeshnidae family. In order to resolve the above mentioned problem, the accurate identification of the dragonflies was carried out by DNA barcoding using COI gene. In the present study, selected dragonfly species (Bradinopyga geminata, Crocothemis servilia, Diplacodes trivialis and Anaciaeschna jaspidea) of the family of Libellulidae and Aeshnidae were taken and along with three other evident species (Pantala flavescens, Orthetrum sabina, and Brachythemis contaminata) were retrieved from GenBank. The phylogenetic tree was created using NJ (Neighbour Joining) method to determine the origin and evolutionary relationships of the species. Similarity search was performed and conformed species were submitted to the NCBI and BOLD database for species authentication. The present study concluded that the DNA barcoding is an invaluable tool for the authentication of the species. Storage of this nucleotide information in a database like BOLD would greatly help in the identification up to sub species level. Keywords: Molecular identification, Dragonflies, DNA barcoding, phylogeny _____________________________________________________________________________________________ INTRODUCTION Taxonomy is a process of organizing and classifying content. As conservation becomes ever more politically important, taxonomic work impacts not only the scientific community, but society as a whole [1]. Current taxonomic system, based on the hierarchy of Linnaean ranks, is said to be unsatisfactory. Many people insist that the very concept of rank should be eliminated, and the current taxonomic system should be replaced with a rankless system based on phylogenetic taxonomy. However according to Vasilyeva and Stephenson [2] it is not the elimination of the concept of rank but rather the correct ranking of characters that will promote stability in taxonomy. The limitations of morphology-based taxonomy are phenotypic plasticity in the characters employed for species recognition lead to incorrect identifications; Morphologically cryptic species are often overlooked; is a lack of taxonomic keys to identify immature specimens of many species; and Traditional taxonomy requires high levels of expertise in any given group and is therefore restricted to specialists [3].
2158 Pelagia Research Library
Chitravel Vadivalagan et al Euro. J. Exp. Bio., 2012, 2 (6):2158-2165 _____________________________________________________________________________ Taxonomy, the science dedicated to discovering, describing, naming, and identifying species and other taxa, has been the subject of many debates [4] that center on the use of revolutionary ideas [5] that can help it overcome the “taxonomic crisis” of the last decades [6]. This crisis is mainly characterized by a lack of specialists in several groups and geographic areas, and by insufficient funding for taxonomic work [7]. As a means to revitalize traditional taxonomy and help it rise above the taxonomic crisis, alternative and complementary approaches have been promoted, for example; molecular taxonomy [3], information technology, the development of investment funds [8] and increased utilization of cyber tools [9]. Among these proposals, DNA barcoding [3] has been particularly successful in the identification and delimitation of new species from various groups [10]. This method has received increased acceptance because it is simple and affordable [11]. DNA barcoding is a taxonomic system structured on sequence information from a short stretch of a core DNA sequence. A region of approximately 648-bp of the mitochondrial gene Cytochrome c Oxidase I (COI) was initially proposed as the barcode source to identify and delimit all animal species (CBOL, Consortium for the Barcode of Life, available at http://www.barcoding.si.edu/ DNABarCoding.htm). The methodology involves the sequencing of that portion of DNA, followed by a comparison with other sequences previously deposited in a database. Species were identified by matching the obtained sequence with sequences of known identity already in the database (BOLD v3 system) [3]. The COI was chosen for animal barcoding because of the following advantageous characteristics: First, as in other mitochondrial protein coding genes, indels (insertions/deletions) are rare, since most lead to a shift in the reading frame (and consequent elimination from the population). Second, universal primers for COI are very robust, enabling the sequencing of representatives of most, of all, animal phyla. Lastly, COI appears to possess a great range of phylogenetic signal, showing fast rates of nucleotide substitution that not only enable the discrimination of cryptic species, but also can reveal phylogeographic structures within a species [3].DNA sequences are unique for each species, they can be viewed as genetic ‘barcodes’ and have the potential to solve the problems inherent to the kind of taxonomy practiced so far. With a possible nucleotide variation of four nitrogenous bases (A, T, C, G) at each site, there are 4n (where “n” corresponds to the number of nucleotides surveyed) possible codes for any given sequence, making it possible to identify every taxon. The survey of just 15 nucleotide positions can identify 1 billion (415) species [3]. The identifications can be performed quickly and at low cost, without the need of a taxonomist in the group. Additional advantages of the method would be the possibility of identifying individuals at any stage of development, and the prospect of discriminating between morphologically identical species. India is known for its rich biodiversity of both flora and fauna therefore integration of molecular techniques, such as DNA barcoding, with traditional taxonomy has been suggested to be a tool to characterize such a huge biodiversity at regional scales [12]. Taxonomy is the identification of species based on the morphological characters and since it requires vast knowledge about the varied organisms and their characters, the taxonomists are very few worldwide. In many cases, the identification using traditional taxonomy is difficult due to the external changes in the organisms caused by seasonal and geographical variations, whereas in the case of insects, sexual dimorphism and mimicry often leads to the misidentification of the original species. The incidence of sexual dimorphism is high in insects and aquatic organisms. Many organisms alter themselves physiologically and morphologically due to the unfavourable conditions in the environment .Generally, these variations accumulate in the species and bring about a drastic change in the outlook or appearance of the animals .The most common phenomenon exhibited by the insects is to act as a mimic to the model organisms, whereby it is facilitated by anti-predatory effects and habitats survival. On the basis of the above mentioned difficulties, by adopting manual taxonomy, misidentification of the species may arise. This problem has thus influenced the emergence of the molecular taxonomic frame work studies for the conformation and the betterment in the identification of species. In India studies on the molecular level identification of dragonflies is very less and no literature is available in the public databases like BOLD although only considerable number of sequence information of dragonflies are available in NCBI . In relevance to the problem of the study stated above, we have surveyed the Order Odonata for the taxonomical identification, and taken over this study as DNA Barcoding of dragonflies to overcome the problem of sexual dimorphism which is highly exhibited in the case of Dragonflies. Therefore for addressing this problem and to serve as a point of initiation for the identification of the dragonflies by DNA barcoding the present study was framed to carry out DNA Barcoding using the mitochondrial gene Cytochrome C Oxidase (CO1) for the accurate species identification and confirm the dragonfly species by analyzing the DNA sequence information in GenBank and BOLD v3 System Molecular phylogeny for the selected Dragonflies was carried out using CO1 gene.
2159 Pelagia Research Library
Chitravel Vadivalagan et al Euro. J. Exp. Bio., 2012, 2 (6):2158-2165 _____________________________________________________________________________ MATERIALS AND METHODS Sample Collection and Preservation A total of 59 individuals belonging to 4 species of dragonflies were collected from the study area with the geographical extent of 11°00’N-77°00’E (four wetlands) of Coimbatore region during December 2011 –May 2012. Dragonflies were collected by hand sweep netting and random field sampling method was used to cover entire study area, the insects were pinned and photo documented by using Cannon power shot SX30 IS camera. Identification was done by observing wing venation, colour pattern and genetalia, described in available keys/identification guides by [13] and [14]. Additional information regarding date of collection, locality, etc., about each specimen was also recorded. Each specimen was then placed in a separate collecting bottle, assigned a code number and stored in 99.5 % ethanol until further use. One or more legs were removed for DNA isolation and kept in ethanol until further use. DNA extraction, amplification and sequencing DNA from the tissues of the selected dragonflies (Bradinopyga geminata, Crocothemis servilia, Diplacodes trivialis and Anaciaeschna jaspidea) was extracted from leg using DNeasy kit (Qiagen), according to the manufacturer’s instructions. The obtained DNA was confirmed using 1% Agarose gel. Then the DNA was amplified using Polymerase Chain Reaction (PCR) using AB1 thermo cycler. Following primers were used for amplification of COI gene: OdoF1_t15’TGTAAAACGACGGCCAGTATTCAACHAATCATAARGATATTGG3’and OdoR1_t15’CAGGAAACAGCTATGACTAAACTTCTGGATGYCCRAARAAYCA3’. Amplification was performed in a total volume of 50µl containing 4µl of DNA template, 20 pmol of each primers 400µm of DNTP and 0.4µl of Taq DNA polymerase (Qiagen). The thermo cycler conditions were slightly modified from [15] and are as follows; 1 initial cycle of 1 minute at 94°C followed by 5 cycles of 94°C for 1 minute, 45°C for 1minute 30 seconds, 72°C for 1minute 15 seconds, then 30 cycles of 94°C for 1minute, 51°C for 1minute 30 cycles, 72°C for 5 minutes. The obtained PCR product was checked using 2 % Agarose gel electrophoresis and were sequenced with both, the forward and reverse, primers using an automated sequencer Big Dye Terminator version 3.1” Cycle sequencing kit with Machine Run software: 3500xL Genetic Analyzer Data Collection software v1.0 and Data Analysis Software : Sequencing Analysis v 5.4. Data Analysis Mitochondrial COI sequence data for Pantala flavescens, Orthetrum sabina, and Brachythemis contaminata were obtained from GenBank (AB709105.1, AB709093.1 and AB708949.1respectively). The sequences of the four species from which the DNA was extracted and sequenced were submitted in GenBank and the accession numbers were obtained (JX306648.1, JX308218.1, JX306649.1 and JX306647.1). The sequences were also submitted in BOLD System database and the BIN were provided for the following species (Diplacodes trivialis- BOLD: AAH6874, Bradinopyga geminata – BOLD: ABY3063 and Anaciaeschna jaspidea- BOLD: ABX8023).These sequences were edited using basic BLAST tool with CDS analysis. The aligned sequences were used for species identification using BLAST search at NCBI and species identification tool at BOLD. The sequences from GenBank were retrieved and sequences of each species generated from this study were compared and aligned using the CLUSTALW program. Reference of accession numbers (GenBank) for voucher species which were used to construct multiple sequence alignment are listed in Table 1. Table 1 Details of the name and nucleotide sequences of different species of Dragonflies along with the gene of focus S. No 1. 2. 3. 4. 5. 6. 7.
Name of the species Bradinopyga geminata Orthetrum sabina Crocothemis servilia Brachythemis contaminata Pantala flavescens Diplacodes trivialis Anaciaeschna jaspidea
Common name Family Gene of focus Granite Ghost Libellulidae COI Green Marsh Hawk Libellulidae COI Ruddy marsh skimmer Libellulidae COI Ditch jewel Libellulidae COI Common wandering glider Libellulidae COI Ground skimmer Libellulidae COI Rusty darner Aeshnidae CO1 *Sequences retrieved from GenBank
GenBank accession number JX306648 AB709093.1* JX308218 AB708949.1* AB709105.1* JX306647 JX306649
Species identification based on the sequence similarity approach was carried out using GenBank database. The highest percent pair wise identity of the consensus sequence from each species blasted (BLASTN) against NCBI were noted. The evolutionary history was inferred using the Neighbour-Joining method [16]; the phylogenetic tree
2160 Pelagia Research Library
Chitravel Vadivalagan et al Euro. J. Exp. Bio., 2012, 2 (6):2158-2165 _____________________________________________________________________________ was constructed by using Neighbour -joining method with the test of Phylogeny by bootstrap method with no. of bootstrap replications of 500. The evolutionary distances were computed using the Jukes-Cantor method [17] and are in the units of the number of base substitutions per site. RESULTS The mitochondrial Cytochrome Oxidase I (COI) region of all samples was successfully amplified using PCR. The databases revealed definitive identity matches in the range of 86%–100% for the sequences of four species (Diplacodes trivialis, Crocothemis servilia, Bradinopyga geminata and Anaciaeschna jaspidea). GenBank-based identification for three species (Diplacodes trivialis, Bradinopyga geminata and Anaciaeschna jaspidea) yielded an alignment E-value of 0.0 except Crocothemis servilia. The GenBank results showed maximum identity of 100% for Diplacodes trivialis, 98 % for Bradinopygea geminata, and 87 % for Anaciaeschna jaspidea. However the top hit of 100% using the BLAST was observed for Diplacodes trivialis. Table 2 Dragonfly species used in this study Species name
Common name
Sample size
Bradinopyga geminata Diplacodes trivialis Crocothemis servilia Anaciaeschna jaspidea Orthetrum Sabina Brachythemis contaminata Pantala flavescens
Granite Ghost Ground skimmer Ruddy marsh skimmer Rusty darner Green Marsh Hawk Ditch jewel Common wandering glider
651bp 677bp 562bp 622bp 451bp 688bp 615bp
Similarity within Species (%) 98 100 86 87 100 100 100
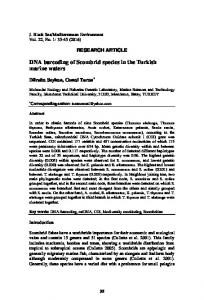
The evolutionary history was inferred using the Neighbor-Joining (NJ) method [16] Fig 1. The optimal tree with the sum of branch length = 0.58209610 is shown. (next to the branches). The evolutionary distances were computed using the Jukes-Cantor method [Jukes and Cantor, 1969] and are in the units of the number of base substitutions per site. The analysis involved 7 nucleotide sequences. Codon positions included were 1st+2nd+3rd+Noncoding. All positions containing gaps and missing data were eliminated. There were a total of 446 positions in the final dataset. Evolutionary analyses were conducted in MEGA5 [Tamura et al., 2011]. Fig 1 Evolutionary relationships of the selected dragonfly species using NJ method
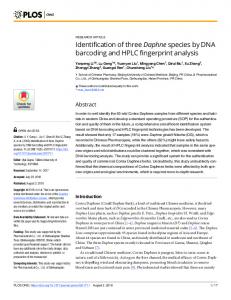
The evolutionary history was inferred by using the Maximum Likelihood (ML) method based on the Jukes-Cantor model [17]. The tree with the highest log likelihood (-1853.2384) is shown in Fig 2. Initial tree(s) for the heuristic search were obtained automatically as follows. When the number of common sites was < 100 or less than one fourth of the total number of sites, the maximum parsimony method was used; otherwise BIONJ method with MCL distance matrix was used. The analysis involved 7 nucleotide sequences. Codon positions included were 1st+2nd+3rd+Noncoding. All positions containing gaps and missing data were eliminated. There were a total of 446 positions in the final dataset. Evolutionary analyses were conducted in MEGA5 [18].
2161 Pelagia Research Library
Chitravel Vadivalagan et al Euro. J. Exp. Bio., 2012, 2 (6):2158-2165 _____________________________________________________________________________ Fig 2 Evolutionary relationships of the selected dragonfly species using ML method
The numbers of base substitutions per site from between sequences are shown. Analyses were conducted using the Jukes-Cantor model [17]. The analysis involved 7 nucleotide sequences. Codon positions included were 1st+2nd+3rd+Noncoding. All positions containing gaps and missing data were eliminated. There were a total of 446 positions in the final dataset Table 3. Evolutionary analyses were conducted in MEGA5 [18]. Table 3 Estimates of Evolutionary Divergence between Sequences Anaciaeschna_jaspidea Pantala_flavescens Diplacodes_trivialis Brachythemis_contaminata Crocothemis_servilia Orthetrum_sabina Bradinopyga_geminata
0.193 0.170 0.179 0.217 0.182 0.159
0.217 0.199 0.217 0.185 0.214
0.193 0.251 0.214 0.170
0.235 0.199 0.190
0.032 0.188
0.157
Each entry is the probability of substitution (r) from one base (row) to another base (column). Substitution pattern and rates were estimated under the Jukes-Cantor (1969) model [17]. Rates of different transitional substitutions are shown in bold and those of transversionsal substitutions are shown in italics. Relative values of instantaneous r should be considered when evaluating them. For simplicity, sum of r values is made equal to 100, The nucleotide frequencies are A = 25.00%, T/U = 25.00%, C = 25.00%, and G = 25.00%. For estimating ML values, a userspecified toplogy was used. The maximum Log likelihood for this computation was -1853.238. The analysis involved 7 nucleotide sequences. Codon positions included were 1st+2nd+3rd+Noncoding. All positions containing gaps and missing data were eliminated. There were a total of 446 positions in the final dataset Table 4. Evolutionary analyses were conducted in MEGA5 [18] Table 4 Maximum Likelihood Estimate of Substitution Matrix
A T/U C G
A 8.33 8.33 8.33
T/U 8.33 8.33 8.33
C 8.33 8.33 8.33
G 8.33 8.33 8.33 -
The probability of rejecting the null hypothesis that sequences have evolved with the same pattern of substitution, as judged from the extent of differences in base composition biases between sequences (Disparity Index test). A Monte Carlo test (500 replicates) was used to estimate the P-values [19], which are shown below the diagonal. P-values smaller than 0.05 are considered significant Table 5 The estimates of the disparity index per site are shown for each sequence pair above the diagonal. The analysis involved 7 nucleotide sequences. Codon positions included were 1st+2nd+3rd+Noncoding. All positions containing gaps and missing data were eliminated. There were a total of 446 positions in the final dataset. Evolutionary analyses were conducted in MEGA5 [18].
2162 Pelagia Research Library
Chitravel Vadivalagan et al Euro. J. Exp. Bio., 2012, 2 (6):2158-2165 _____________________________________________________________________________ Table 5 Test of the Homogeneity of Substitution Patterns between Sequences Anaciaeschna_jaspidea Pantala_flavescens Diplacodes_trivialis Brachythemis_contaminata Crocothemis_servilia Orthetrum_sabina Bradinopyga_geminata
0.818 0.000 1.000 0.108 1.000 1.000 0.048
0.020 0.000 0.004 0.014 0.222
0.000 0.424 0.246 1.000 1.000 0.046
0.175 1.339 0.054 0.122 0.248 0.000
0.000 0.536 0.000 0.177 0.172 0.172
0.000 0.448 0.000 0.078 0.025
0.253 0.105 0.267 1.018 0.101 0.211
0.056
The probability of rejecting the null hypothesis of strict-neutrality (dN = dS) (below diagonal) is shown. Values of P less than 0.05 are considered significant at the 5% level and are highlighted. The test statistic (dN - dS) is shown above the diagonal. dS and dN are the numbers of synonymous and nonsynonymous substitutions per site, respectively. The variance of the difference was computed using the bootstrap method (500 replicates). Analyses were conducted using the Nei-Gojobori method [20]. The analysis involved 7 nucleotide sequences. All positions containing gaps and missing data were eliminated. There were a total of 144 positions in the final dataset Table 6. Evolutionary analyses were conducted in MEGA5 [18]. Table 6 Codon-based Test of Neutrality for analysis between sequences Anaciaeschna_jaspidea Pantala_flavescens Diplacodes_trivialis Brachythemis_contaminata Crocothemis_servilia Orthetrum_sabina Bradinopyga_geminata
-9.741 0.000 0.000 0.000 0.000 0.000 0.000
0.000 0.000 0.000 0.000 0.000
-9.655 -12.369 0.000 0.000 0.000 0.000
-8.584 -9.166 -9.584 0.000 0.000 0.000
-8.703 -9.066 -10.266 -7.814 0.572 0.000
-9.074 -9.324 -10.355 -8.050 0.567
-8.990 -11.447 -9.927 -8.900 -7.946 -8.330
0.000
DISCUSSION Isolation, PCR amplification and sequencing of DNA from leg of dragonflies yielded good quality sequences. BLAST search on NCBI identified almost all the sequences and species identification tool available on BOLD website (www.barcodinglife.com) correctly identified one species (Diplacodes trivialis) with maximum similarity. The morphological identification was hand in hand with the identification of the species through DNA barcoding, from this it is evident that DNA barcoding can be successfully used as an identification tool for the unknown species. Though there was not exact match for the particular species Anaciaeschna jaspidea while performing BLAST search in NCBI ,it finely had the maximum identity of 87% and e- value was found to be 0, which itself proves the similarity between the species studied and the species identified. Moreover, in our study only Anaciaeschna jaspidea belongs to the family Aeshnidae while rest of the dragonfly species belongs to the family Libellulidae. Our study also supports with the proposal of [21] that NJ method and similarity methods (BLAST and species identification tool at BOLD website) are a good choice for DNA barcoding analysis. In the results of multiple sequence alignment, since all the selected species belong to single genera (Anisoptera) there is high amount of identical amino acid residues in the Clustal W results. In addition to it, the species selected for the multiple sequence analysis belong to two families (i.e.) Libellulidae and Aeshnidae which are closely related; therefore this is also a prime reason for the high incidence in number of the identical amino acid residues. Over the past 45 yr, there have been many studies attempting to resolve the relationships within the Odonata [13; 22; 23] based on morphological characters. Although the many morphological studies have attempted to use different characters to resolve the relationships of the odonates based on wing venation and morphology of the fight apparatus and copulatory structures [24], none have been able to come to robust conclusions. Pfau based his phylogenetic analysis on a detailed morphological investigation of secondary sexual organs and concluded that Petaluridae, Gomphidae and Cordulegastridae constitute a monophyletic sister group to the remaining Libellulidae. In our study, the selected dragonfly species belong to the same family (Libellulidae) except one (Anaciaeschna jaspidea of Aeshnidae family), there was close congruence among the species, exceptionally, Anaciaeschna jaspidea evolved from a separate clade, rest all the species (Brachythemis contaminata, Pantala flavescens, Crocothemis servilia, Bradinopyga geminata, Diplacodes trivialis and Orthetrum sabina) belongs to Libellulidae. Brachythemis contaminata and Orthetrum sabina evolved together from a single clade, similarly Pantala flavescens, Crocothemis servilia and Bradinopyga geminata, Diplacodes trivialis had evolved as pairs in different clades. The
2163 Pelagia Research Library
Chitravel Vadivalagan et al Euro. J. Exp. Bio., 2012, 2 (6):2158-2165 _____________________________________________________________________________ divergence among the species is limited that the DNA sequences showed high similarity, since they belong to the same family. According to [25] DNA barcoding is one of the most promising approaches that uses molecular instead of morphological data for identifying taxa .Traditionally, identification has been based on morphological diagnoses provided by taxonomic studies. There is high level of sexual dimorphism in Anisoptera that is there are large phenotypic variations among the male and female individuals of the same species, which can be misidentified as another individual of different species [26]. From the present study it is clearly seen that the three members of Libellulidae family show wide differences among the male and female individuals of the same species and perhaps lead to misidentification. Therefore in this study the molecular level identification by using the DNA sequence data of these species has lead to absolute identification of the actual species. From our study all the four the species Crocothemis servilia, Brachythemis contaminata, Diplacodes trivialis and Anaciaeschna jaspidea exhibit high percentage of sexual dimorphism and it is well supported by the studies of [26] which stated that all Anisoptera show sexual dimorphism in body weight, females are heavier and stouter than males as it is often the case in insects. Sexual dimorphism in body coloration can be found in Aeshnids, Gomphids and Libellulids. According to [27] mapping sexual dimorphism in wing and body coloration on a consensus tree of morphological and molecular results implies that both features are independently derived within several families of Anisoptera. The most astounding instances of sexual dimorphism are found in the extremely heterogeneous Libellulidae and resolving the problem of misidentification of them through the molecular basis is more evident from our studies. CONCLUSION In conclusion, from the results of our present study, based on the identification of the dragonfly species from the nucleotide sequences, it is evident that, DNA barcoding is emerging as an invaluable tool the authentication of the species. In spite of the confusions in the identification the dragonflies, where the incidence of sexual dimorphism high, we can confirm the exact species by utilizing the DNA barcoding technique for the dragonfly species, which serve as the flagship insects communities of wetland ecosystems. Dragonfly species are not authenticated by molecular identification from India so far, the present work has been the first and initiative for the identification of these particular taxa, which can be valuable information in the cryptic species discovery and also to analyse the relationship among the dragonflies even up to sub species level. Moreover, this study can aid in the identification of the dragonfly communities in the teneral and larval stages where traditional taxonomy needs the support of the DNA barcoding to reveal the accurate identification. Acknowledgement The authors are grateful to the Head of the Department of Zoology for providing lab facilities during the study; to Bharathiar University for providing institutional support and authentication and also to University Grants Commission, Government of India for financial support. REFERENCES [1] Knapp S What's in a name? A history of taxonomy2010. http://www.nhm.ac.uk/nature-online/science-ofnatural-history/taxonomy-systematics/history-taxonomy/index.html [2] Vasilyeva LN and Stephenson SL, Mycosphere, 2011, 1, 45 – 51. [3] Hebert PDN, Ratnasingham S, deWaard JR, Proceedings of the Royal Society B Biological Sciences, 2003, 270: 96–99. [4] Carvalho MR, Bockmann FA , Amorim DR, Brandão CR. Evol. Biol., 2008, 35:150-157 [5] Godfray HCG , Nature, 2002 417:17-18. [6] Wilson KH , Clin. Infect. Dis. 1995, 20(Suppl.) 192–208. [7] Mallet J and Willmott K, Trends Ecol. Evol , 2009,18:57-59. [8] Wheeler QD, Zootaxa, 2007, 1668:11-18. [9] La sale J, Wheeler Q , Jackway P, Winterton S, Hobern D and Lovell D, Zootaxa, 2009 ,2217:43-55. [10] Kerr KCR, Lijtmaer DA, Barreira AS, Hebert PDN and Tubaro PL, Probing evolutionary patterns in Neotropical birds through DNA barcodes. PLoS ONE 4(2): e4379. doi:10.1371/journal.pone.0004379. [11] Padial JM and De la riva I, Zootaxa, 2007, 1586:67-68
2164 Pelagia Research Library
Chitravel Vadivalagan et al Euro. J. Exp. Bio., 2012, 2 (6):2158-2165 _____________________________________________________________________________ [12] David Bickford , David J. Lohman , Navjot S. Sodhi ,.Peter KL, Rudolf Meier, Kevin Winker, Krista K. Ingram, Indraneil Das , Trends Ecol Evol., 2006, 22(3):148–155 [13] Fraser FC , A reclassification of the order Odonata, 1957, Publ. R. Zool. Soc. N.S.W. Sydney [14] Subramanian KA , Dragonflies and Damselflies of Peninsular India: A Field Guide. Project Lifescape, 2005, Indian Academy of Science, Bangalore, India, 118. [15] Gaikwad SS , Ghate HV , Ghaskadbi SS, Patole MS , Shouche YS, Mol Biol Rep, 2011,. doi 10.1007/s11033011-0988-7. [16] Saitou N and Nei M. J.Molecular Biology and Evolution, 1987, 4:406-425. [17] Jukes TH and Cantor CR, Evolution of protein molecules. In Munro HN, editor, Mammalian Protein Metabolism, Academic Press, New York, 1969, 21-132. [18] Tamura K, Peterson D , Peterson N ,Stecher G , Nei M , and KumaR, J. Molecular Biology and Evolution, 2011. [19] Kumar S and Gadagkar SR, Genetics, 2001, 158:1321-1327. [20] Nei M and Gojobori T . Molecular Biology and Evolution, 1986, 3:418-426 [21] Marianne Elias, Ryan I. Hill, Keith R. Willmott, Kanchon K. Dasmahapatra, Andrew V. Z. Brower, James Mallet and Chris D. Jiggin. Proc R Soc Lond B Biol Sci, 2007, 274:2881–2889 [22] Trueman JWH, Odonatologica 1996, 25 (1): 59–72. [23] Bechley G. The phylogenetic systematics of Odonata, 2002. (http://www.bechly.de/phylosys.htm). [24] Pfau HK, Adv. Odonatol, 1991, 5: 109–141 [25] Blaxter M, Nature, 2003, 421: 122–124 [26] Corbet PS ,Dragonflies: Behavior and Ecology of Odonata ,1999 ,Cornell University Press, Ithaca, New York [27] Tillyard RJ, The Biology of Dragonflies (Odonata or Paraneuroptera), 1935, Cambridge University Press. Cambridge.
2165 Pelagia Research Library