Research article
DNA damage induced by chronic inflammation contributes to colon carcinogenesis in mice Lisiane B. Meira,1 James M. Bugni,1 Stephanie L. Green,1 Chung-Wei Lee,1,2 Bo Pang,1 Diana Borenshtein,1,2 Barry H. Rickman,1,2 Arlin B. Rogers,1,2 Catherine A. Moroski-Erkul,1 Jose L. McFaline,1 David B. Schauer,1,2 Peter C. Dedon,1 James G. Fox,1,2 and Leona D. Samson1 1Department
of Biological Engineering and Center for Environmental Health Sciences and 2Division of Comparative Medicine, Massachusetts Institute of Technology, Cambridge, Massachusetts, USA.
Chronic inflammation increases cancer risk. While it is clear that cell signaling elicited by inflammatory cytokines promotes tumor development, the impact of DNA damage production resulting from inflammation-associated reactive oxygen and nitrogen species (RONS) on tumor development has not been directly tested. RONS induce DNA damage that can be recognized by alkyladenine DNA glycosylase (Aag) to initiate base excision repair. Using a mouse model of episodic inflammatory bowel disease by repeated administration of dextran sulfate sodium in the drinking water, we show that Aag-mediated DNA repair prevents colonic epithelial damage and reduces the severity of dextran sulfate sodium–induced colon tumorigenesis. Importantly, DNA base lesions expected to be induced by RONS and recognized by Aag accumulated to higher levels in Aag-deficient animals following stimulation of colonic inflammation. Finally, as a test of the generality of this effect we show that Aag-deficient animals display more severe gastric lesions that are precursors of gastric cancer after chronic infection with Helicobacter pylori. These data demonstrate that the repair of DNA lesions formed by RONS during chronic inflammation is important for protection against colon carcinogenesis. Introduction Chronic inflammation has emerged as an important risk factor for cancer. One of the best examples of the association between chronic inflammation and cancer is found in the heightened predisposition for cancer of patients suffering from ulcerative colitis (UC) and Crohn disease of the colon, the major forms of idiopathic inflammatory bowel disease. Colorectal cancer (CRC) risk correlates with extent and duration of disease (1). Extensive UC leads to a 19-fold increase in risk for colon cancer, and about 5% of UC patients develop tumors (2). Cancer risk is likely due to chronic inflammation of the gastrointestinal mucosa (3); current UC therapies target inflammation to alleviate symptoms, and approximately 30% of cancerfree patients have their colons removed to prevent cancer. Another major disease linked to chronic inflammation is gastric cancer, the second leading cause of cancer death worldwide (4). In this case, the predisposing inflammation is most often caused by colonization of the gastric epithelium by Helicobacter pylori, and chronically infected individuals have an increased risk of developing gastric cancer (5). While it is clear that inflammatory cytokines contribute to inflammation-associated cancer susceptibility (6, 7), the possible, and likely, contribution of the DNA damage that accompanies chronic inflammation has not been tested. In the 2-stage carcinogenesis model, cancer development begins when somatic cells incur irreversible DNA sequence alterations (initiation stage). Subsequently, continuous or repeated stimuli Nonstandard abbreviations used: 8oxoG, 7,8-dihydro-8-oxoguanine; Aag, alkyladenine DNA glycosylase; ACF, aberrant crypt foci; AOM, azoxymethane; BER, base excision repair; CRC, colorectal cancer; DSS, dextran sulfate sodium; ε-, etheno-; εA, 1,N6-ethenoadenine; εC, 3,N4-ethenocytosine; Hx, hypoxanthine; RONS, reactive oxygen and nitrogen species; UC, ulcerative colitis. Conflict of interest: The authors have declared that no conflict of interest exists. Citation for this article: J. Clin. Invest. 118:2516–2525 (2008). doi:10.1172/JCI35073. 2516
lead to a sustained induction of cellular proliferation, bringing about changes in the cellular microenvironment that favor tumor formation (promotion stage). While the cancer initiation stage is better defined (e.g., mutation of oncogenes, tumor suppressor genes, and other key regulators of cell proliferation), the promotion stage, in which many cell types interact via secreted factors, is more complex. Chronic inflammation is an important tumor promoter (6, 8). An acute inflammatory response begins when neutrophils infiltrate sites of injury by responding to chemical cues elicited by proinflammatory cytokines and chemokines. Subsequent resolution or healing is associated with release of antiinflammatory cytokines. In contrast, chronic inflammation is a response to persistent injury and/or infection and involves lymphocytes, plasma cells, macrophages, and neutrophils. In addition to eliciting a variety of cellular signals, inflammation generates mutagenic compounds. The reactive oxygen and nitrogen species (RONS) produced by neutrophils and macrophages (6) can directly induce DNA base oxidation and deamination and can indirectly lead to base alkylation via lipid peroxidation (LPO). Etheno-modified (ε-modified) bases are generated by reactions of DNA with a major LPO product (trans-4-hydroxy-2-nonenal). LPO is increased in rectal biopsy samples from patients with active UC, consistent with findings regarding RONS-induced lipid damage (9). Indeed, increased levels of 1,N6-ethenoadenine (εA), 1,N2ethenoguanine (εG), and 3,N4-ethenocytosine (εC) are found in the DNA of affected tissues (10). Furthermore, an oxidized base lesion, 7,8-dihydro-8-oxoguanine (8oxoG) is found increased in the inflamed colonic mucosae of rats and in the inflamed gastric mucosae of H. pylori–infected people (11, 12). All above-mentioned RONS-associated base damage can be repaired by the base excision repair (BER) pathway, initiated by one of many damage-specific glycosylases that cleave the glyco-
The Journal of Clinical Investigation http://www.jci.org Volume 118 Number 7 July 2008
research article
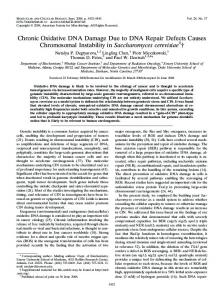
Figure 1 Increased tumor multiplicity in Aag–/– versus Aag+/+ animals treated with AOM and DSS. (A) Treatment scheme. White blocks represent 16 days of normal water except the last which is 7 days. Black blocks represent 5 days of 2.5% DSS in water except for the last, which was 4 days of 2% DSS. Mice were also treated with only AOM or only DSS. (B) Tumor multiplicity in Aag+/+ animals (white), and Aag–/– animals (black). AOM+DSS Aag+/+, n = 12; AOM+DSS Aag–/–, n = 23; AOM Aag+/+, n = 15; AOM Aag–/–, n = 19; DSS Aag+/+, n = 10; and DSS Aag–/–, n = 10. Data are mean ± SD. (C) Pathology scores for Aag+/+ (circles) and Aag–/– (diamonds) mice. See Supplemental Methods for a complete description of scoring criteria. Lines indicate the median. (D) Photomicrographs depicting, from left to right, normal untreated Aag+/+ colon; AOM+DSS-treated Aag+/+ colon bearing a lesion with an average dysplasia score, a sessile adenoma; normal untreated Aag–/– colon; and AOM+DSS-treated Aag–/– colon bearing a lesion with an average dysplasia score and a higher scoring pedunculated adenoma. Scale bars: 200 μm.
sylic bond between the damaged base and the sugar phosphate backbone (13). A link between BER deficiency and CRC is seen in attenuated familial adenomatous polyposis syndrome, in which inactivating recessive mutations in the MYH glycosylase (the glycosylase that removes the adenine opposite 8oxoG) sensitize to cancer development (reviewed in ref. 14). Myh-deficient mice are more susceptible to spontaneous tumors either alone (15, 16) or in combination with 8-oxoguanine DNA glycosylase 1 (Ogg1) deficiency (17). Myh-deficient mice were also found to be susceptible to oxidative stress–induced intestinal tumors (15). Additionally, Ogg1 knockout mice were reported to be more susceptible to spontaneous lung tumorigenesis (18). Most importantly however, the role of inflammation in affecting tumor susceptibility in mice deficient in any of the above-mentioned glycosylases has not yet been investigated. Alkyladenine DNA glycosylase (Aag) has a broad substrate specificity (13). Base lesions formed by RONS that can be removed by Aag include hypoxanthine (Hx) (caused by deamination of adenine), εA, and εG. Furthermore, the major oxidized base lesion 8oxoG can be removed by Aag, albeit inefficiently, and the mouse
enzyme has greater activity than the human enzyme toward this adduct (19). Not only does Aag excise DNA base lesions induced by RONS, AAG levels increase in inflamed regions of the colon epithelium in UC patients, suggesting that AAG expression adapts in response to increased DNA damage in inflamed tissues (20). Here we tested whether RONS-induced DNA damage contributes to tumor development in a common mouse model of chronic inflammation. We stimulated episodic colitis in WT and Aag–/– mice by administering repeated cycles of dextran sulfate sodium (DSS) to induce chronic colonic inflammation that is morphologically similar to human UC (21, 22). DSS does not directly damage DNA. However, repeated DSS cycles mimic episodic inflammation in UC and induce colon adenomas and adenocarcinomas in WT mice in a variety of strain backgrounds (21, 23). Our results demonstrate that, in mice, Aag is an important suppressor of colon cancer in response to chronic inflammation, thus providing robust evidence that repair of RONS-associated DNA lesions is important for the suppression of inflammation-induced tumorigenesis. As a test of the generality of this effect, we also demonstrate that Aag
The Journal of Clinical Investigation http://www.jci.org Volume 118 Number 7 July 2008
2517
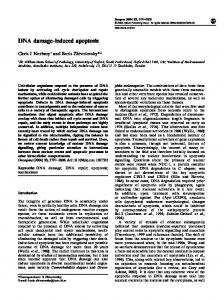
research article Figure 2 Aag–/– animals are more susceptible than Aag+/+ animals to DSS-induced colitis. (A) Change in colon length. (B) Spleen weight as a percentage of body weight. AOM+DSS Aag+/+, n = 14; AOM+DSS Aag–/–, n = 31; AOM Aag+/+, n = 15; AOM Aag–/–, n = 19; DSS Aag+/+, n = 10; DSS Aag–/–, n = 10. Data are mean ± SD. (C) Histopathology scores for severity of inflammation, epithelial defects, and crypt atrophy. A description of the histopathological endpoints for inflammation examined can be found in Supplemental Methods. Epithelial defect scores were based on increased gland dilation and surface epithelial attenuation. (D) Photomicrographs showing a DSS-treated Aag+/+ colon bearing a lesion with an average epithelial defect score (left) and a DSS-treated Aag–/– colon bearing a lesion with an average epithelial defect score (right). Scale bars: 100 μm.
attenuates the development of gastric cancer precursors induced by H. pylori infection. Results Tumorigenesis induced by azoxymethane initiation and DSS promotion. It has been proposed that chronic inflammation enhances tumorigenesis via the induction of DNA damage by RONS (24). To test this hypothesis, we examined whether Aag-dependent DNA repair influences chronic inflammation–dependent tumorigenesis. We induced chronic colonic inflammation in Aag+/+ and Aag–/– mice by feeding repeated cycles of DSS. DSS cycles were preceded (or not) by a single injection of the colonic carcinogen azoxymethane (AOM). C57BL/6J mice are relatively refractory to spontaneous tumors of epithelial origin (25), and it was previously shown that a 70%–90% colon tumor incidence in C57BL/6J mice requires 12 cycles of DSS (23). We therefore chose a colon carcinogenesis protocol wherein an initial exposure to AOM is followed by fewer cycles of DSS (modified from refs. 1, 7). The treatment scheme is illustrated in Figure 1A. Figure 1B shows the analysis of tumor multiplicity in Aag+/+ and Aag–/– animals treated with AOM and DSS, either alone or in combination. For AOM+DSS there was a 3.0-fold increase (P < 0.0001) in tumor multiplicity in Aag–/– animals with 22 ± 8.2 tumors per mouse; Aag+/+ animals had only 7.7 ± 6.7 tumors per mouse. AOM+DSS-treated Aag–/– animals also scored higher for severity of dysplasia and for the magnitude of the area affected (Figure 1C). All tumors were located in the mid- to distal colon, and included sessile and pedunculated adenomas with high-grade dysplasia and 2518
a moderate inflammatory component but no invasion of the muscularis mucosae (Figure 1D). Treatment with a single dose of AOM did not lead to tumor development in either Aag–/– or Aag+/+ mice (Figure 1B). Treatment with 5 cycles of DSS alone led to a similar result for Aag–/– and Aag+/+ animals in terms of tumor multiplicity. For Aag–/– animals, the multiplicity was 0.3 ± 0.8 tumors per mouse (3 tumors in 10 animals), and for Aag+/+ animals, 0.2 ± 0.6 tumors per mouse (2 tumors in 10 animals). Although there were no significant differences in tumor multiplicity or incidence between Aag+/+ and Aag–/– mice treated with 5 cycles of DSS, it was clear that there were major pathological differences between Aag+/+ and Aag–/–animals, as shown in Figure 1D and in Figure 2 (see below). DSS-induced general pathologies are more severe in Aag–/– mice. We assessed the following colitis-related disease markers: decreased colon length due to healing ulcers and fistulas (Figure 2A) and increased spleen weight (Figure 2B). As shown in Figure 2A, colons from Aag–/– mice were significantly shorter than those of Aag+/+ mice treated with AOM+DSS or treated with DSS alone. Changes in spleen weight also indicate that DSS-induced colitis affects Aag–/– more severely than Aag+/+ mice. Colitis-associated splenomegaly, as determined by spleen weight and histopathology, was attributable to extramedullary hematopoiesis, presumably to replenish blood lost through stools due to tumors or ulcerations and to supply neutrophils to inflamed areas. Figure 2B shows a significantly greater increase in spleen weight in Aag–/– versus Aag+/+ animals for all treatment groups (P < 0.01). Note that the Aag+/+ spleen weight only increased when DSS treatment was preceded by AOM treatment, yet DSS treatment alone led to a significant increase in the Aag–/– spleen weight compared with untreated Aag–/– animals (P = 0.002) and compared to similarly treated Aag+/+ animals (P = 0.002). Taken together, these results show that Aag–/– animals respond more profoundly to, and manifest slower recovery from, DSS-induced chronic inflammation compared with Aag+/+ animals. Intestinal changes at the cellular level were determined by histopathological analysis. H&E-stained colon sections were scored blindly for inflammation, epithelial defects, and crypt atrophy. Scoring criteria are described briefly in Methods and in full in Supplemental Methods (supplemental material available online with this article; doi:10.1172/JCI35073DS1). Five cycles of DSS induced similar levels of inflammation in Aag+/+ and Aag–/– animals, as judged histologically by the degree of leukocyte infiltration, aggregation, and follicle formation (see Supplemental Methods for
The Journal of Clinical Investigation http://www.jci.org Volume 118 Number 7 July 2008
research article
Figure 3 Increased severity of disease in Aag–/– versus Aag+/+ animals treated with 7 cycles of DSS. (A) Treatment scheme. (B) Decrease in colon length for Aag–/– animals (n = 18) compared with Aag+/+ animals (n = 7). (C) Increase in spleen weight as a percentage of body weight for Aag+/+ (n = 7) and Aag–/– animals (n = 18). Data are mean ± SD. (D) Pathology scores for Aag+/+ (circles) and Aag–/– (diamonds) mice. (E) Histopathology of colonic disease induced by 7 cycles of DSS. From left to right: Aag+/+ colon exhibited moderate inflammation and glandular epithelial hyperplasia; Aag+/+ colon exhibited mild dysplasia characterized by epithelial cell pleomorphism and mild branching, with hyperplasia and inflammation; Aag–/– colon exhibited moderate to severe inflammation, crypt atrophy, mucosal collapse, and segmental epithelial cell loss; Aag–/– colon exhibited a portion of an intraepithelial neoplasia with mucosal dysplasia characterized by loss of columnar orientation, elongation, branching and infolding, glandular ectasia, inflammation, and crypt abscesses. Scale bars: 100 μm.
description of scoring criteria). However, significant differences in epithelial defects were seen for Aag–/– versus Aag+/+ mice (Figure 2, C and D). Even though there is no histological difference in the level of chronic inflammation, the cellular and tissue defects are more severe in Aag–/– animals. These results prompted us to evaluate the effects of longer DSS administration in the Aag mutant model. Aag deficiency enhances tumor development with extensive cycles of DSS. Given 7 cycles of DSS in drinking water (Figure 3A), Aag–/– animals developed more tumors than Aag+/+ mice and were much more severely affected for most pathophysiological criteria measured. With regard to tumor development, 7 of the 18 Aag–/– animals (39%) developed tumors, while none of the similarly treated WT mice (n = 7) developed any tumors (P = 0.07). All 7 affected Aag–/– animals had 1 colonic polyp displaying significant dysplasia (score of 2.5–3; Figure 3D). Colon lengths decreased and spleen weights increased more in Aag–/– versus Aag+/+ animals (Figure 3, B and C). Moreover, histopathological scores for inflammation, epithelial defects, and crypt atrophy were significantly higher in the Aag–/– cohort versus the Aag+/+ mice (Figure 3D). While the extent and severity of dysplasia
were generally worse in Aag–/– versus Aag+/+ mice, the differences in their histopathological scores did not reach significance (Figure 3D). Figure 3E shows examples of the severity of colonic disease induced by 7 cycles of DSS in Aag+/+ and Aag–/– animals. Lesions in Aag+/+ mice included moderate mucosal and submucosal inflammation plus glandular epithelial hyperplasia (Figure 3E, WT untreated) and moderate dysplasia (Figure 3E, WT+DSS), whereas lesions in Aag–/– mice were worse, with moderate to severe mucosal and submucosal inflammation, crypt atrophy, and mucosal collapse (Figure 3E, Aag–/– untreated) and with highly dysplastic adenomas also present in some animals (Figure 3E, Aag–/–+DSS). Taken together, these data show that even in the absence of an initiating dose of AOM, Aag–/– animals are more susceptible than Aag+/+ to the detrimental effects of chronic inflammation induced by repeated DSS cycles. Aag suppresses the severity of gastric lesions following infection with H. pylori. To determine whether Aag influences disease progression in another model of chronic inflammation, we infected Aag+/+ and Aag–/– mice with the pathogen H. pylori and analyzed gastric pathology at 32 weeks after infection. Although no gastric cancer developed during this relatively short experimental time frame, Aag–/– mice were
The Journal of Clinical Investigation http://www.jci.org Volume 118 Number 7 July 2008
2519
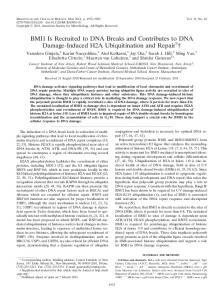
research article Figure 4 Increased severity of stomach pathology in Aag–/– versus Aag+/+ animals infected with H. pylori. (A) Histopathology of gastric disease and mucosal metaplasia induced by H. pylori infection in the stomach mucosa of Aag+/+ or Aag–/– mice. Uninfected Aag+/+ mouse stomach showed normal microscopic architecture (H&E) and a thin surface lining of gastrictype neutral mucins (red; AB/PAS), and anti-TFF2 stained intermittent mucous neck cells within normal oxyntic mucosa. Uninfected Aag–/– mice were indistinguishable from the uninfected Aag+/+, so only the Aag+/+ is shown. For infected Aag–/– mice, moderate gastritis with marked mucous metaplasia, hyperplasia, and oxyntic atrophy (loss of parietal and chief cells) was observed (H&E). Hyperplastic mucous neck cell population replaced resident zymogenic cells, secreting a mixture of gastric (red) and intestinal-type (acidic, blue) mucins (AB/PAS). Mucous metaplasia associated with expanded mucous neck cell population highlighted by TFF2 immunoreactivity. For infected Aag+/+ mice, gastritis but minimal oxyntic alterations were observed (H&E). Mucous neck cells were significantly reduced in number in the Aag+/+ H. pylori–infected mouse (AB/PAS). Fewer TFF2-positive mucous neck cells were observed in the infected Aag+/+ mouse. Scale bars: 160 μm. (B) Pathology scores for infected Aag+/+ (circles) and infected Aag–/– (diamonds) mice. (C) Serum IgG1 and IgG2c responses to H. pylori in Aag–/– and Aag+/+ mice 32 weeks after infection. (D) H. pylori colonization levels in the stomach. Data presented as mean ± SD of log-transformed CFU/μg of genomic DNA.
clearly more susceptible to developing histopathologic lesions that were markers of increased predisposition to, or were precursors to, gastric cancer (26–28) (Figure 4A). Aag–/– mice had significantly more oxyntic atrophy (P = 0.002), foveolar hyperplasia (P = 0.04), and mucosal metaplasia (P < 0.001) (Figure 4B). Importantly, the innate and adaptive immune responses to the bacteria were unaffected by the Aag genotype: Aag–/– and Aag+/+ mice had similar histopathological scores for inflammation and serum levels of the H. pylori–specific IgG1 and IgG2c antibodies (Figure 4C). Also, the colonization of the gastric mucosa by H. pylori, as measured by quantitative PCR, was unaffected by Aag genotype (Figure 2520
4D). In summary, the inflammatory response to H. pylori in Aag+/+ and Aag–/– mice is the same, but Aag–/– mice develop significantly more severe gastric lesions that are precursors to gastric cancer. Aag does not suppress tumorigenesis in the absence of chronic inflammation. It was possible that Aag might influence tumor development independent of chronic inflammation. However, this did not appear to be the case. When crossed with ApcMin mice, a robust genetic model for identifying modifiers of intestinal tumorigenesis that does not involve chronic inflammation, Aag+/+ and Aag–/– mice had nearly identical tumor responses (Supplemental Figure 1). Aag did not affect tumor multiplicity in either the small intestine (Sup-
The Journal of Clinical Investigation http://www.jci.org Volume 118 Number 7 July 2008
research article
Figure 5 Induction of εA, εC, and 8oxoG lesions by chronic inflammation and Ctnnb1 mutations in colon tumors. Six- to 8-week-old male mice were untreated or were administered 2.5% DSS for 5 days and euthanized 1 or 7 days after treatment. Levels of the modified bases εA (A), εC (B), and 8oxoG (C) were measured from colonic mucosal DNA and are shown for Aag-proficient (+) and Aag-deficient (–) mice. Within treatment groups, we observed no differences between Aag+/+ and Aag–/– mice, and thus these genotypes were combined in the analysis. Data are mean ± SD. (D–F) Point mutations in Ctnnb1. (D and E) Chromatogram showing an example of the most common mutation observed, a G:C to A:T transition in codon 41 of Ctnnb1. The arrow indicates the peaks for the mutant and WT sequences. (E and F) Distribution of mutations in Ctnnb1. Base substitutions are indicated below the sequence, and their frequencies are shown for the different experimental groups. (F) Deletion mutants in Ctnnb1. Chromatograms of the 2 deletion mutants are shown with an arrow below the sequence indicating the deletion junction. Also shown is the deleted sequence (lowercase) with red highlighting of regions of microhomology between the deleted portion and the adjacent retained sequence.
plemental Figure 1A) or the colon (Supplemental Figure 1B) or the distribution of tumors throughout the entire intestine (Supplemental Figure 1C). Furthermore, tumor size was unaffected by Aag (Supplemental Figure 1D). In summary, in the absence of inflammation, we observed no effect of Aag on colon tumorigenesis. It was also possible that Aag–/– mice were differentially sensitive to the single dose of AOM used to initiate tumorigenesis. C57BL/6J animals form appreciable numbers of aberrant crypt foci (ACF) in response to AOM (29), but in the absence of treatment with exogenous tumor promoters, neoplasia is infrequent. To determine whether Aag modulates this initiation response, colons from animals treated with AOM alone were examined for ACF formation. Aag deficiency had no effect on ACF formation (Supplemental Figure 2). Similarly, Aag deficiency had no significant effect on
tumor responses following 5 weekly treatments with AOM, as 2 of 8 Aag+/+ animals and 1 of 12 Aag–/– animals each developed a single tumor. This result is consistent with the low overall tumor response of C57BL/6J animals to AOM in the absence of subsequent chronic inflammation. This confirms that the heightened susceptibility of Aag–/– mice to tumor formation in the 2-stage carcinogenesis model is not due to a differential response to the initiating carcinogen, AOM, but rather to the chronic inflammation induced by DSS exposure. Finally, it was possible that Aag–/– animals respond aberrantly to episodic bouts of colitis because of an altered innate inflammatory response. To address this issue, we used Citrobacter rodentium to evaluate the effects of acute inflammation in Aag–/– versus Aag+/+ animals; such infection induces acute hyperplastic colitis (30). No
The Journal of Clinical Investigation http://www.jci.org Volume 118 Number 7 July 2008
2521
research article clinical disease was observed in Aag+/+ or Aag–/– mice infected with C. rodentium (data not shown). Fecal bacterial shedding was detected at 4 days after infection and was indistinguishable between Aag+/+ and Aag–/– mice throughout 30 days of the experiment (Supplemental Figure 3). Similarly, there were no differences between Aag+/+ and Aag–/– mice with regard to colonic lesions throughout the course of the infection, and these lesions were largely resolved by 30 days after infection. Thus, we observed no effect of Aag on mounting an acute inflammatory reaction. Modified bases following DSS treatment. Given the results presented above, our working hypothesis was that DSS-induced colitis results in RONS-induced DNA damage that is poorly repaired in the absence of Aag and that the unrepaired DNA lesions enhance tumorigenesis. In support of this hypothesis, we demonstrated that reactive nitrogen species are indeed formed after DSS treatment, by positive staining for nitrotyrosine, a known marker for NO-induced peroxynitrite formation, in colons of both WT and Aag–/– mice treated with AOM+DSS (Supplemental Figure 4). In addition, we used a recently developed and extremely sensitive LC/MS method to measure endogenous levels of a selection of DNA lesions known to be induced by RONS (31). We quantified the modified DNA bases εA, εC, 8oxoG, and Hx in colonic epithelial DNA from untreated and DSS-treated mice. Levels for all modified bases in the untreated groups were not appreciably different between Aag-proficient and Aag-deficient animals, suggesting that Aag does not affect the accumulation of these lesions in the colons of relatively young animals that have not experienced colitis (Figure 5). After a single cycle of DSS, levels of εA and εC increased significantly relative to the untreated groups (P < 0.0002) and increased with time in both groups of animals after DSS was terminated (P < 0.04) (Figure 5, A and B). These increases were more dramatic in the Aag-deficient versus Aag-proficient animals. At 1 and 7 days after treatment, the εA increase was 1.5- and 1.8-fold higher in Aag-deficient than that in Aag-proficient animals, respectively (Figure 5A), and εC was 1.4- and 2.0-fold higher (Figure 5B), respectively. These differences represent significant effects of Aag on the levels of both ε-lesions in response to DSS (P = 0.01 for both) treatment. Levels of εA in the Aag-deficient mice showed the greatest difference of any lesion relative to untreated mice. Seven days after DSS treatment was terminated, Aag-deficient mice had 14-fold higher levels of εA compared with the mean levels from all untreated mice. Levels of 8oxoG also increased with DSS treatment (P = 0.05) and, like εA and εC, it increased to higher levels in Aag-deficient versus Aag-proficient animals. At 1 and 7 days after DSS was stopped, the increases in 8oxoG levels were 1.7- and 1.8-fold higher in Aagdeficient mice versus those in Aag-proficient mice (P = 0.01) (Figure 5C). Although there was a trend for increasing levels of Hx in the colonic mucosae of repair deficient mice, the overall effect of inflammation on levels of this lesion were not significant (P = 0.2) (Supplemental Figure 5). Oncogenic mutations. Microdissected tumors were analyzed to determine whether damage that resulted from RONS affected the mutation spectra in the candidate oncogenes Ctnnb1 and Kras2, which are commonly mutated in mouse colon tumors (Figure 5 and Supplemental Table 1). We sequenced a portion of exon 2 from Ctnnb1 (homologous to exon 3 in human CTNNB1) corresponding to the coding sequence for the glycogen synthase kinase-3β phosphorylation domain. In addition, we sequenced portions of exons 1 and 2 from Kras2, corresponding to the coding sequences for the codon 12 and codon 61 regions, respectively. Oncogenic 2522
mutations were detected in Ctnnb1 in most tumors analyzed, while only 1 tumor among all groups had a mutation in Kras2 (a G:C to A:T transition in the second base of codon 13 from a tumor in an Aag–/– mouse treated with AOM+DSS) (Supplemental Table 1). Figure 5E shows an example of the most common mutation, observed at codon 41 in Ctnnb1, and Figure 5F shows the positions for all identified base substitutions. When tumors were initiated with AOM, all but 1 of the mutations were G:C to A:T transitions, reflecting the mutational specificity of this carcinogen. Aag–/– animals that were treated with DSS alone showed a similar fraction of tumors with mutations in Ctnnb1 (5 of 6). However, in this group only 2 of the 5 mutations were G:C to A:T transitions, while the others included an A:T to G:C transition and 2 in-frame deletion mutations (Supplemental Table 1 and Figure 5F). While the sample size is small, the fraction of deletion mutants (2 of 5) represents a significant difference (P = 0.02) from that of the combined tumors from Aag–/– and Aag+/+ mice treated with AOM+DSS (0 of 26). These results suggest that oncogenic deletion mutants are generated by unrepaired RONS-induced lesions in DNA. Discussion Every year, approximately 1 million cases of CRC are diagnosed worldwide. Those with a familial component could constitute 10% to 50% of all CRC cases (4, 32), but the fraction of cases caused by highly penetrant familial cancer syndromes such as Lynch syndrome or familial adenomatous polyposis is relatively small. Indeed, the genetic basis for most cases of familial susceptibility is unknown (32). It is likely that a combination of low and moderately penetrant genes interact with environmental factors to modify risk for CRC (33). Approximately 5% of patients with UC develop colon cancer, and no susceptibility genes for inflammation associated CRC have been identified (2). Being able to identify those in the population who are at increased risk of CRC could reduce the number of CRC-related deaths. We report here that Aag deficiency in a mouse model grossly increases the extent of pathology in the intestinal mucosa in response to chronic inflammation. This deficiency enhances inflammation-associated colon tumorigenesis in 2 carcinogenesis protocols, treatment with AOM+DSS and treatment with DSS alone. As a measure of the generality of this effect, following infection with H. pylori, Aag deficiency predisposes to the development of gastric cancer precursor lesions. H. pylori chronic gastritis is associated with increased production of RONS in the host (reviewed in ref. 34). This pathogen is an enormous public health concern, with over 50% of the world population being infected and 5% of all human cancers attributed to H. pylori infection and its associated inflammation (35, 36). Finally, Aag had no effect on the development of AOM-induced ACF or tumor development and had no effect on spontaneous tumorigenesis in mice on the ApcMin background, indicating that Aag suppresses chronic inflammation-related cancer development. The number of ε-base lesions and 8oxoG increased in the colons of mice after a single DSS cycle, consistent with previous reports that inflammation is associated with increased ε-base lesions (10, 37), that ε-base lesions increase more than oxidized or deaminated lesions in response to inflammation (31), and that 8oxoG is induced by DSS treatment in rats (12). Moreover, inflammationinduced εA, εC, and 8oxoG increased more dramatically in the Aag-deficient animals, consistent with the ability of Aag to excise both εA and 8oxoG. Interestingly, although Aag binds tightly to
The Journal of Clinical Investigation http://www.jci.org Volume 118 Number 7 July 2008
research article
Figure 6 Model for inflammation-induced tumorigenesis. Inflammatory cells produce cytokines that induce proliferation and suppress apoptosis. The toxic effects of RONS can partially counterbalance these signals, leading to cell death or an inability to repopulate eroded regions. Either cytotoxicity or cytostasis would require neighboring cells to replicate for healing to occur, and under chronic conditions, cell death could further stimulate inflammation. In addition, survival factors act in concert with RONS-induced miscoding or replication blocking DNA lesions to fix and expand cancer-causing mutations.
εC, it does so without catalyzing its excision (38); it seems likely that the binding of Aag to εC in vivo facilitates its repair via an alternative repair pathway. In summary, the accumulation of DNA base damage in Aag–/– mice in response to DSS provides a causal link between repair deficiency and carcinogenesis. Our data demonstrate that DNA repair under chronic inflammatory conditions is an important suppressor of cancer development. Chronic inflammation produces a complex milieu of growth factors and cytokines that cause general hyperplasia, and we propose that the proliferative and antiapoptotic signals generated during chronic inflammation act synergistically with DNA damage to enhance cancer development (6–8). Our results are consistent with 2 different but not mutually exclusive effects of RONS-dependent DNA damage that could lead to increased tumor development in a repair-deficient situation (Figure 6). One effect involves a snowballing mechanism of increased levels of cellular damage and death leading to more inflammation, which in turn produces more tumor-promoting cytokines and more RONS (Figure 6). Consistent with this model is our observation that Aag–/– mice had much more severe gross pathological and general histopathological changes than Aag+/+ with DSS treatment. The differences between Aag–/– and Aag+/+ mice were evident at 5 cycles but were much more dramatic at 7 cycles. Importantly, after 7 cycles of DSS Aag–/– mice had significantly more general inflammation than Aag+/+ mice. Another effect that is likely acting in concert with that described above is that base damage in the presence of proliferative and antiapoptotic signals could serve to fix and expand cancer-causing mutations (Figure 6). Of the base lesions found at higher levels with DSS treatment and Aag deficiency, εA induces A:T to G:C and A:T to T:A mutations, εC induces C:G to A:T and C:G to T:A
mutations, and 8oxoG induces G:C to T:A transversions (39–41). In addition, both εC and εA are replication-blocking lesions (38, 42). It has been reported that DSS promotion of AOM- or dimethylhydrazine-initiated tumors (AOM is a proximal carcinogen of dimethylhydrazine) results in tumors with predominantly G:C to A:T transitions in Ctnnb1, consistent with the mutational specificity of these carcinogens (43, 44). However, Greten et al. (7) showed that only 3 of 7 tumors from AOM+DSS-treated mice had G:C to A:T transitions, while the rest were mutations at A:T base pairs. In the present study, tumors from AOM+DSS-treated mice harbored predominantly G:C to A:T transitions, and the spectrum was not affected by Aag deficiency. In contrast, the pattern was significantly different in Aag–/– mice treated only with DSS, in which nearly half the mutations in Ctnnb1 were deletions. Such alterations could arise from replication-blocking ε-base lesions. Unlike DSS-induced colon tumors in mice, human UC-associated cancers commonly harbor TP53 mutations (45, 46). Circumstantial evidence that these mutations are caused by RONS lies in the fact that RONS enhance deamination at 5MeC, and most of the TP53 mutations in UC-associated cancers were G:C to A:T transitions at 2 hot-spot CpG dinucleotide sites. Interestingly, these mutations are found in both neoplastic and non-neoplastic tissue in the UC colon (45, 46). A panoply of DNA glycosylases have evolved to repair oxidized bases in DNA. Among them, OGG1, which removes 8oxoG, and MYH, which removes adenine paired with 8oxoG, are important in suppressing G:C to T:A transversions and in preventing CRC in people and mice (reviewed in ref. 41). These glycosylases suppress CRC in the absence of chronic inflammation, and their association with inflammation-associated cancer is not known. One might expect Ogg1- or Myh-deficient mice to display marked increases in susceptibility to cancer development that is stimulated by inflammation. In light of our results, AAG and other BER genes are strong candidates for genetic association studies of human CRC or gastric cancer risk. Although there are no known polymorphisms that alter AAG function, a 20-fold range in activity was observed in peripheral mononuclear cells from over 50 healthy adults (E. Moy, D. Christiani, and L.D. Samson, unpublished observations). Indeed, decreased 8oxoG DNA glycosylase activity in human blood samples has been associated with increased lung cancer risk, which may also have an inflammatory component (47). Measurements of interindividual differences in the activity of AAG, OGG, and other DNA glycosylases may provide an informative parameter in the multifactorial dissection of cancer risk. This may be particularly important for gene-environment interactions with states of chronic inflammation or with other conditions known to increase oxidative stress such as metal storage diseases, heavy metal exposure, smoking, and chronic infection. Methods Animals The Aag–/– mouse has been described (48, 49), and Aag–/– animals were backcrossed into C57BL/6J background for over 12 generations. C57BL/6J-ApcMin mice were obtained from The Jackson Laboratory. For the H. pylori studies, animals were maintained in microisolator cages as previously described (50), and dirty bedding from Aag–/– and Aag+/+ mice were mixed to ensure all groups had similar commensal microbial flora. All mice were fed a standard diet ad libitum and housed in an AAALAC-accredited facility. Euthanasia was by CO2 asphyxiation, and all procedures were approved by the Massachusetts Institute of Technology Committee on Animal Care.
The Journal of Clinical Investigation http://www.jci.org Volume 118 Number 7 July 2008
2523
research article Experimental treatments Colitis-inducing protocol. Colitis was induced by repeated administration of DSS for either 5 or 7 cycles beginning at 6–8 weeks of age. Tap water was replaced with 2.5% DSS (molecular weight, 36,000–50,000; MP Biomedicals Inc.) in distilled water for 5 days followed by 16 days of tap water (except for the 5th or 7th cycle, in which 2% DSS was given for 4 days followed by 5 days of tap water). Five days prior to the first DSS cycle, animals were treated (or not) with an initiating i.p. dose of 12.5 mg/kg AOM (Midwest Research Institute, NCI Chemical Repository), then subjected to 5 DSS cycles. Experiments involving 5 cycles of DSS administration terminated on day 100; experiments involving 7 cycles of DSS administration were terminated on day 142. Alternatively, animals were treated only with AOM (12.5 mg/kg) and euthanized 100 days later, or treated once a week with AOM (10 mg/kg) and euthanized 175 days later. H. pylori study. H. pylori Sydney strain (SS1) was used for oral inoculation as described previously (50, 51). The H. pylori concentrations were adjusted to OD600 = 1.000 in PBS, and mice were dosed with a 0.2-ml suspension by gavage every other day for 3 doses. Control mice were dosed with PBS. Animals were euthanized 32 weeks after inoculation. ApcMin study. ApcMin/+ mice were crossed with Aag–/– mice, and F2 or F3 generation littermates were used in tumor studies. Animals were euthanized at 130 days of age and the colon and small intestines were removed, washed with PBS, cut open, and measured. Tumors greater than 0.5 mm in diameter were counted under a stereoscope and measured with an ocular reticle. The position of each tumor along the length of the intestine was recorded. Most tumors that develop in ApcMin mice occur in the small intestine, with relatively few in the colon (52).
Histopathology Colitis experiment. The entire colon from cecum to anus was removed, washed with PBS, cut open, and measured. Spleens were weighed and fixed in 10% neutral buffered formalin. Polyps were counted using a stereomicroscope (magnification, ×45). Proximal and distal colons were fixed in 10% neutral buffered formalin for 4 hours, embedded in paraffin, sectioned at 5 μm, and stained with H&E for histopathological confirmation of polyps and/ or adenomas (neoplasia). Lesion scores were assigned for inflammation, epithelial defects, crypt atrophy, dysplasia/neoplasia, and area affected by dysplasia. Inflammation was defined as mild to severe, depending on the degree of leukocyte infiltration and extent of inflammation in the different cell layers of the colon (mucosa, submucosa, and deeper layers). Epithelial defects were scored according to extent and severity of damage to the epithelial cell layer. Crypt atrophy was scored by a visual estimate of percent atrophy in the colonic crypts in the most affected area. Dysplasia/ neoplasia scores represent the severity of the cellular changes brought on by treatment, from mild atypia to severe dysplastic/neoplastic changes. For a more detailed description of scoring criteria, see Supplemental Methods. Alternatively, colons from animals belonging to the AOM treatment group were stained briefly with methylene blue (1%) and rinsed in PBS for scoring of ACF. ACF were scored under a stereomicroscope (magnification, ×45). No gender differences were observed (data not shown), thus the results for female and male mice were combined. H. pylori study. At necropsy, the stomach and proximal duodenum were removed and cut along the greater curvature. Linear gastric strips from the lesser curvature were fixed overnight in 10% neutral-buffered formalin or 70% ethanol, embedded, cut at 4 μm, and stained with H&E. Stomachs from infected and control mice were characterized with Alcian blue at pH 2.5 (for acidic, intestinal-type mucins) and with periodic acid–Schiff (for neutral, gastric-type mucins) (53). Expression of trefoil factor 2 (TFF2) protein was characterized by immunohistochemistry (54). Lesions were scored by a veterinary pathologist blinded to sample identity as described previously (53). 2524
Gastric colonization by H. pylori was quantified using a fluorogenic quantitative PCR assay as previously described (51). Also, serum collected at necropsy was evaluated for H. pylori–specific IgG1 (Th2-associated isotype) and IgG2c (Th1-associated isotype) by ELISA using an outer membrane protein preparation from H. pylori (SS1 strain) as previously described (55).
Mutations in oncogenes Tumors were microdissected using an Arcturus-Veritas 2006 Laser Capture Microscope, and DNA was prepared for PCR amplification using the PicoPure DNA extraction kit (Arcturus). Ctnnb1 exon 2 was amplified with primers 5′-GCTGACCTGATGGAGTTGGA-3′ and 5′-GCTACTTGCTCTTGCGTGAA-3′. Kras2 exon 1 was amplified with primers 5′ TAAACTTGTGGTGGTTGGAGC-3′ and 5′-AGCGTTACCTCTATCGTAGG-3′, and exon 2 with primers 5′-CTCTTGGATATTCTCGACACAGC-3′ and 5′-TTATGGCAAATACACAAAGAAAGC 3′. The Ctnnb1 fragment was sequenced with the primer 5′-GCTCTTGCGTGAAGGACTG-3′, Kras2 exon 1 region with the reverse primer listed above, and Kras2 exon 2 region with the primer 5′-ATACACAAAGAAAGCCCTCC-3′. Mutations were scored by visual assessment of chromatograms using Sequencher software (Gene Codes Corp.). Amplification reactions containing deletion mutants were cloned into a blunted HindIII site of pUC18, and at least 2 clones of each of the shortened fragments were sequenced with the pUC18 primer 5′-CCATTCAGGCTGCGCAACTG-3′.
Measurement of modified bases Six- to 8 week-old male mice were administered 2.5% DSS for 5 days and were euthanized 1 or 7 days following treatment. Colons were flushed with cold PBS, splayed open, and washed again. The mucosal surface was scraped thoroughly with a razor blade in cold PBS. The suspension of mucosal cells was transferred to a 15-ml conical tube and harvested by centrifugation for genomic DNA isolation (Roche). Antioxidants or deaminase inhibitors were added to the PBS, lysis buffer, and protein precipitation solution; coformycin (5 μg/ml), desferrioxamine (0.6 μg/ml), and butylated hydroxytoluene (100 μM). εA, εC, 8oxoG, and Hx were quantified as described previously (31). Measurements were on DNA prepared from 3 animals per group, with the following exceptions: Aag+/+ untreated was 1 measurement from 2 pooled samples, Aag–/– untreated was from 2 samples, and Aag+/+ at 7 days was from 2 samples for εA, εC, and 8oxoG, and only one for Hx.
Statistics GraphPad Prism software was used for statistical analyses. Mann-Whitney test was used to compare tumor multiplicities and pathological scoring data. Fisher’s exact was used to compare frequencies. For H. pylori studies, group means of serum antibody titers and log-transformed bacterial colonization data were compared using a student’s t test. For DNA lesions, 2-way ANOVA was used to assess effects of treatment and genotype. All P values listed are 2 sided except in our comparison of tumor incidence after 7 cycles of DSS where we were confirming that Aag deficiency increased tumor sensitivity. Data are mean ± SD.
Acknowledgments We thank Kristin Glavine, Rashida Nek, and Emma Wang for excellent technical help; the MIT Center for Environmental Health Sciences Bioanalytical Core Facility, especially Koli Taghizadeh; the MIT Center for Cancer Research and the Division of Comparative Medicine Histology Core Facilities, especially Alicia Caron; the MIT Center for Cancer Research Microscopy and Imaging Core Facility, especially Elisa Vasile. We are indebted to Roderick Bronson for help with histopathology analysis in the very initial stages
The Journal of Clinical Investigation http://www.jci.org Volume 118 Number 7 July 2008
research article of this work. We also thank Bevin Engelward and Axel Nohturfft for helpful comments on this work. Research was supported by NIH grants ES02109, CA75576, and AI37750. L.D. Samson is an American Cancer Society Research Professor.
Address correspondence to: Leona D. Samson, Massachusetts Institute of Technology, 77 Massachusetts Avenue, Cambridge, Massachusetts 02139, USA. Phone: (617) 258-7813; Fax: (617) 2538099; E-mail:
[email protected].
Received for publication January 18, 2008, and accepted in revised form April 16, 2008.
Lisiane B. Meira, James M. Bugni, and Stephanie L. Green contributed equally to this work.
1. Tanaka, T., et al. 2003. A novel inflammation-related mouse colon carcinogenesis model induced by azoxymethane and dextran sodium sulfate. Cancer Sci. 94:965–973. 2. Gillen, C.D., Walmsley, R.S., Prior, P., Andrews, H.A., and Allan, R.N. 1994. Ulcerative colitis and Crohn’s disease: a comparison of the colorectal cancer risk in extensive colitis. Gut. 35:1590–1592. 3. Itzkowitz, S.H., and Yio, X. 2004. Inflammation and cancer IV. Colorectal cancer in inflammatory bowel disease: the role of inflammation. Am. J. Physiol. Gastrointest. Liver Physiol. 287:G7–G17. 4. Parkin, D.M., Bray, F., Ferlay, J., and Pisani, P. 2005. Global cancer statistics, 2002. CA Cancer J. Clin. 55:74–108. 5. Helicobacter and Cancer Collaborative Group. 2001. Gastric cancer and Helicobacter pylori: a combined analysis of 12 case control studies nested within prospective cohorts. Gut. 49:347–353. 6. Coussens, L.M., and Werb, Z. 2002. Inflammation and cancer. Nature. 420:860–867. 7. Greten, F.R., et al. 2004. IKKbeta links inflammation and tumorigenesis in a mouse model of colitis-associated cancer. Cell. 118:285–296. 8. Karin, M. 2006. Nuclear factor-kappaB in cancer development and progression. Nature. 441:431–436. 9. Wiseman, H., and Halliwell, B. 1996. Damage to DNA by reactive oxygen and nitrogen species: role in inflammatory disease and progression to cancer. Biochem. J. 313:17–29. 10. Bartsch, H., and Nair, J. 2002. Potential role of lipid peroxidation derived DNA damage in human colon carcinogenesis: studies on exocyclic base adducts as stable oxidative stress markers. Cancer Detect. Prev. 26:308–312. 11. Baik, S.C., et al. 1996. Increased oxidative DNA damage in Helicobacter pylori-infected human gastric mucosa. Cancer Res. 56:1279–1282. 12. Tardieu, D., et al. 2000. The COX-2 inhibitor nimesulide suppresses superoxide and 8-hydroxy-deoxyguanosine formation, and stimulates apoptosis in mucosa during early colonic inflammation in rats. Carcinogenesis. 21:973–976. 13. Wyatt, M.D., and Pittman, D.L. 2006. Methylating agents and DNA repair responses: Methylated bases and sources of strand breaks. Chem. Res. Toxicol. 19:1580–1594. 14. Cheadle, J.P., Dolwani, S., and Sampson, J.R. 2003. Inherited defects in the DNA glycosylase MYH cause multiple colorectal adenoma and carcinoma. Carcinogenesis. 24:1281–1282; author reply 1283. 15. Sakamoto, K., et al. 2007. MUTYH-null mice are susceptible to spontaneous and oxidative stress induced intestinal tumorigenesis. Cancer Res. 67:6599–6604. 16. Sieber, O.M., et al. 2004. Myh deficiency enhances intestinal tumorigenesis in multiple intestinal neoplasia (ApcMin/+) mice. Cancer Res. 64:8876–8881. 17. Russo, M.T., et al. 2004. Accumulation of the oxidative base lesion 8-hydroxyguanine in DNA of tumor-prone mice defective in both the Myh and Ogg1 DNA glycosylases. Cancer Res. 64:4411–4414. 18. Sakumi, K., et al. 2003. Ogg1 knockout-associated lung tumorigenesis and its suppression by Mth1 gene disruption. Cancer Res. 63:902–905. 19. Bessho, T., et al. 1993. Repair of 8-hydroxyguanine in DNA by mammalian N-methylpurine-DNA gly-
cosylase. Proc. Natl. Acad. Sci. U. S. A. 90:8901–8904. 20. Hofseth, L.J., et al. 2003. The adaptive imbalance in base excision-repair enzymes generates microsatellite instability in chronic inflammation. J. Clin. Invest. 112:1887–1894. 21. Okayasu, I., et al. 2002. Dysplasia and carcinoma development in a repeated dextran sulfate sodiuminduced colitis model. J. Gastroenterol. Hepatol. 17:1078–1083. 22. Palmen, M.J., et al. 1995. Non-lymphoid and lymphoid cells in acute, chronic and relapsing experimental colitis. Clin. Exp. Immunol. 99:226–232. 23. Seril, D.N., Liao, J., Ho, K.L., Yang, C.S., and Yang, G.Y. 2002. Inhibition of chronic ulcerative colitisassociated colorectal adenocarcinoma development in a murine model by N-acetylcysteine. Carcinogenesis. 23:993–1001. 24. Ohshima, H., and Bartsch, H. 1994. Chronic infections and inflammatory processes as cancer risk factors: possible role of nitric oxide in carcinogenesis. Mutat. Res. 305:253–264. 25. Blackwell, B.N., Bucci, T.J., Hart, R.W., and Turturro, A. 1995. Longevity, body weight, and neoplasia in ad libitum-fed and diet-restricted C57BL6 mice fed NIH31 open formula diet. Toxicol. Pathol. 23:570–582. 26. Correa, P. 1995. Helicobacter pylori and gastric carcinogenesis. Am. J. Surg. Pathol. 19(Suppl. 1):S37–S43. 27. Schmidt, P.H., et al. 1999. Identification of a metaplastic cell lineage associated with human gastric adenocarcinoma. Lab. Invest. 79:639–646. 28. Halldorsdottir, A.M., et al. 2003. Spasmolytic polypeptide-expressing metaplasia (SPEM) associated with gastric cancer in Iceland. Dig. Dis. Sci. 48:431–441. 29. Nambiar, P.R., et al. 2003. Preliminary analysis of azoxymethane induced colon tumors in inbred mice commonly used as transgenic/knockout progenitors. Int. J. Oncol. 22:145–150. 30. Mundy, R., MacDonald, T.T., Dougan, G., Frankel, G., and Wiles, S. 2005. Citrobacter rodentium of mice and man. Cell. Microbiol. 7:1697–1706. 31. Pang, B., et al. 2007. Lipid peroxidation dominates the chemistry of DNA adduct formation in a mouse model of inflammation. Carcinogenesis. 28:1807–1813. 32. de la Chapelle, A. 2004. Genetic predisposition to colorectal cancer. Nat. Rev. Cancer. 4:769–780. 33. Potter, J.D. 1999. Colorectal cancer: molecules and populations. J. Natl. Cancer Inst. 91:916–932. 34. Kusters, J.G., van Vliet, A.H., and Kuipers, E.J. 2006. Pathogenesis of Helicobacter pylori infection. Clin. Microbiol. Rev. 19:449–490. 35. Parkin, D.M. 2006. The global health burden of infection-associated cancers in the year 2002. Int. J. Cancer. 118:3030–3044. 36. Fox, J.G., and Wang, T.C. 2007. Inflammation, atrophy, and gastric cancer. J. Clin. Invest. 117:60–69. 37. Bartsch, H., and Nair, J. 2006. Chronic inflammation and oxidative stress in the genesis and perpetuation of cancer: role of lipid peroxidation, DNA damage, and repair. Langenbecks Arch. Surg. 391:499–510. 38. Gros, L., Maksimenko, A.V., Privezentzev, C.V., Laval, J., and Saparbaev, M.K. 2004. Hijacking of the human alkyl-N-purine-DNA glycosylase by 3,N4-ethenocytosine, a lipid peroxidation-induced DNA adduct. J. Biol. Chem. 279:17723–17730. 39. Moriya, M., Zhang, W., Johnson, F., and Grollman, A.P. 1994. Mutagenic potency of exocyclic DNA
adducts: marked differences between Escherichia coli and simian kidney cells. Proc. Natl. Acad. Sci. U. S. A. 91:11899–11903. 40. Pandya, G.A., and Moriya, M. 1996. 1,N6-ethenodeoxyadenosine, a DNA adduct highly mutagenic in mammalian cells. Biochemistry. 35:11487–11492. 41. David, S.S., O’Shea, V.L., and Kundu, S. 2007. Baseexcision repair of oxidative DNA damage. Nature. 447:941–950. 42. Levine, R.L., et al. 2000. Mutagenesis induced by a single 1,N6-ethenodeoxyadenosine adduct in human cells. Cancer Res. 60:4098–4104. 43. Kohno, H., Suzuki, R., Sugie, S., and Tanaka, T. 2005. Beta-Catenin mutations in a mouse model of inflammation-related colon carcinogenesis induced by 1,2-dimethylhydrazine and dextran sodium sulfate. Cancer Sci. 96:69–76. 44. Tanaka, T., et al. 2005. Colonic adenocarcinomas rapidly induced by the combined treatment with 2-amino-1-methyl-6-phenylimidazo[4,5-b]pyridine and dextran sodium sulfate in male ICR mice possess beta-catenin gene mutations and increases immunoreactivity for beta-catenin, cyclooxygenase-2 and inducible nitric oxide synthase. Carcinogenesis. 26:229–238. 45. Hussain, S.P., et al. 2000. Increased p53 mutation load in noncancerous colon tissue from ulcerative colitis: a cancer-prone chronic inflammatory disease. Cancer Res. 60:3333–3337. 46. Goodman, J.E., Hofseth, L.J., Hussain, S.P., and Harris, C.C. 2004. Nitric oxide and p53 in cancerprone chronic inflammation and oxyradical overload disease. Environ. Mol. Mutagen. 44:3–9. 47. Paz-Elizur, T., et al. 2003. DNA repair activity for oxidative damage and risk of lung cancer. J. Natl. Cancer Inst. 95:1312–1319. 48. Engelward, B.P., et al. 1997. Base excision repair deficient mice lacking the Aag alkyladenine DNA glycosylase. Proc. Natl. Acad. Sci. U. S. A. 94:13087–13092. 49. Roth, R.B., and Samson, L.D. 2002. 3-Methyladenine DNA glycosylase-deficient Aag null mice display unexpected bone marrow alkylation resistance. Cancer Res. 62:656–660. 50. Fox, J.G., et al. 2003. Helicobacter pylori-associated gastric cancer in INS-GAS mice is gender specific. Cancer Res. 63:942–950. 51. Fox, J.G., et al. 2003. Host and microbial constituents influence Helicobacter pylori-induced cancer in a murine model of hypergastrinemia. Gastroenterology. 124:1879–1890. 52. Moser, A.R., Dove, W.F., Roth, K.A., and Gordon, J.I. 1992. The Min (multiple intestinal neoplasia) mutation: its effect on gut epithelial cell differentiation and interaction with a modifier system. J. Cell Biol. 116:1517–1526. 53. Rogers, A.B., et al. 2005. Helicobacter pylori but not high salt induces gastric intraepithelial neoplasia in B6129 mice. Cancer Res. 65:10709–10715. 54. Wang, T.C., et al. 1998. Mice lacking secretory phospholipase A2 show altered apoptosis and differentiation with Helicobacter felis infection. Gastroenterology. 114:675–689. 55. Ihrig, M., Whary, M.T., Dangler, C.A., and Fox, J.G. 2005. Gastric helicobacter infection induces a Th2 phenotype but does not elevate serum cholesterol in mice lacking inducible nitric oxide synthase. Infect. Immun. 73:1664–1670.
The Journal of Clinical Investigation http://www.jci.org Volume 118 Number 7 July 2008
2525