Does Foreign Direct Investment Transfer Technology Across Borders?# (Forthcomming in the Review of Economics and Statistics; Submitted June 1998, final paper June 2000) Bruno van Pottelsberghe de la Potterie ⊥ and Frank Lichtenberg × ABSTRACT Previous studies have found that importing goods from R&D-intensive countries raises a country’s productivity. In this paper we investigate econometrically whether foreign direct investment (FDI) also transfers technology across borders. The data indicates that FDI transfers technology, but only in one direction: a country’s productivity is increased if it invests in R&D-intensive foreign countries--particularly in recent years--but not if foreign R&D-intensive countries invest in it. Other findings of the paper are: (1) the ratio of foreign-R&D benefits conveyed by outward FDI to foreign-R&D benefits conveyed by imports is higher for large countries than it is for small ones; (2) failure to account for international R&D spillovers leads to upwardly biased estimates of the output elasticity of the domestic R&D capital stock; and (3) there are much larger transfers of technology from the U.S. to Japan than there are from Japan to the U.S. JEL:
030, 047, O57 , C23, F23
Keywords: international R&D spillovers, Foreign direct investments, Trade, Technology sourcing.
#
The opinions expressed in this paper are those of the authors, and not those of Columbia University or
Université Libre de Bruxelles. The authors would like to thank Henri Capron, Michele Cincera, Christophe Dumont, Pierre Mohnen, Peter Pedroni and two anonymous referees for their useful comments and suggestions. ⊥
Université Libre de Bruxelles, Solvay Business School, Solvay Chair of Innovation, Centre Emile Bernheim and
DULBEA, CP 145-01, 21 av. F.D. Roosevelt, B-1050, Bruxelles. Tél/Fax : ++ 32 2 650 48 99; E-mail :
[email protected]. ×
Columbia University - Graduate School of Business, 3022 Broadway, 726 Uris Hall, New York, NY 10027 USA; e-
mail:
[email protected].
1
1. INTRODUCTION
Coe and Helpman presented evidence consistent with the hypothesis that technology spills over across countries through the channel of trade flows, and provided estimates of the magnitude of these spillovers. In a previous paper (1997), we re-examined two features of their econometric model. First, we argued that the weighting scheme they used to compute foreign R&D capital stocks is subject to an “aggregation bias”. We suggested an alternative weighting scheme that is theoretically much less biased and that yielded somewhat better empirical results. Second, we corrected an “indexation” bias and generalized their empirical framework by analyzing how the output elasticity of foreign R&D depends on a country’s openness to trade.1 The empirical results confirmed that the more open to trade a country is, the more likely it is to benefit from foreign R&D. In this paper we perform econometric tests of the hypothesis that the extent to which country i benefits (in terms of higher productivity) from the R&D performed by country j depends not only on the volume of country i’s imports from country j, but also on the extent of foreign direct investment (FDI) between the two countries--both “inward” FDI (investment by country j in country i) and “outward” FDI (investment by country i in country j). This hypothesis is based on the general notion that the extent to which country i benefits from country j’s R&D investment depends on the degree of economic interaction between the countries, or of their exposure to one another. It may be useful to draw an analogy between learning about foreign technology and learning a foreign language. I might learn a foreign language from foreigners living in my country (“inward FDI”), or I might learn it by living in a foreign country (“outward FDI”). Both are potentially useful 1
This indexation bias is only relevant to Coe and Helpman’s specification that has the foreign R&D capital stock
interacted with the import share.
1
2
and important methods of foreign language (knowledge) acquisition, although the latter perhaps tends to be more effective (it is more likely to involve “total immersion”). Similarly, both inward and outward FDI may facilitate acquisition of foreign technology. Dunning (1994, p. 81), however, has argued that although outward FDI is likely to have an unambiguously positive effect on productivity -”where foreign production adds to domestic production, the R&D base of the investing company is strengthened - whatever the nationality of the firm”--inward FDI may decrease indigenous innovative capacity. It may therefore have no effect or even a negative effect on productivity. In his survey of the empirical literature on international R&D spillovers, Mohnen (1996) tentatively identified the following three “stylized facts”: (1) foreign R&D contributes to productivity growth more in small countries than in large countries; (2) the output elasticity of foreign R&D is higher than the output elasticity of domestic R&D; and (3) the U.S. is an important R&D spillovergenerator but a weak spillover-receiver, and spillovers emanating from Japan are weak, if not nonexistent. The methodology that we use allows us to conduct formal econometric tests of each of these hypotheses. The paper is organized as follows. Section 2 briefly describes the existing evaluation methodologies of the impact of foreign R&D on domestic productivity growth. Since these studies fail to take into account the role of FDI, an insight is given into their potential effects. It is shown that their net effect may not be predicted, partly because they may be directed towards technology sourcing practices. Section 3 presents the econometric estimates of the impact on national productivity growth of foreign R&D embodied alternatively into imports, inward FDI, and outward FDI. Section 4 concludes.
2
3
2. INTERNATIONAL R&D SPILLOVERS
Given their inherent complexity, international technological spillovers have no widely accepted measures. The existing quantitative analyses focus on the impact of foreign technology on domestic productivity growth. The spillovers are considered to be either disembodied or embodied in a particular transfer channel. The main channels that have been used so far to measure the impact of international R&D spillovers on domestic productivity growth are international trade (Coe and Helpman (1995), Lichtenberg and Van Pottelsberghe (1997)), foreign technology payments (Soete and Patel (1985)), and disembodied R&D spillovers (the so-called vector approach) (Bernstein and Mohnen (1995)).2 In general, a majority of these studies tend to support the view that international R&D spillovers contribute to the productivity growth of industrialized countries. Neither inward FDI, nor technology sourcing have been examined empirically as a specific means of technology transfer. However, a literature exists on the potential direct effects of inward FDI on the host countries’ TFP growth. These studies yield conflicting results. Some of them suggest that inward FDI contributes to the productivity growth of local firms while others fail to find any positive impacts of FDI.3 It seems that technological spillovers are not an automatic consequence of inward FDI and that their net effect on the domestic economy is not a priori predictable.
2
In this case, authors measure the impact of the R&D capital stock of country j on the productivity growth of
country i. These studies rely on long time series and focus mainly on bilateral R&D spillovers between two or more countries, such as Japan and the US in Bernstein and Mohnen (1995). 3
For instance, Nadiri (1991) shows that the effects of an increase in US owned capital stock on the productivity
growth of manufacturing industries in France, Germany, Japan, and the UK, are positive and significant. An intermediate position is proposed by Cantwell (1989) who highlights that the impact of US FDI on European firms
3
4
The potential transfers of knowledge associated with inward FDI apparently have two directions. In the case of offshore production, the host country may benefit from technological externalities emanating from foreign companies. However, if foreign companies intend to copy or to source the domestic knowledge-base, their home country is more likely to benefit from potential spillovers. Technology sourcing practices are likely to be targeted towards technological leaders. These countries have accumulated substantial scientific and technological capabilities that are accessible to foreign companies which set up production and research facilities within their boundaries. There is empirical evidence supporting that the sourcing of foreign knowledge is a genuine practice firmly embodied in MNEs’ behavior. The pioneering studies focusing on technology sourcing are those by Kogut and Chang (1991) and Yamawaki (1993); who focus on Japanese FDI in the United States and Europe. Their main finding is that Japanese firms enter the U.S. and European markets by capturing existing local firms when Japanese parents suffer from a technological and/or comparative disadvantage as compared to their U.S. and European competitors. Furthermore, when entry is disaggregated by mode (e.g. new plant vs. acquisition of equity), the evidence indicates that joint ventures are used for the sourcing and the sharing of US technological capabilities. On the other hand, when Japanese parents possess technological comparative advantages, they choose to establish new plants in the United States or Europe.4
has not been beneficial in all industries. The US investments have contributed to growth only when domestic firms where already technologically strong. 4
In a similar vein, and focusing on European industries, Neven and Siotis (1993, 1996) observe that inward FDI
flows from the U.S. and Japan tend to be higher in those sectors where European technological intensity is higher than that of other industrialized countries.
4
5
Despite this evidence that technology sourcing is a substantial motive for investing abroad, there has been no attempt to evaluate the feedback effects of such practices on the productivity growth of the imitator country. In the next section we evaluate and compare the efficiency of three main channels of technology transfer: trade, inward FDI, and outward FDI. We believe that the latter serves as a measure of the extent of technology sourcing practices.
3. EMPIRICAL IMPLEMENTATION
A generalized version of the methodology employed in Coe and Helpman (1995), as modified by Lichtenberg and Van Pottelsberghe (1997), can be used to test whether trade, inward FDI, and outward FDI serve as channels for the international diffusion of technology. Because FDI flows data are scarce over the period 1971-90, we can investigate the role of FDI for only 13 out of the 22 industrialized countries originally covered by Coe and Helpman. The focus is on a sample comprised of the U.S., Japan, and eleven European countries (Luxembourg being associated with Belgium). Equation (1) is the basic econometric model; it states that the domestic total factor productivity of a country is a function of its domestic R&D capital stock and of different types of foreign R&D capital stocks: Log Fit = α i + α d log SDit + α f log SFit + ε it
(1a)
where i = 1,.., 13 is a country index; t = 1, ..., 20 is a time index; log F is the logarithm of total factor productivity; SD represents the domestic R&D capital stock; SF represents the foreign R&D capital stock; α i is a country-specific intercept; α d is the output elasticity of the domestic R&D capital stock; α f is the output elasticity of foreign R&D capital stock; and ε is the error term. The
5
6
data sources and the computation of the total factor productivity index are described in the appendix. In their basic specification, Coe and Helpman allowed the output elasticity of domestic R&D capital stock to differ between G7 and other countries by interacting the domestic R&D capital stock with a dummy variable that takes the value of one for G7 countries. We implement a similar test, but for all the exogenous variables : Log Fit = α i + α d log SDit + α d7 G7 log SDit + α f log SFit + α f7 G7 log SFit + ε it
(1b)
We adopt Lichtenberg and van Pottelsberghe’s procedure for constructing the three different foreign R&D capital stocks. The first one, the import-embodied foreign R&D capital stock, Sfm, is constructed as follows: S i fm =∑ j ≠i
mij S dj yj
,
(2)
where mij is the flow of imports of goods and services of country i from country j, which might be interpreted as embodied with the R&D intensity of country j; yjt being country j’s GDP.5 The second one, the foreign R&D capital stock embodied in inward FDI, Sff, is computed as follows: Siff =
fij
∑k j≠ i
S dj ,
(3)
j
where f ij is (the four-year moving average of) the flow6 of FDI from country j towards country i and k j is the gross fixed capital formation of country j, both expressed in constant dollars. We would 5
Cf. Lichtenberg and Van Pottelsberghe (1998) for the comparison of alternative weighting schemes for the
construction of the foreign R&D capital stock. Equation (2) is much less sensitive to potential aggregation biases than the weighting scheme proposed by Coe and Helpman (1995). When the two weighting scheme were nested, the data clearly favored equation (2). Coe and Helpman’s methodology has been challenged by Keller (1996) who finds that randomly created bilateral trade shares yield similar results. Keller’s evidence does not apply to our
6
7
prefer to specify FDI stocks rather than flows, in part because flows are much more volatile, but the construction of FDI stocks is rendered difficult by missing data and by the heterogeneous methodologies adopted in different countries.7 Use of four-year moving averages both reduces volatility and provides a solution to the missing-data problem. The hypothesis of technology sourcing is tested with the foreign R&D capital stock embodied in country i’s outward FDI: Sift =
t ij
∑k j ≠i
S dj ,
(4)
j
where t ij are the FDI flows of country i towards country j. Here, the foreign R&D capital stock of country i corresponds to the sum of all its outward FDI embodied in the R&D capital intensity of the target countries. Coe and Helpman already noticed that the various variables were clearly trended, as usual in total factor productivity studies. Attempting to estimate a long-term relationship with trended variables requires the error term to be stationary. If the error term is not stationary, the estimated relationship may be spurious. An alternative solution is to estimate the model based on a change specification (growth rate) rather than a level, as a significant number of growth studies do. However, a change specification leads to short run relationships (deviation from the long term relationship; see the discussion in Coe and Helpman, pp. 867-870). Two test statistics put forward by Levin and Lin
methodology, since we do not use bilateral trade shares in total imports and our weights are not constrained to sum to one. 6
Statistical data on FDI flows are more available than on stocks. In addition, the latter are not comparable across
countries, due to heterogeneous evaluation methods. 7
An alternative specification, with the GDP (y) instead of the gross fixed capital formation of country j, yields
similar results.
7
8
(1992, 1993) were used by the authors to test whether the estimated regression equation is cointegrated (i.e., whether the residual is stationary). Mixed results were obtained, the main equation being cointegrated according to Levin and Lin (1992) but not with Levin and Lin (1993). 8 Given that the econometrics of pooled cointegration were not fully worked out, Coe and Helpman placed ‘…more emphasis on consistency with the theoretical model and on the a priori plausibility of the estimated parameters than on the tests for cointegration.’ (p. 870). Important progress in the econometrics of cointegration for panel data have been made since the early 1990’s. Pedroni (1999) puts forward seven tests that are based on previous ones (such as Levin and Lin (1993) or Im, Pesaran and Shin (1996)). Four of these tests allow for country-specific cointegration dynamics. The seven tests were applied to the basic specification in level and in growth rates (first difference). The econometric estimates of equation (1a) are presented in Table 1, along with the various cointegration tests. The first four columns present within estimates and the next four, the firstdifferenced estimates. Regressions (i) to (iii) show the estimated output elasticities of domestic R&D and of the foreign R&D capital stock incorporated alternatively into one of the three alternative technology transfer channels. In each regression, the estimated elasticity of the domestic R&D capital stock is positive and significant. Regression (i) includes the foreign R&D capital stock embodied in trade flows. Although the focus is limited to 13 countries, the estimated output elasticity of the foreign R&D variable (.117) is very close to the estimates evaluated over 22 industrialized countries (.109) by Lichtenberg and Van Pottelsberghe (1997). *** Insert Table 1 *** 8
The test presented by Levin and Lin (1992) constrains the dynamics of the augmented Dickey-Fuller to be the
same across all countries, whereas the test in Levin and Lin (1993) allows the dynamics to differ across countries.
8
9
Regarding the impact of outside R&D embodied in inward FDI, regression (ii) shows that there are no significant international R&D spillovers. This suggests that inward FDI does not induce substantial technology transfers from the home country to the host country. One possible explanation would be that the MNEs’ aim when establishing subsidiaries abroad is certainly not to diffuse their own technological advantages towards the host country’s domestic firms, but rather to exploit more fully their own technological innovations. Hence the weak potential diffusion of technology in the host economy. This result is consistent with Dunning’s paradigm that companies may prefer to invest abroad in order to take advantage of their own technological base instead of diffusing it internationally. In regression (iii), the output elasticity of the foreign R&D capital stock embodied in outward FDI flows is positive and highly significant. That is, the hypothesis of technology sourcing is confirmed by our estimates. Through their investments abroad, MNE’s seem to be able to source foreign technology bases, thereby increasing the productivity of their home country. Regression (iv) includes the foreign R&D capital stocks embodied in trade and in outward FDI, simultaneously. The output elasticities of the foreign R&D variables associated with outward FDI and imports are both significant and their magnitudes are hardly affected, reinforcing the robustness of our results. The output elasticity of the domestic R&D capital stocks are smaller in regression (iv) than in regressions (i) to (iii). We may infer that not properly taking into account the effective channels of international R&D spillovers leads to upwardly biased estimates of the output elasticity of the domestic R&D capital stock. Most of the cointegration tests suggest that the regression equation is cointegrated. An interesting feature is that the ‘panel’ tests are more significant than the ‘group’ tests. This is not
9
10
surprising since the former take into account country-specific dynamism, whereas the latter constrain the cointegration parameter across countries.9 The first-differenced estimates (columns v to viii) broadly confirm the level estimates. The main difference is that the estimated parameters associated with the foreign R&D capital stocks are lower. All cointegration tests confirm that the error term is cointegrated. Table 2 investigates whether the estimated parameters were higher or lower in the 1970s than they were in the 1980s. It also investigates whether the estimated parameters are different for large industrialised countries (G7) than for smaller ones. Regression (i) is equivalent to regression (iv) in Table 2 for the whole period and regressions (ii) and (iii) present the econometric results for the seventies (1971 to 1980) and the eighties (1981 to 1990), respectively. From the seventies to the eighties, the impact of the R&D capital stock on productivity was stable, as opposed to the impact of foreign R&D capital stocks. International trade allowed economies to benefit from foreign R&D in both decades, but its role was much greater in the 1970s (7% in the eighties against 14% in the seventies). The reverse is true for outward FDI, which yielded an output elasticity of foreign R&D higher and substantially more significant in the eighties than it did in the seventies (the estimated parameter is –3.3%-- in regression (ii) and --5%-- in regression (iii)). The F-test confirms that a significant structural change took place between the two decades. From these figures we may infer that the practice of technology sourcing intensified over the last two decades, emerging overall during the eighties.
9
Unreported results, similar to those presented in regression (iv) of Table 1 but including time dummies lead to
the same cointegration tests. The main difference being a lower and marginally significant parameter associated with the domestic R&D capital stock. The inclusion of time dummies does not affect the output elasticity of the foreign R&D capital stocks.
10
11
*** Insert Table 2 *** Columns (iv) to (vii) of Table 2 show the results that allow all the output elasticities with respect to technology variables to differ between G7 and other countries. This is done by interacting the right-hand side variables with a dummy variable that takes the value of one for G7 countries. Regarding the output elasticities with respect to the domestic R&D capital stock and the foreign R&D embodied into outward FDI, it clearly appears that their impact is much higher for the G7 countries than for smaller countries. The reverse is true for the foreign R&D embodied into trade flows. Average rates of return to R&D may be obtained by dividing the estimated elasticities by the appropriate ratios of R&D capital stocks to GDP. Our calculations (based on the estimated elasticities of regressions (i) and (vii) of table 2) show that the average rates of return to domestic R&D capital stocks over the period 1971-90 were 68 percent in the G7 countries and 15 percent in the smaller countries. Concerning the rate of return to foreign R&D, the estimates suggest that a $100 increase in the foreign R&D capital stock of a particular country would increase its GDP by $813 through import flows and by $1656 through outward foreign direct investment. These very high values are due to the way the foreign R&D capital stocks are constructed. An increase of $100 of the foreign R&D capital stock would require a much larger increase of the foreign countries’ domestic R&D capital stock since they are weighted by their GDP and embodied in the flows of imports and/or outward FDI. We may compute two matrices of bilateral elasticities of output with respect to foreign R&D from the estimated parameters of regression (i) of Table 2. In the case of import-embodied spillovers, the elasticity of country i’s output with respect to country j’s domestic R&D capital stock, α ijfm, may be expressed as follows:
11
12
α ijfm =
d ∂ log yi ∂ log yi ∂ log Sifm ∂ log Sifm ∂ Si fm Sj fm fm = ⋅ = α ⋅ = α ⋅ ⋅ i i ∂ log Sjd ∂ log Sifm ∂ log Sjd ∂ log S dj ∂ S dj Sifm
(5) and since the foreign R&D capital stock depends on the domestic R&D capital stock of each other country:
Si
fm
=
∑
mij S dj
,
yj
j
equation (5) becomes: α
fm ij
=α
fm i
⋅
mij yj
⋅
S dj S ifm
=α
fm
⋅
mij yj
⋅
S dj Si fm
(6)
Therefore, the elasticity of country i’s output with respect to country j’s domestic R&D capital stock is an increasing function of its imports from country j, and of country j’s intensity in R&D. The computed bilateral elasticities for the two channels of R&D spillovers--imports and outward FDI--are presented in Table 3. The figures in Table 3 indicate, for example, that a one percent increase in the US R&D capital stock raises Japanese output by .0272 percent through trade flows and by .0274 percent through the Japanese outward FDI in the US. On the other hand, a one percent increase in the Japanese R&D capital stock raises US output by .0120 percent through trade flows and by only .0005 percent through US outward FDI in the Japanese economy. Technology transfers are indubitably more intense from the US to Japan than the other way round. When the channel of import flows is considered, we do not find weaker diffusion of Japanese technology with any other country. However, when the channel of technology sourcing is considered, Japanese R&D benefits other countries less than Japan benefits from foreign technology bases. *** Insert Table 3 *** 12
13
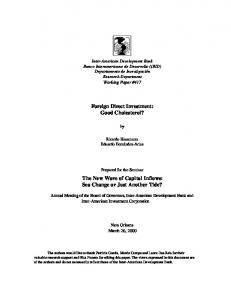
The mean ‘international’ impact of each country’s R&D capital stock is illustrated in the bottom rows. A one percent increase in the US (Japanese) R&D capital stock induces a .020 (.008) percent increase of foreign output through trade flows and an increase of .021 (.000) percent through outward FDI in the USA (Japan). For some countries, the impact of other countries’ domestic R&D capital stock is greater through technology sourcing than through import flows. The U.S. R&D capital stock benefits Germany, France, the UK, Greece, and Japan more through their outward investments into the US boundaries than through their imports from the U.S. On average, considerable technological feedbacks are observed through outward FDI directed towards the U.K. and the U.S. Germany, France, Belgium, and The Netherlands are also “techno-sourced” but to a smaller degree than the U.S. and the U.K. The last column shows the average domestic output elasticity of foreign R&D for each country. The domestic output elasticity of foreign R&D embodied in trade flows is the highest in Ireland (2.9%), The Netherlands, Portugal, and Belgium. It is the lowest in the US (.64%) and Greece. Other countries where import-embodied foreign R&D is associated with a relatively high elasticity are the U.K. (2%) and Japan (1.8%). Considering the alternative channel of international technology transfer, Japan and the U.K. benefit the most from outward FDI: their output elasticities are the highest (about 1.8%). In contrast, the potential technology embodied in outward FDI contributes only marginally to the productivity of Portugal, Italy, the U.S., and Denmark. These results may be compared with those obtained in the existing empirical literature, which were summarized in Mohnen (1996). A first observation was that foreign R&D contributes to productivity growth more in small countries than in large countries. *** Insert Figure 1 ***
13
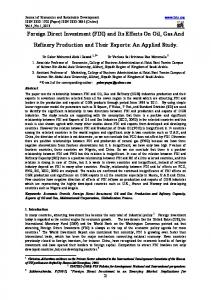
14
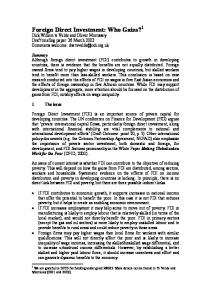
Figure 1 clearly shows that it depends on the channel considered. The output elasticity of foreign R&D embodied in imports is, indeed, generally higher in smaller countries. Some exceptions show up, characterized by the relatively weak elasticities in Greece and Denmark, and the relatively high elasticities in the U.K. and Japan. If the focus is put on the technology sourcing channel, there is no evidence that the foreign R&D embodied in outward FDI benefits more or less the small countries. Figure 2 demonstrates that the larger a country is, the greater the relative impact of its technology sourcing activities, as compared to the impact of import-embodied foreign R&D. *** Insert Figure 2 *** A second “stylized fact” cited in Mohnen (1996) was that the output elasticity of foreign R&D is higher than the output elasticity of domestic R&D. The last row and the last column of Table 4 confirm this statement is true for the smallest countries: smaller countries all have an aggregate output elasticity of foreign R&D much larger than their output elasticity of domestic R&D. But the reverse is true for large countries, even if the output elasticity of foreign R&D embodied in imports is added to the output elasticity of foreign R&D embodied in outward FDI flows. The third observation was that the US is an important R&D spillover-generator but a weak spillover-receiver, and that the spillovers emanating from Japan are weak, if not nonexistent. Our results for the U.S. are consistent with the findings of previous studies: the U.S. appears to benefit less from foreign R&D than other countries benefit from U.S. R&D (see Figure 1 and Figure 3). One’s assessment of Japan’s “technology trade balance” depends on the channel of international technology flows considered. Through trade flows Japan does substantially contribute to foreign productivity, to the same extent that it benefits from outside R&D. However, there is no R&D spillover emanating from outward FDI directed towards Japan, whereas the foreign R&D embodied in Japanese outward FDI contributes to improve its productivity to the same extent than the foreign
14
15
R&D embodied in its imports does. Concerning outward FDI in the large European countries, Germany and France seem similar to Japan: they benefit more from their own outward FDI abroad than the rest of the world benefits from its outward FDI directed towards them. The U.K. is much more similar to the U.S., in the sense that the benefits it receives from outside R&D are roughly equal to the benefits its R&D confers on the rest of the world, through the channel of technology sourcing.
*** Insert Figure 3 ***
4. CONCLUDING REMARKS
We used Coe and Helpman’s framework, as modified by Lichtenberg and Van Pottelsberghe, to test whether inward and outward FDI are effective in the international diffusion of technology. The empirical results showed that outward FDI flows and import flows are two simultaneous channels through which technology spills over and benefits other industrialized countries. We therefore give credence to the hypothesis of technology sourcing associated with MNEs’ activities abroad, and confirm Dunning’s (1994) expectation that ‘...where foreign production adds to domestic production, the R&D base of the investing company is strengthened - whatever the nationality of the firm.’. Contrary to frequent conjectures, inward FDI flows do not seem to contribute to the improvement (or to the reduction) of the technological base of host economies. Our results suggest that inward FDI, on average, take on the characteristics of a ‘Trojan horse’; they are intended more to take advantage of the technology base of the host countries than to diffuse the technological advantage originating in the home country. This ‘technological boomerang’ feature emerged mainly during the eighties.
15
16
We also found that the ratio of foreign-R&D benefits conveyed by outward FDI to foreignR&D benefits conveyed by imports is higher for large countries than it is for small ones, and that failure to account for international R&D spillovers leads to upwardly biased estimates of the output elasticity of the domestic R&D capital stock. Finally, it is widely believed that the US is an important R&D spillover-generator but a weak spillover-receiver, whereas Japan benefits a lot from outside R&D and the R&D spillovers emanating from its boundaries are weak, if not nonexistent. Our results all too amply corroborate the picture for the US. Concerning Japan, it depends on the channel considered. Japan contributes to international output growth through its exports, but there is no R&D spillovers emanating from outward FDI directed towards Japan.
16
17
References
Bernstein J.I., and P. Mohnen, 1995, «International R&D spillovers between U.S. and Japanese R&D intensive sectors», NBER Working Paper, N° 4682.
Cantwell J., 1989, «Technological innovation and multinational corporations», Oxford and cambridge, Mass., Basil Blackwell.
Coe D. T., and E. Helpman, 1995, «International R&D Spillovers», European Economic Review, 39, pp, 859-887.
Dunning J.H., 1994, «Multinational enterprises and the globalization of innovatory capacity», Research Policy, Vol. 23, p. 67-88.
Im, Pesaran and Shin, 1996, «Testing for unit root in heterogeneous panels», Discussion Paper, University of Cambridge, June.
Kogut B., Chang S.J., 1991, «Technological capabilities and Japanese foreign direct investment in the United States», The Review of Economics and Statistics, Vol. 73, pp. 401-413.
Keller W., 1996, Are international R&D spillovers trade-related? Analyzing Spillovers among randomly matched trade partners, University of Wisconsin-Madison, miméo.
17
18
Levin A. and C. Lin, 1992, «Unit root tests in panel data: Asymptotic and finite-sample properties», University of California, San Diego Discussion Paper, December.
Levin A. and C. Lin, 1993, «Unit root tests in panel data: New results», University of California, San Diego Discussion Paper, May.
Lichtenberg F., and B. Van Pottelsberghe de la Potterie, 1998, «International R&D Spillovers: A comment», European Economic Review, Vol. 42, N° 8.
Mohnen P., 1996, «Some Estimates of International R&D Spillovers», Université du Québec à Montréal, January, 23p.
Nadiri M.I., 1991, «U.S. direct investment and the production structure of the manufacturing sector in france, germany, Japan, and the U.K.», NBER Working Paper Series - September.
Neven D., Siotis G., 1993, «Foreign direct investment in the European Community: some policy issues», Oxford Review of Economic Policy, Vol. 9, N°2, pp. 72-93.
Neven D., and Siotis G., 1996, «Technology sourcing and FDI in the EC: an empirical evaluation», International Journal of Industrial Organization, Vol. 14, pp. 543-60.
Pedroni P., 1999, «Critical values for cointegration tests in heterogenous panels with multiple regressors», Oxford Bulletin of Economics and Statistics, 61(1), pp. 653-670.
18
19
Soete L., and Patel P., 1985, «Recherche-développement, importations technologiques et croissance économique», Revue Economique, 36(5), pp. 975-1000.
Yamawaki H., 1993, «International competitiveness and the choice of entry mode: Japanese multinationals in US and European manufacturing industries», A CEPR Workshop, Oxford. 12-13 November, 28p.
19
20
Appendix: Data sources and definitions
The total factor productivity index F comes from Coe and Helpman (1995, Table A.1); it is defined as F = Y / [Kβ L(1-β)], where Y is value-added in the business sector, K is the stock of business sector capital, and L is employment in the business sector. All variables are constructed as indices with 1985=1. The coefficient β is the average share of capital income from 1987-89. See Coe and Helpman for a detailed description of the other data sources.
The estimates of domestic business sector R&D capital stocks (lagged one year) are described in Coe and Helpman (p. 878). We have reestimated the value of the domestic R&D capital stocks from the indices provided in Table A.3 of Coe and Helpman and the value of the stock in 1990, provided in their Table A.7. The domestic R&D capital stocks are in US dollars, based on PPP’s and in constant 1985 prices.
The three different foreign R&D capital stocks have been computed from the domestic R&D capital stock of each country. The formulas are presented in the text. The GDP and the Gross Fixed Capital Formation for each country comes from the OECD’s Main Economic Indicators. For Israel, the GDP data are from the IMF’s Statistical Yearbook. Bilateral imports flows, in constant 1985 prices, were used for each year, from 1971 to 1990 based on data from the United Nation’s International Trade Statistics Yearbooks (Coe and Helpman used data from the IMF’s Direction of Trade). The ratios of the imports of goods and services to GDP (both in current price) come from Coe and Helpman’s table A6 and are from the IMF’s Direction of Trade. National total inward and outward Foreign Direct Investments flows come from three OECD publications: Recent Trends
20
21
in International Direct Investment (1981, 1987) and the International Direct Investment Statistics Yearbook 1993. They are deflated in constant 1990 price (GDP deflator). In order to avoid sharp yearly fluctuations, the series of inward and outward FDI flows have been computed within a four years moving average framework (the average of the present and the three preceding years). There are no complete time series of bilateral inward FDI flows over the period 1970-90.
We have computed two bilateral inward FDI shares matrices (representing for each country the distribution of inward FDI over the origin countries), one for the 70’s and one for the 80’s from the available data provided by the OECD publications during the two decades. We used these shares to estimate the yearly bilateral inward FDI flows from the total inward FDI flows described here above. From 1970 to 1975, the 70’s weighting matrix has been used. From 1985 to 1990, the 80’s weighting matrix has been used. For each year during the period 1975-1985, we assumed a constant yearly rate of growth of each weighting components of the 70’s matrix to the corresponding components of the 80’s matrix. Since these weighting components have sometimes weak negative values, we have set all negative values to zero, because the stock of foreign R&D may be zero but not negative. The bilateral outward FDI flows are the transposed of the bilateral inward FDI flows, for each country and each year.
21
22
TABLE 1. - TOTAL FACTOR PRODUCTIVITY ESTIMATION RESULTS - TRADE, INWARD FDI, AND OUTWARD FDI, 1971-90, 260 OBSERVATIONS1.
(iv)
(v)
First difference (vi) (vii)
(viii)
.054*
.017*
.050*
.081*
.062*
.030
(.008)
(.008)
(.020)
(.020)
(.020)
(.019)
.154*
.100*
.067*
.069*
(.012)
(.010)
(.013)
(.013)
(i)
(ii)
.045*
.138*
(.010)
(.009)
Within (iii)
Domestic R&D
log S d Foreign R&D
log S fm (imports)
log S ff (inward FDI)
-.006
.006
(.005)
(.004)
log S ft (outward FDI)
R2 -adjusted SSR F-test
.072*
.053*
.039*
.040*
(.005)
(.004)
(.009)
(.009)
.779 .457 62.2*
.628 .771 30.2*
.805 .403 72.7*
.857 .295 98.6*
.147 .175 22.3*
.063 .192 9.3*
.120 .181 17.8*
.213 .161 23.2*
Panel v-statistic Panel ρ-statistic Panel t-statistic A Panel t-statistic B
4.37* -1.74* -2.93* -2.91*
2.63* -1.92* -3.79* -3.99*
3.50* -0.87 -1.97* -1.74*
3.21* -0.21 -1.97* -2.13*
9.02* -4.80* -7.86* -8.48*
7.14* -3.57* -6.01* -6.64*
7.08* -3.63* -6.09* -6.38*
5.57* -2.42* -6.45* -7.40*
Group ρ-statistic Group t-statistic A Group t-statistic B
-0.27 -2.62* -2.62*
-0.25 -3.08* -3.41*
0.59 -1.42 -1.25
1.20 -1.62 -2.16*
-3.41* -9.52* -10.89*
-2.25* -7.30* -8.28*
-2.30* -7.27* -7.76*
-1.06 -7.55* -9.65*
Cointegration tests 2
Notes: 1. The dependent variable is log (total factor productivity), indexed as 1985=1. Unreported country specific fixed effects (within estimates). Standard errors between brackets. S d = domestic R&D capital stock; S fm = foreign R&D capital stock embodied in imports; S ff = foreign R&D capital stock embodied in inward FDI; S ft = foreign R&D capital stock embodied in outward FDI ; G7 = dummy variable equal to 1 for the G7 countries and equal to zero otherwise. * indicates the paramet ers that are significant at the 10% probability level. 2. The cointegration tests reject the null hypothesis of no cointegration above the absolute value of 1.64 (10% probability threshold); 1.96 (5%) or 2.57 (1%). The panel t-statistic A is nonparametric, whereas the B, which corresponds to Levin and Lin (1993) is parametric. All the panel cointegration statistics are reported in Pedroni (1998), Table 1.
22
23
TABLE 2. - TIME AND COUNTRY STABILITY OF THE OUTPUT ELASTICITIES OF FOREIGN R&D.1
‘71-‘90 (i)
Time stability ‘71-‘80 ‘81-‘90 (ii) (iii)
Larger countries (iv)
(v)
(vi)
(vii)
Domestic R&D
log S d
.017*
.037*
.037*
.020*
.089*
.056*
.008
(.008)
(.014)
(.022)
(.010)
(.010)
(.009)
(.009)
.176*
.193*
.063*
.079*
(.022)
(.018)
(.023)
(.022)
d
log S * G7 Foreign R&D
log S fm (imports)
.100*
.136*
.071*
.152*
.134*
(.010)
(.015)
(.016)
(.016)
(.014)
-.069*
-.088*
(.022)
(.020)
fm
log S * G7 ft
log S (inward FDI)
-.001 (.007)
ff
log S * G7
-.001 (.009)
ft
log S (outward FDI)
.053*
.033*
.050*
.046*
.029*
(.004)
(.010)
(.009)
(.007)
(.006)
.021*
.032*
(.010)
(.009)
.829 .352
.878 .249
ft
log S * G7
R2 -adjusted SSR F-test: struct. change
.857 .295
.951 .080
.715 .080
.828 .353
.747 .520
107*
1. The dependent variable is log (total factor productivity); the right-hand side variables are S d = the domestic R&D capital stock, S fm = the stock of foreign R&D embodied in imports, S ft = the stock of foreign R&D embodied in outward FDI; all regressions include unreported country dummies. Standard errors between parentheses, and * indicates that the parameter is significantly different from zero at a 10 percent probability threshold.
23
24
TABLE 3. - INTERNATIONAL OUTPUT ELASTICITIES OF DOMESTIC R&D CAPITAL STOCKS, 1971-90 Import flows GER GER FRA ITA UK BEL DK GRC IE NTH PT SP USA JAP
.0200 .0211 .0211 .0584 .0326 .0241 .0110 .0555 .0273 .0126 .0052 .0027
FRA ITA .0145 .0049 .0047 .0147 .0116 .0031 .0380 .0044 .0067 .0022 .0087 .0061 .0061 .0016 .0153 .0033 .0188 .0063 .0102 .0029 .0023 .0010 .0013 .0004
UK .0151 .0124 .0089 .0361 .0256 .0113 .1105 .0282 .0304 .0108 .0074 .0025
BEL .0068 .0067 .0032 .0048 .0036 .0028 .0020 .0204 .0046 .0016 .0007 .0003
DK .0008 .0003 .0004 .0011 .0005 .0005 .0004 .0008 .0005 .0002 .0001 .0001
GRC .0000 .0000 .0000 .0000 .0000 .0000 .0000 .0000 .0000 .0000 .0000 .0000
IE .0002 .0001 .0001 .0011 .0003 .0001 .0001 .0003 .0001 .0001 .0001 .0000
NTH .0159 .0062 .0058 .0117 .0460 .0091 .0073 .0051 .0088 .0028 .0011 .0004
PT .0001 .0001 .0000 .0002 .0001 .0001 .0000 .0001 .0001 .0001 .0000 .0000
SP .0003 .0005 .0003 .0004 .0004 .0002 .0003 .0002 .0004 .0027 .0001 .0000
USA .0142 .0124 .0104 .0248 .0221 .0132 .0084 .0273 .0284 .0246 .0161
JAP .0041 .0022 .0013 .0048 .0036 .0037 .0067 .0035 .0038 .0045 .0025 .0118
Average
.0001 .0000 .0000 .0000 .0000 .0000 .0000 .0000 .0001 .0000 .0000 .0005
.0272
.0127 .0115 .0103 .0198 .0258 .0142 .0098 .0289 .0264 .0218 .0126 .0064 .0183
Outward FDI flows GER FRA ITA UK BEL DK GRC IE NTH PT SP USA JAP
.0000 .0001 .0023 .0003
.0004 .0000 .0000
.0002 .0000
.0274
.0135 .0108 .0071 .0185 .0079 .0077 .0137 .0105 .0143 .0033 .0086 .0076 .0183
Average foreign output elasticity of domestic R&D capital stock Imports .0108 .0061 .0020 .0093 .0026 .0003 .0000 .0001 .0047 Outward .0023 .0027 .0005 .0158 .0012 .0001 .0000 .0001 .0015
.0000 .0000
.0002 .0002
.0198 .0078 .0206 .0003
.096 .035
.0032 .0048 .0009 .0042 .0039 .0038 .0001 .0013 .0025 .0038 .0024 .0010
.0037 .0007 .0011 .0119 .0016 .0002 .0054 .0008 .0027 .0002 .0021 .0009 .0006 .0002 .0020 .0003 .0130 .0012 .0036 .0014 .0021 .0005 .0005 .0001
.0053 .0110 .0045 .0103 .0178 .0053 .0177 .0063 .0117 .0099 .0268 .0036
.0022 .0023 .0019 .0004 .0006 .0000 .0006 .0012 .0027 .0023 .0011 .0003
.0001 .0001 .0000 .0000 .0000 .0000 .0000 .0000 .0000 .0000 .0001 .0000
.0000 .0000 .0000 .0000 .0000 .0000 .0000 .0000 .0000 .0000 .0000 .0000
.0001 .0000 .0000 .0000 .0000 .0000 .0000 .0000 .0000 .0000 .0001 .0000
.0020 .0008 .0001 .0015 .0041 .0002 .0002 .0002
.0000 .0000 .0000 .0000 .0000 .0000 .0000 .0000 .0000
.0003 .0003 .0006 .0001 .0002 .0001 .0000 .0001 .0002 .0023
.0198 .0150 .0091 .0284 .0103 .0092 .0219 .0149 .0228 .0017 .0120
FDI
.0131 .0088 .0025 .0251 .0038 .0004 .0000 .0002 .0062 .0001 .0004 .0404 .0081 .128 Estimated elasticity of output in the row country with respect to the R&D capital stock in the column country. Based on regression (iv) of Table 1 and on equation (6). Averages in the bottom rows are calculated using GDP weights. Averages in the last column are calculated using domestic R&D capital stocks as weights. Sum
24
25
FIGURE 1. - DOMESTIC OUTPUT ELAST ICITIES OF FOREIGN R&D EMBODIED IN IMPORTS AND IN OUTWARD FDI
Output elasticities
0,04
R&D-imports 0,03
Techno-sourcing
0,02
0,01
0,00 I E
P T
G R C
D K
B E L
N T H
S P
I T A
U K
F R A
G E R
J A P
U S A
Countries Source: cf. Table 3; last column. The countries are ordered according to their GDP size.
FIGURE 2. - THE RELATIVE IMPORTANCE OF EACH CHANNEL, BY COUNTRY
100% Techno-sourcing
80%
R&D-imports
60% 40% 20% 0% I E
G R C
B E L
S P
U K
G E R
U S A
countries Source: derived from Table 3; last column. The countries are ordered according to their GDP size.
25
26
FIGURE 3. - HOW DOMESTIC R&D CONTRIBUTES TO INTERNATIONAL PRODUCTIVIT Y GROWTH (A VERAGE FOREIGN OUTPUT ELASTICITY OF DOMESTIC R&D, BY COUNTRY)
0,025 R&D-exports
elasticities
0,020
Techno-sourced 0,015 0,010 0,005 0,000 I E
P T
G R C
D K
B E L
N T H
S P
I T A
U K
F R A
G E R
J A P
U S A
countries Source: cf. Table 3, bottom rows. The countries are ordered according to their GDP size.
26