human capital development and economic growth has been widely researched ... led to a positive impact on economic growth in. Mexico. ... that FDI outflow from Italian firms, low income and ...... Deyo, F.C. (1989) 'Beneath the miracle: Labour.
Risk governance & control: financial markets & institutions / Volume 5, Issue 3, 2015
DOES HUMAN CAPITAL DEVELOPMENT MATTER IN FDI LOCATION DECISIONS? A CASE FOR AUSTRIA Kunofiwa Tsaurai* Abstract This paper investigates the relationship between human capital development and foreign direct investment (FDI). In particular, the direction of causality between these two variables is the main focus of this study. This study has been necessitated by the failure by many previous researchers to concur on the causal relationship between FDI and human capital development. Some authors argue that there is a uni-directional causality relationship running from FDI to human capital development whilst others are saying the causality runs the other way round from human capital development to FDI. The other group of authors says there is a bi-directional relationship between these two variables whilst the fourth and last group of authors maintains that there exist no causal relation at all between FDI and human capital development. Using the lagged error correction model (ECM), the study observed that FDI measured by FDI, net inflows (% of GDP) was Granger caused by human capital development (proxied by pupil-teacher ratio) both in the short and long run. However, the null hypothesis which says that FDI Granger caused human capital development was rejected both in the short and long run. The author therefore recommends the intensification of teacher-pupil ratio improvement programmes in order not only to increase FDI inflow but to ensure Austria benefits from that increased FDI inflow. Keywords: Human Capital; FDI; ARDL; ECM; Austria * Department of Finance, Risk Management and Banking, University of South Africa, P.O. Box 392, UNISA, 0003, Pretoria, South Africa
1 Introduction Despite the fact that the relationship between FDI, human capital development and economic growth has been widely researched thus far, the clear cut causality relationship between these variables is still far from being established. According to Tavares and Teixeira (2006), FDI and human capital are beyond any reasonable doubt two of the major factors that that influences economic performance. This was shared by Tanna and Topaiboul (2005) whose studies revealed that the interaction of FDI and human capital led to a positive impact on economic growth in Mexico. Noorbakhsh et al (2001) discovered that the positive impact of human capital development on FDI inflow was statistically significant whilst the same study also revealed that the level of human capital determined to a large extent the regional distribution of FDI in developing countries. Developing countries could easily attract FDI by pursuing policies that boost human capital development, argued Noorbakhsh et al (2001). Lucas (1990), Dunning (1988) and Zhang and Markusen (1999) are some other empirical researchers whose studies supports the human capital development –led FDI hypothesis. Ramasamy and Yeung (2010) however argued that low cost labour force attracted FDI inflow in inland
areas in the short run only. Axarloglou (2004) also revealed that FDI inflows into the U.S states were attracted by high quality of labour force, high labour productivity and spending on education. On the other hand, Elia et al (2009) found out that FDI outflow from Italian firms, low income and high income in general negatively affected the demand of low skilled personnel. The same study by Elia et al (2009) further revealed that FDI inflow into high income countries in general also negatively affected the demand of highly skilled workforce because foreign firms bring along the highly computerized equipment that does not rely on human power to function. Velde and Xenogiani (2007) suggested that FDI inflow raise the skills levels in the host countries which are well endowed with skilled personnel. Host countries whose skills level is low cannot fully enjoy the human capital development related advantages of FDI inflow, argued Velde and Xenogiani (2007). Although FDI and human capital have so far been widely researched and has got rich literature, the direct causal relation between the two variables is one of the least studied areas thus far (Tavares and Teixeira, 2006).This study is responding to a relative scarcity of the literature on the direct causality relationship between FDI and human capital development. Moreover, the study chose Austria, an
26
Risk governance & control: financial markets & institutions / Volume 5, Issue 3, 2015
under-researched country in terms of multi-national activities. No similar study has so far been done for Austria to the best of the author’s knowledge. The other parts of this study are structured as follows: Part 2 dwells on reviewing related literature whilst part 3 gives an overview of FDI and human capital development in Austria. Part 4 deals with the research methodology whereas part 5 provides the conclusion of the study. Part 6 is the bibliography list. 2 Related literature According to Dunning (1977) and Michie (2001), human capital is one of the locational advantages that play a bug role in as far as influencing FDI location decisions is concerned. Dunning (1988) weighed in by indicating that education level along with quality of the labour force constitute a vital force that attract FDI and influence the activities of multinational enterprises in general. Human capital development –led FDI, FDI –led human capital development, feedback view also known as the bi-directional view and the no relationship perspectives are the four views that are found in literature which explains the relationship between FDI and human capital development. These perspectives are explained next in detail. Human capital development –led FDI perspective is supported by Ozyigit and Eminer (2011), Wang and Wong (2011), amongst others. Using the bounds test approach, Ozyigit and Eminer(2011) revealed a strong uni-directional causality relationship running from human capital development to FDI and economic growth in the long run in Turkey.The same study also found out that human capital development and gross national product per capita jointly had a positive impact on FDI IN Turkey. However, the trivariate framework by Ozyigit and Eminer (2011) showed that both FDI and human capital development jointly positively impacted on economic growth in Turkey. Wang and Wong (2011) discovered that both quality and quantity of education was of paramount importance in attracting FDI. However, Wang and Wong (2011) found out that the minimum threshold level of level of education that is needed for FDI inflows was found to be much lower as compared to the one by Borensztein et al (1998). The high quality of education reduces the minimum threshold level of quantity of education required to enable inward FDI to have a positive impact on economic growth (Wang and Wong, 2011). Using the panel data fixed effect model, Suliman and Mollick (2009) discovered that literacy levels and freedom (political and civil rights) were instrumental in attracting FDI into all the 29 SubSaharan countries that were part of the study for the period 1980 to 2003. On the contrary, the same study by Suliman and Mollick (2009) revealed that war events negatively affected FDI in sub-Saharan Africa. In a study on firms located in Portugal, Tavares and Teixeira (2006) found out results that are consistent
with the human capital development –led FDI hypothesis. According to Lan et al (2012), the extent to which FDI impact on pollution emissions in the Chinese provinces was found to have been largely influenced by the level of human capital development. Higher levels of human capital development was found to be associated with low pollution emissions throughout all the Chinese provinces, argued Lan et al (2012). According to Ford et al (2008), FDI had a positive impact on the economic performance only in United States (US) that met a certain minimum threshold of human capital development. In other words, those US states that could not meet the minimum threshold levels of human capital development received FDI whose impact on economic growth was very minimal, argued Ford et al (2008). The same study by Ford et al (2008) also concluded that highly trained workforce in the US states enabled firms to easily take advantage of foreign technology and allowed the economic beneficiation from the availability of foreign technology by developed nations as a whole. Using stochastic frontier analysis, Mastromarco and Ghosh (2009) discovered that the level of human capital development played a huge part in ensuring the efficiency of FDI, imported capital goods and research and development in 57 developing countries that were part of the study. However, Kottaridi and Stengos (2010) using the non parametric techniques showed that the causality relationship between FDI and human capital is non-linear in OECD and non OECD countries. Empirical studies that are consistent with the FDI –led human capital development include those undertaken by Tavares and Teixeira (2005), Majeed and Almad (2008), amongst others. Using data from a sample of firms, Tavares and Teixeira (2005) concluded that foreign ownership of firms increases firms’ human capital intensity ratio both in terms of general education and specific skills. The same study by Tavares and Teixeira (2005) showed that research and development accelerate the rate at which FDI positively impact on human capital development. According to Majeed and Almad (2008), multinational enterprises bring along new skills, state of art new technology, education and training. Noorbakhsh et al (2001) argued that FDI is a source for skills acquisition, technology, organizational and managerial practices and finally a means to access the international markets. A study by Ge (2006) showed that FDI inflows significantly boosted the level of wages in the Chinese urban areas indirectly through its positive impact on human capital development. The same study by Ge (2006) explained that the different quantities of FDI received by different Chinese urban areas were behind wage differentials in Chinese cities. According to Ramasamy and Yeung (2010), FDI inflow led to an upward movement of wages and
27
Risk governance & control: financial markets & institutions / Volume 5, Issue 3, 2015
productivity in coastal areas whereas the opposite was true for FDI inflow into inland areas. Reiter and Steensma (2010) however argued that FDI inflow strongly enhances human capital development in circumstances where the host country has got FDI policy that restricts foreign firms from investing in certain sectors of the economy. Moreover, the same study by Reiter and Steensma(2010) showed that there is a high probability of FDI positively impacting on human capital development if corruption level is very low in the host country. Reiter and Steensma (2010) further argued that if foreign investors are given free reign in the host country, the possibility of FDI inflow positively influencing human capital development will depend on foreign investors’ commitment towards development of human capital. Figini and Gorg (2011) on the other hand revealed the existence of a non-linear relationship between FDI and wage inequality in developing countries. FDI inflow led to an increase in wage inequality but the wage inequality became smaller and smaller as more FDI inflows into developing countries. On the contrary, FDI inflow into developed countries resulted in lower wage inequality. Lipsey and Sjoholm (2001) and Girma and Gorg (2007) argued that the decrease in wage differentials among the employees as a result of FDI inflow in the long run in developing countries and in both short and long run in developed countries makes the workforce happy. This leads to an increase in productivity among the workforce. The feedback perspective says that FDI and human capital development affect each other. Previous studies that support the feedback view were undertaken by Blomstrom and Kokko (2002), amongst others. Blomstrom and Kokko (2002) found out the existence of a bi-directional causal relation between FDI and human capital development. FDI inflow into the host country increases the skills level of the local workforce whilst an increase in human capital attract technology intensive multinational enterprises and this could in turn lead to further development of high quality labour force, argued Blomstrom and Kokko (2002). The fourth perspective maintains that there is no relationship at all between human capital development and FDI both in the short and long run. Studies that support this view were done by Deyo (1989), Ritchie (2002), Root and Ahmed (1979),Schneider and Frey (1985), Hanson (1996) and Narula (1996), amongst others. Deyo (1989) and Ritchie (2002) both concur that it is only recently where FDI location decisions now take into account the quality of the labour force. In the 1960s and 1970s, size of the market, abundance of raw materials and cheap labour were the key determinants of FDI location decisions whilst the quality of labour force was remotely considered during this time period (Deyo, 1989); Ritchie, 2002); and Dunning, 2002).
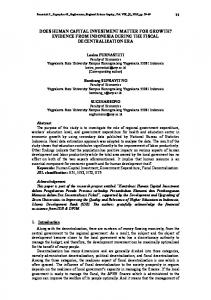
Earlier on, Root and Ahmed (1979) using proxies of human capital such as literacy rate, school enrolment and technical and professional workers’ availability discovered no significant relationship between human capital development and FDI in 58 developing countries. Moreover, Schneider and Frey (1985) showed that secondary education had a very insignificant impact on FDI as compared to economic and political variables in all the 54 developing countries that were part of the study. Other studies that discovered an insignificant role of human capital on FDI location decisions in developing countries were undertaken by Hanson (1996) and Narula (1996). 3 Human capital development and FDI trends in Austria According to World Bank (2014), both pupil-teacher ratio (secondary) and FDI, net inflows declined during the period 1981 to 1985. The former declined by 14.16%, from 13.69 in 1981 down to 11.75 in 1985 whilst the latter plummeted from US$327.520 million in 1981 to US$173.106 million in 1985 (see Figure 1 & 2). Pupil-teacher ratio (secondary) declined by 15.20% between 1985 and 1990 before experiencing another mere 5.63% decline during the period 1990 to 1995. In 1985, pupil-teacher ratio (secondary) was 11.75, went down to 9.96 in 1995 before settling at 9.40 in 1995. On the other hand, FDI, net inflow increased by a massive 277.35%, from US$173.106 million in 1985 to US$653.220 million in 1990 before registering another significant increase of 190.94% during the next subsequent five year period ranging between 1990 and 1995 (see Figure 1&2 ). In addition, the time frame between 1995 and 2005 generally saw both pupil-teacher ratio (secondary) and FDI, net inflows on an increasing trend. Whilst pupil-teacher ratio (secondary) went up by just 9.75% during the 1995 to 2000 five year time frame (from 9.4 in 1995 to 10.32 in 2000), FDI, net inflow massively grew by 348.59% during the same time frame. In other words, FDI, net inflow grew from US$1.9 billion in 1995 to US$8.525 billion in 2000, representing a 348.59% growth. The next five year period saw FDI, net inflow going up by an unprecedented 853.48%, from US$8.525 billion in 2000 to US$81.288 billion in 2005 whilst pupilteacher ratio (secondary) increased by 6.43% (from 10.32 in 2000 to 10.98 in 2005) during the same time frame. However, the period 2005 to 2010 saw FDI, net inflows plummeting by 131.13%, representing a significant decline from US$81.288 billion 2005 to a negative of US$25.304 billion in 2010 before experiencing a rebound to close off the year 2012 at FDI, net inflow of US$1.015 billion (refer to Figure 1&2). .
28
Risk governance & control: financial markets & institutions / Volume 5, Issue 3, 2015
Figure 1. Pupil-teacher ration, secondary for Austria between 1981 to 2012
16,00 14,00 12,00 10,00 8,00 6,00 4,00 2,00
1981 1982 1983 1984 1985 1986 1987 1988 1989 1990 1991 1992 1993 1994 1995 1996 1997 1998 1999 2000 2001 2002 2003 2004 2005 2006 2007 2008 2009 2010 2011 2012
-
Pupil-teacher ratio, secondary
100,00
14,00
80,00
12,00
60,00
10,00 40,00 8,00 20,00 6,00 -
4,00 2,00
-20,00
-
-40,00
Pupil-teacher ratio, secondary Source: World Bank (2014)
29
Foreign direct investment, net inflows (US$ Billions)
16,00
1981 1982 1983 1984 1985 1986 1987 1988 1989 1990 1991 1992 1993 1994 1995 1996 1997 1998 1999 2000 2001 2002 2003 2004 2005 2006 2007 2008 2009 2010 2011 2012
Pupil -teacher ratio, secondary)
Figure 2. Foreign direct investment, net inflows (US $ Billions) and pupil-teacher ration, secondary trends in Austria between the period 1981 and 2011
Risk governance & control: financial markets & institutions / Volume 5, Issue 3, 2015
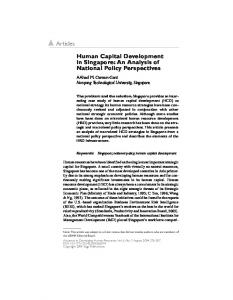
Figure 3 shows the trends of FDI, net inflow (% of GDP) and expenditure per student, secondary (% of GDP per capita) in Austria between 1998 and 2012. The World Bank (2014) statistics shows that expenditure per student, secondary (% of GDP per capita) plummeted by a mere 1.77 percentage points, from 29.60% in 1998 to 27.83% in 2000 before experiencing another slight decline of 0.07 percentage points between 2000 and 2002. On the other hand, FDI, net inflow (% of GDP) went up by 2.21 percentage points, from 2.13% in 1998 to 4.34% in 2000 and then plummeted by 4.19 percentage points during the period between 2000 and 2002. Expenditure per student, secondary (% of GDP per capita) declined by 0.30 percentage points between 2002 and 2004 whilst FDI, net inflow (% of GDP) increased by 1.15 percentage points during the same time frame. FDI, net inflow (% of GDP) went up from 0.15% in 2002 to 1.30% in 1.45% in 2004 whilst expenditure per student, secondary (% of GDP per capita) declined from 27.76% in 2002 to 27.46% in 2004. Moreover, World Bank (2014) statistics shows that expenditure per student, secondary (% of GDP per capita) continued on a downward trend by registering a 0.88 percentage points decline between
2004 to 2006 whilst FDI, net inflow (% of GDP) posted a positive growth of 0.15 percentage points, from 1.30% in 2004 to 1.45% in 2006 (refer to Figure 3).The period between 2006 to 2010 saw FDI, net inflow (% of GDP) experiencing a negative trend whilst expenditure per student, secondary (% of GDP per capita) was on the positive trend. FDI, net inflow (% of GDP) took a knock of 0.25 percentage points, from 1.45% in 2006 to 1.20% in 2008 before further plummeting by 7.69 percentage points (from 1.20% in 2008 to a negative 6.49% in 2010) during the period between 2008 and 2010. On the other hand, expenditure per student, secondary (% of GDP per capita) went up by 0.79 percentage points, from 26.58% in 2006 to 27.37% in 2008 before increasing again by 2.23 percentage points during the period between 2008 and 2010 (refer to Figure 3). Last but not least, whilst expenditure per student, secondary (% of GDP per capita) went up from 29.60% in 2010 to 30.58% in 2012, representing a positive growth of 0.98 percentage points, FDI, net inflow (% of GDP) increased from a negative 6.49% in 2010 to a positive 0.25% in 2012, representing a significant a growth by 6.74 percentage points.
35,00
30,00
30,00
25,00 20,00
25,00
15,00 20,00 10,00 15,00 5,00 10,00
-
5,00
-5,00
-
-10,00 1998 1999 2000 2001 2002 2003 2004 2005 2006 2007 2008 2009 2010 2011 2012
Expenditure per student, secondary (% of GDP per capita) Foreign direct investment, net inflows (% of GDP)
Source: World Bank (2014)
30
Foreign direct investment, net inflows (% of GDP)
Expenditure per student, secondary (% of GDP per capita)
Figure 3. Foreign direct investment, net inflows (% of GDP) and expenditure per student, secondary (% of GDP per capita) trends for Austria between 1998 and 2012
Risk governance & control: financial markets & institutions / Volume 5, Issue 3, 2015
4 Research methodology a) Data and data sources. Time series data which ranges from 1981 to 2012 was used for the purposes of this study. FDI, net inflow (% of GDP) was used as a measure for FDI whilst pupil-teacher ratio (secondary) was used as a proxy for human capital development. Another proxy of human capital development known as expenditure per student, secondary (% of GDP per capita) was not used for analysis because of lack of sufficient data. Both FDI, net inflows (% of GDP) and pupil-teacher ratio data variables were obtained from the World Bank (2014) Development Indicators. There was no autocorrelation of FDI, net inflow (% of GDP) data at level. However, the pupil-teacher ratio (secondary) data was auto correlated at level and this was dealt away with at first difference. b) Unit root tests. As per procedure before causality tests are performed, all-time series data
must be tested for stationarity. This study tested both human capital and FDI data for stationarity using Augmented Dickey Fuller (ADF), Philips-Perron (PP) tests and the Dick-Fuller GLS. Philips-Perron (PP) unit root tests discovered that FDI data was stationary at level because the test statistic was found to be lower than the critical values. Apart from that, both data variables were discovered to be non-stationary at level using Augmented Dickey Fuller (ADF), PhilipsPerron (PP) tests and the Dick-Fuller GLS (see Table A). Since stationarity of both data variables could not be established at level, unit root tests were done at first difference using the Augmented Dickey Fuller (ADF), Philips-Perron (PP) tests and the Dick-Fuller GLS (see results in Table B).
Table A. Stationarity tests of variables in levels Variable FDI HUMCAP FDI HUMCAP
Test Statistic – Intercept Critical Values Stationarity Tests of Variables on levels - Augmented Dickey-Fuller - Test -2.231909 -3.670170* -2.963972** -2.263068 -3.679322* -2.967767** Stationarity Tests of Variables on levels – Phillips-Perron (PP) Test -5.873245 -3.661661* -2.960411** -3.511280 -3.661661* -2.960411** Stationarity Tests of Variables on levels – Dickey-Fuller GLS (ERS) Test -2.186898 -2.644302* -1.952473** -0.424151 -2.644302* -1.952473**
FDI HUMCAP Note: 1) * and ** denote 1% and 5% levels of significance, respectively. 2) * MacKinnon critical values for rejection of hypothesis of a unit root. 3) The truncation lag for the PP tests is based on Newey and West (1987) bandwidth. Table B. Stationarity tests of variables on first difference
Variable Test Statistic – Intercept Critical Values Stationarity Tests of Variables on first Difference - Augmented Dickey-Fuller - Test DFDI DHUMCAP
-14.62773 -3.670170* -2.963972** -3.342273 -3.670170* -2.963972** Stationarity Tests of Variables on first Difference – Phillips-Perron (PP) Test DFDI -15.51534 -3.670170* -2.963972** DHUMCAP -3.365149 -3.670170* -2.963972** Stationarity Tests of Variables on levels – Dickey-Fuller GLS (ERS) Test DFDI -14.65995 -2.644302* -1.952473** DHUMCAP -2.198515 -2.644302* -1.952473** Note: 1) * and ** denote 1% and 5% levels of significance, respectively. 2) * MacKinnon critical values for rejection of hypothesis of a unit root. 3) The truncation lag for the PP tests is based on Newey and West (1987) bandwidth.
31
Risk governance & control: financial markets & institutions / Volume 5, Issue 3, 2015
As can be seen in Table B, FDI data was found to be stationary at both 1% and 5% levels of significance usingAugmented Dickey Fuller (ADF), Philips-Perron (PP) tests and the Dick-Fuller GLS.However, human capital development data was only found to be stationary at 5% significance level using Augmented Dickey Fuller (ADF), Philips-
n
Perron (PP) tests and the Dick-Fuller GLS (refer to Table B). c) ARDL-bounds co-integration testing methodology. This section investigates the existence a co-integrating vector (long run relationship between the two variables) using the ARDL-bounds testing methodology which is expressed as follows.
n
InFDI t a 0 a1i InFDI t i a 2i InHUMCAPt i a 3 InFDI t 1 a 4 InHUMCAPt 1 t ……….(a) i 1
i 0
n
n
i 1
i 0
InHUMCAPt 0 1i InHUMCAPt i 2i InFDIt i 3 InFDIt 1 4 IInHUMCAPt 1 t Where: In HUMCAP = Log of human capital development; In FDI = Log of foreign direct investment variables; Δ = first difference operator;μ is a white noise error whilst subscripts t and t-i represents time periods. The first stage that must be followed when using ARDL bounds testing technique is to examine the order of lags on the first differenced variables in equations (a) and (b). This was done using the Akaike
(b)
Information Criterion (AIC) and the Schwartz Information Bayesian Criterion (SIC).The results of the Akaike Information Criterion (AIC) and the Schwartz Information Bayesian Criterion tests in Table C shows that the optimal lag of both FDI and human capital development is 1.The shorter the optimal lag length like in this case, the more robust the equations (a) and (b) are.
Table C. Determination of the optimal lag length VAR Lag Order Selection Criteria Endogenous variables: DFDI DPUPILTEACHER Exogenous variables: C Sample: 1981 2012 Lag LogL LR FPE AIC 0 -94.82686 NA 4.466807 7.172360 1 -72.90799 38.96689* 1.186638* 5.845036* 2 -71.26189 2.682533 1.422322 6.019399 3 -69.39617 2.764022 1.692082 6.177494 4 -68.24643 1.532988 2.150782 6.388624 * indicates lag order selected by the criterion LR: sequential modified LR test statistic (each test at 5% level) FPE: Final prediction error AIC: Akaike information criterion SC: Schwarz information criterion HQ: Hannan-Quinn information criterion Then the bounds F-test for co-integration were performed to equations (a) and (b) in a bid to determine the existence of a long-run relationship
SC 7.268348 6.133000* 6.499339 6.849410 7.252516
HQ 7.200902 5.930663* 6.162110 6.377290 6.645505
between FDI and human capital development. Table D shows the bounds F-test result.
Table D. Bounds F-test for Co-integration Dependent variable FDI HUMCAP
Pesaran et al. (2001), p. 301, Table CI(v) Case V
Function FDI(HUMCAP) HUMCAP(FDI) Asymptotic Critical Values 1% I(0) I(1) I(0) 8.74
9.63
32
6.56
F-test statistic 10.04864*** 6.073419 5% I(1)
I(0)
10% I(1)
7.30
5.59
6.26
Risk governance & control: financial markets & institutions / Volume 5, Issue 3, 2015
Note: *** denotes statistical significance at the 1% level. Based on the results reported in Table D, the study concludes that there exists a unique cointegrating vector or long term relationship between FDI and human capital development. This is confirmed by the F-statistic in the FDI equation which is higher than the critical values at the 1% level of significance. n
d) The granger non-causality test. Since longrun relationship between FDI and human capital development has been ascertained (see Table D), Granger-causality test between the two variables was then done using the following model (refer Narayan and Smyth, 2008).
n
InFDI t 0 1i InFDI t i 2i InHUMCAPt i ECM t 1 t …… ……. (c) i 1
i 0
n
n
i 1
i 0
InHUMCAPt 0 1i InHUMCAPt i 2i InFDI t i ECM t 1 t ………………(d) Where InHUMCAP = Log of human capital development; InFDI = Log of foreign direct investment variables; ECMt-1 = the lagged errorcorrection term obtained from the long-run equilibrium relationship; Δ = first difference operator; μ is a white noise error whilst subscripts t and t-i represents time periods.
The lagged error correction term (ECM) measures the Granger causality in the long run whilst the co-efficients in the equations (c) and (d) test the Granger causality in the short run. This was corroborated by Narayan and Smyth (2006). Table E contains Granger causality test results in the long run whilst Table F shows causality tests in the short run when FDI is the dependent variable.
Table E. Granger non-causality tests in the long run Dependent Variable: FDI C(1) C(2) C(3) C(4) R-squared Adjusted R-squared S.E. of regression Sum squared resid Log likelihood F-statistic Prob(F-statistic)
Coefficient -0.666551 -0.485520 8.585371 1.228136 0.689246 0.653389 4.939276 634.3077 -88.33821 19.22245 0.000001
C(1) is a coefficient for the ECM whilst the other co-efficients C(2), C(3) and C(4) measures the short run causality when FDI is the dependent variable in this case. C(1) is negative and significant
Std. Error t-Statistic 0.246402 -2.705140 0.158532 -3.062600 3.909985 2.195755 1.038614 1.182476 Mean dependent var S.D. dependent var Akaike info criterion Schwarz criterion Hannan-Quinn criter. Durbin-Watson stat
Prob. 0.0119 0.0051 0.0372 0.2477 -0.001333 8.389620 6.155881 6.342707 6.215648 2.028929
because its corresponding probability is less than 5%. This means that human capital development as proxied by pupil teacher ratio Granger caused FDI in the long run.
Table F. Granger non-causality tests in the short run Dependent Variable: FDI Wald Test: Test Statistic t-statistic F-statistic Chi-square Null Hypothesis: C(3)=0 Null Hypothesis Summary: Normalized Restriction (= 0) C(3)
Value 2.195755 4.821342 4.821342
33
df 26 (1, 26) 1
Probability 0.0372 0.0372 0.0281
Value 8.585371
Std. Err. 3.909985
Risk governance & control: financial markets & institutions / Volume 5, Issue 3, 2015
The co-efficient C(3) is significant because the corresponding probability of the t-statistic is less than 5%. This means that human capital development Granger caused FDI in the short run as well (see Table F). When pupil teacher ratio was used as a dependable variable, C(1) which is a coefficient of
ECM was found to be insignificant as the corresponding probability was found to be more than 5%. This means that FDI did not Granger cause human capital development in the long run (see Table G).
Table G. Granger non-causality tests in the long run Dependent Variable: Pupil Teacher Ratio Coefficient C(1) -0.011536 C(2) 0.524259 C(3) -0.003137 C(4) -0.041395 R-squared 0.378042 Adjusted R-squared 0.306277 S.E. of regression 0.213219 Sum squared resid 1.182020 Log likelihood 5.941438 F-statistic 5.267813 Prob(F-statistic) 0.005662
Std. Error t-Statistic 0.033286 -0.346566 0.168786 3.106049 0.006844 -0.458462 0.044835 -0.923273 Mean dependent var S.D. dependent var Akaike info criterion Schwarz criterion Hannan-Quinn criter. Durbin-Watson stat
The short run co-efficient proxied by C(3) was also found not to be significant as its corresponding probability was more than 5%. This shows that
Prob. 0.7317 0.0045 0.6504 0.3644 -0.112000 0.255996 -0.129429 0.057397 -0.069662 2.367168
human capital development was not Granger caused by FDI in the short run (see Table H).
Table H. Granger non-causality tests in the short run Dependent Variable: Pupil Teacher Ratio Wald Test: Test Statistic Value t-statistic -0.458462 F-statistic 0.210187 Chi-square 0.210187 Null Hypothesis: C(3)=0 Null Hypothesis Summary: Normalized Restriction (= 0) C(3) Restrictions are linear in coefficients. 5 Conclusion This paper focuses on establishing the relationship between human capital development and foreign direct investment (FDI). In particular, the direction of causality between these two variables is the main focus of this study. This study has been necessitated by the failure by many previous researchers to concur on the causal relationship between FDI and human capital development. Some authors argue that there is a uni-directional causality relationship running from FDI to human capital development whilst others are saying the causality runs the other way round from human capital development to FDI. The other group of authors says there is a bi-directional relationship between these two variables whilst the fourth and last group of authors maintains that there exist no causal relation at all between FDI and human capital
df 26 (1, 26) 1
Probability 0.6504 0.6504 0.6466
Value -0.003137
Std. Err. 0.006844
development. Using the lagged error correction model (ECM), the study observed that FDI was granger caused by human capital development (proxied by pupil-teacher ratio) both in the short and long run. However, the null hypothesis which says that FDI Granger caused human capital development was rejected both in the short and long run. The author therefore recommends the intensification of teacher-pupil ratio improvement programmes in order not only to increase FDI inflow but to ensure Austria benefits from that increased FDI inflow. References 1.
34
Axarloglou, K. (2004) ‘Local labour market conditions and foreign direct investment flows in the U.S. ’,AEJ, Vol. 32, No. 1, pp. 62-66.
Risk governance & control: financial markets & institutions / Volume 5, Issue 3, 2015
2.
3.
4.
5. 6.
7.
8.
9.
10.
11. 12.
13.
14. 15.
16.
17.
18.
19.
Blomstrom, M. and Kokko, A. (2002) ‘FDI and human capital: A research agenda’,OECD Development Centre, Working Paper No. 195, pp. 434. Borensztein, E. De Gregorio, J. and Lee, J.W. (1998) ‘How does foreign investment affect growth?’, Journal of International Economics, Vol. 45, No. 1, pp. 115-135. Deyo, F.C. (1989) ‘Beneath the miracle: Labour substitution in the new Asian Industrialisation’,University of California Press, Berkeley. Dunning, J. (1988) ‘Explaining international production. London: Unwin Hyman. Figini, P. and Gorg, H. (2011) ‘Does foreign direct investment affect wage inequality? An empirical investigation’, The World Economy, Vol.34, No. 9, pp. 1455-1475. Elia, S. Mariotti, I. and Piscitello, L. (2009) ‘The impact of outward FDI on the home country’s labour demand and skill composition’, International Business Review, Vol. 18, No. 4, pp. 357-372. Ford, T.C. Rork, J.C. and Elmslie, B.T. (2008) ‘Foreign direct investment, economic growth and the human capital threshold: Evidence from US States’,Review of International Economics, Vol. 16, No. 1, pp. 96-113. Ge, Y. (2006) ‘The effect of foreign direct investment on the urban wage in China: An empirical examination’, Urban Studies, Vol. 43, No. 9, pp. 1439-1450. Girma, S. and Gorg, H. (2007) ‘Evaluating the foreign ownership wage premium using a difference in differences matching approach’, Journal of International Economics, Vol. 72, No. 1, pp. 97-112. Hanson, J.R (1996) ‘Human capital and direct investment in poor countries’, Explorations in Economic History, Vol. 33, No. 1, pp. 86-106. Kottaridi, C. and Stengos, T. (2010) ‘Foreign direct investment, human capital and non-linearities in economic growth’, Journal of Macroeconomics, Vol. 32, No. 3, pp. 858-871. Lan, J. Kakinaka, M. and Huang, X. (2012) ‘Foreign direct investment, human capital and environmental pollution in China’, Environmental Resource Economics, Vol. 51, No. 2, pp. 255-275. Lucas, R.E. (1990) ‘Why does not capital flow from rich to poor countries?’, American Economic Review, Vol. 80, No. 2, pp. 92-96. Lipsey, R.E. and Sjoholm, F. (2001) ‘Foreign direct investment and wages in Indonesian manufacturing, NBER working paper No. 8299. Cambridge, M.A: NBER. Majeed, M.T. and Almad, E. (2008) ‘Human capital development and FDI in developing countries’, Munich Personal RePEc Archive, Quaid-i-Azam University. Mastromarco, C. and Ghosh, S. (2009) ‘Foreign capital, human capital and efficiency: A stochastic frontier analysis for developing countries’, World Development, Vol. 37, No. 2, pp. 489-502. Narayan, P.K., and Smyth, R. (2006), ‘Higher education, real income and real investment in China: Evidence from Granger Causality tests’, Education Economics, Vol. 14,No. 1, pp. 107–125. Narayan, P. K., and Smyth, R. (2008), “Energy consumption and real GDP in G7 countries: New evidence from panel co-integration with structural
20. 21.
22.
23.
24.
25.
26.
27. 28.
29. 30.
31.
32.
33.
34. 35. 36.
35
breaks”, Energy Economics, Vol. 30, No. 5, pp. 2331–2341. Narula, R. (1996) ‘Multinational investment and economic structure: Globalisation and Competitiveness, Routledge, London. Newey, W.K., West, K.D.(1987), ‘A simple, positive semi-definite, heteroskedasticity and autocorrelation consistent covariance matrix’, Econometrica, Vol. 55, No. 3, pp. 703-708. Noorbakhsh, F. A. Paloni, S. and Youssef, A. (2001) ‘Human capital and FDI inflows to developing countries: New empirical evidence’, World Development, Vol. 29, No. 9, pp. 1593-1610. Ozyigit, A. and Eminer, F. (2011) ‘Bounds test approach to the relationship between human capital and foreign direct investment as regressors of economic growth in Turkey’, Applied Economic Letters, Vol. 18, No. 6, pp. 561-565. Pesaran, M., Shin, Y., and Smith, R. (2001), “Bounds testing approaches to the analysis of level relationships’, Journal of Applied Econometrics, Vol. 16,No. 3, pp. 289–326. Ramasamy, B. and Yeung, M. (2010) ‘A causality analysis of the FDI-wages-productivity nexus in China’, Journal of Chinese Economic and Foreign Trade Studies, Vol. 3, No. 1, pp. 5-23. Reiter, S.L. and Steensma, H.K. (2010) ‘Human development and foreign direct investment in developing countries: The influence of FDI policy and corruption’, World Development, Vol. 38, No. 12, pp. 1678-1691. Ritchie, B.K. (2002) ‘Foreign direct investment and intellectual capital formation in South East Asia’, OECD Development Centre, 194: Paris. Root, F. and Ahmed, A. (1979) ‘Empirical determinants of manufacturing direct foreign investment in developing countries’, Economic Development and Cultural Change, Vol. 27, No. 4, pp. 751-767. Schneider, F. and Frey, B.S. (1985) ‘Economical political determinants of FDI’, World Development, Vol. 13, No. 2, pp. 161-175. Suliman, A.H. and Mollick, A.V. (2009) ‘Human capital development, war and foreign direct investment in Sub-Saharan Africa’, Oxford Development Studies, Vol. 37, No. 1, pp. 47-61. Tanna, S. and Topaiboul, K. (2005) ‘Human capital, trade, FDI and economic growth in Thailand: What causes what?’, Paper presented at Dynamics, Economic Growth and International Trade DEGIT X Conference, 3-5 June, 2005, Mexico City. Tavares, A.T. and Teixeira, A.A.C (2006) ‘Is human capital a significant determinant of Portugal’s FDI attractiveness?’, FEP Working Papers, Research – Work in Progress. No. 211. pp. 1-9. Velde, D.W.T. and Xenogiani, T. (2007) ‘Foreign direct investment and international skill inequality’, Oxford Development Studies, Vol.35, No. 1, pp.83104. Wang, M. and Wong, M.C.S. (2011) ‘FDI, education and economic growth: Quality matters’, Atl Economics Journal, Vol. 39, No. 2, pp. 103-115. World Bank (2014). World Development Indicators published by the World Bank, Washington D.C. Zhang, K. and Markusen, J. (1999) ‘Vertical multinationals and host country characteristics’, Journal of Development Economics, Vol. 59, No. 2, pp. 233-252.