Research Institute of Applied Economics 2007
Working Papers 2007/17, 23 pages
DOES HUMAN CAPITAL STIMULATE INVESTMENT IN PHYSICAL CAPITAL? EVIDENCE FROM A COST SYSTEM FRAMEWORK
Enrique López-Bazo and Rosina Moreno AQR Research Group-IREA Universitat de Barcelona Avda Diagonal 690, 08034 Barcelona, Spain Tel: +34 934037041 +34 934037042; FAX: +34 934021821 Email:
[email protected];
[email protected]
Abstract The direct effect of human capital on economic growth has been widely analysed in the economic literature. This paper, however, focuses on its indirect effect as a stimulus for private investment in physical capital. The methodological framework used is the duality theory, estimating a cost system aggregated with human capital. Empirical evidence is given for Spain for the period 1980-2000. We provide evidence on the indirect effect of human capital in making private capital investment more attractive. Among the main explanations for this process, we observe that higher worker skill levels enable higher returns to be extracted from investment in physical capital.
JEL: C30, J24, O11, O47
1
Research Institute of Applied Economics 2007
Working Papers 2007/17, 23 pages
1. INTRODUCTION
The role that human capital plays as a stimulus for technical progress and for investment in physical capital has been stressed in the economic literature. It can be argued that the stock of human capital in an economy favours the generation and absorption of technology but that, at the same time, technical progress will increase the incentive to invest in education. In this way, if technology is linked to investment in physical capital, there will be a positive relationship between the two types of capital. Additionally, by stimulating the production structure to shift from sectors with lower to higher capitalisation ratios, another link between educational and physical capital can be deduced (Tamura, 2002). In fact, this relationship has been used in some empirical studies to justify the limited impact of human capital on the estimation of growth regressions that control for the accumulation of physical capital. Barro (1991), for instance, argues that a significant part of the effect of human capital is channelled through an increase in the investment rate for physical capital. The same result is obtained by Sianesi and Van Reenen (2003) and Krueger and Lindahl (2001). Even with more disaggregated evidence in the same line, Van de Walle (2003) finds that the net marginal benefit of investment in an irrigation system in Vietnam depends on the farmers’ educational level.
On the other hand, one could argue that the accumulation of human capital could offset the neoclassical mechanism of decreasing returns to the accumulation of physical capital. In this sense, Barro (1998) argues that an economy with an initially low ratio of physical capital to human capital (as after a war or catastrophe, or after a period of quick accumulation of human capital for non-economic reasons) will tend to grow rapidly due to increases in the stock of physical capital until the ratio between the two types of capital is equilibrated. This circumstance can be deduced from the growth models in which the physical capital to human capital ratio is constant in the long run. So, if there is disequilibrium in the economy at any moment—for instance, due to an abundant stock of human capital in relation to physical capital—equilibrium will be reached again through greater investment in the stock of the capital which was initially less abundant (Barro and Sala-i-Martin, 1995).
As a consequence of the reasons set out above, we believe that it is interesting to check whether the accumulation of education in an economy does indeed stimulate physical capital. The most recent contributions in this line have not reached a common conclusion. In some 2
Research Institute of Applied Economics 2007
Working Papers 2007/17, 23 pages
cases, this is due to the fact that the effect could depend on an economy’s level of development. Duffy et al (2004) estimate a CES production function for a sample of countries in which the assumption of constant elasticities of substitution between factors is relaxed, and a positive relationship could not be found between the educational level and physical capital. However, the authors recognise that this could be due to the high heterogeneity of the sample of countries—i.e. they have economies with very different development levels—which they have used to check the assumption in line with the argument made by Goldin and Katz (1998), according to which the relationship between the two types of capital depends on the development level.
Therefore, although the direct effect of human capital on economic growth has been widely analysed in the economic literature, its indirect effect through the stimulation of private investment in physical capital has not received much attention and, where it has, no clear conclusions have been reached. This paper aims at providing further stimulating evidence on the issue. Specifically, apart from the analysis of the direct effect of human capital on output, we focus on checking whether the accumulation of human capital stimulates investment in physical capital. This being the case, the paper tries to shed some light on the reasons behind such a relationship. In this sense, our prior assumption is that a higher worker skill level may enable a higher return to be earned from investment in physical capital. In other words, a high endowment of human capital in an economy makes it more attractive for firms to locate, especially for highly capitalised, productive activities which require a highly skilled workforce. This paper will test that hypothesis.
From a methodological point of view, a novelty in the paper is the use of the framework established by duality theory, using a cost system in which we incorporate human capital as a factor that can shift the cost function. The dual approach allows us to avoid, or at least mitigate, the impact of some drawbacks of the primal framework, most specifically questions concerning the endogeneity of human capital and the imposition of restrictions concerning its effects.1 The main advantage of using the duality framework in this paper arises from the possibility of computing the elasticity of physical capital to human capital and then analysing the indirect effect that human capital has on economic growth through its influence on the 1
Morrison and Siegel (1997) is, to the best of our knowledge, the only study to analyse effects of human capital endowment on production activity by adopting this approach in the more general sense of studying the effects of knowledge accumulation without analysing the stimulus that human capital may give to investment in physical capital.
3
Research Institute of Applied Economics 2007
Working Papers 2007/17, 23 pages
optimum stock of physical capital. That measure cannot be obtained by the standard practice of estimating a production function with human capital as an additional input.2
The above-mentioned methodology is applied to a comprehensive dataset for the Spanish economy in the last few decades. The situation in Spain could be paradigmatic since there has been a spectacular increase in educational attainment and this has coincided with a virtually uninterrupted process in which the country has opened up and become exposed to competition, with the ensuing modernisation of production and institutional structures. It seems therefore that the situation in Spain is ideal for assessing the impact of human capital and its relationship with physical capital. In addition, homogeneous, high-quality data on aggregate output and input quantities and prices, and educational human capital is available for a long time span for Spain as a whole and for each of its regions. This makes it possible to obtain robust estimates of the direct and indirect effects of human capital, in contrast with the evidence provided in most of the previous literature, which is based on information from samples of heterogeneous economies.
The rest of the paper is organised as follows. In the second section we present the model based on the duality theory that includes human capital stock as a factor that influences production technology in an economy, and we describe the empirical specification from which the effect of human capital on physical investment can be obtained. The third section describes the dataset and the major variables in the empirical analysis, paying special attention to the accumulation of human and physical capital in Spain over the last few decades. The results are reported in the fourth section and, in the last section, we put forward our conclusions.
2. THEORETICAL AND EMPIRICAL FRAMEWORK 2.1 Cost function expanded with human capital Consider a production function, where Y is the output and Xi (i=1,...,r) the i-th input: Y = F (X 1 ,..., X r )
(1)
2
The use of a cost function to analyse the effect of human capital must be understood therefore as parallel to the common practice in the economic growth literature of using a production function aggregated with the stock of human capital (see for instance Topel, 1999). Both frameworks rest on the same idea that a higher endowment of human capital in the economy may imply higher productivity growth.
4
Research Institute of Applied Economics 2007
Working Papers 2007/17, 23 pages
It is assumed that a typical firm in the economy must accept a vector of input prices, P1,..,Pr, so that the optimisation problem consists in determining the amount of inputs that minimises the cost of producing a given output, Y. Then, the level of optimal cost (C)—the solution to the optimisation problem—yields a cost function that is dual to the production function, which is dependent on input prices, output and the technology implicit in the production function: C = C (P1 ,..., Pr , Y)
(2)
We assume that all production factors can be adjusted within one time period so that the firm instantaneously determines long-run factor demands. As proposed in Brown and Christensen (1981), this can be defined as the full static equilibrium hypothesis (FSE) for production factors. Nevertheless, rather than assuming that all inputs adjust instantaneously to their longrun equilibrium values, there are reasons to believe that certain factors do not follow an adjustment mechanism of this kind. The reasons might include price controls and regulations and institutional constraints that are above and beyond the influence of an individual firm in the short run. The inputs that are in equilibrium are referred to as variable inputs, while those that are not are designated quasi-fixed inputs—a situation known as partial static equilibrium (PSE).
We consider here a framework that distinguishes between variable and quasi-fixed inputs, where the latter adjust only partially to their full equilibrium levels within one time period. This allows us to define a variable cost function which refers to a PSE situation in which the presence of certain inputs fixed at values other than their full equilibrium level implies that there are adjustment costs associated with changing the quasi-fixed factors. These inputs appear in the variable cost function through their amounts and not their prices. Let’s define Z, the vector of X inputs which are not in equilibrium, using a variable cost function with the following expression: VC = VC (P1 ,...Ps , Y, Z1 ,...Z m )
(3)
where VC = ∑i =1 Pi X i and s+m=r, where r is the total number of inputs. In a FSE situation, all s
inputs are considered to be variable and firms in the economy try to minimise total costs in (2). However, in a PSE situation, the objective is to minimise the cost of variable inputs conditioned to a stock of quasi-fixed inputs and the level of output (Y).
5
Research Institute of Applied Economics 2007
Working Papers 2007/17, 23 pages
Using both the full and the partial static equilibrium frameworks, cost functions have been widely used to analyse the substitution relationships between production factors. However, the particular purpose of this paper is to enable the identification of the impact of the aggregate stock of human capital in the economy, taking human capital as an external factor, i.e., one which is not explicitly under the control of the economy. Endogenous growth models emphasise the role of returns to capital embodying new knowledge, taking this type of capital as a general class that also encompasses aspects of human capital, among others. As stated in Morrison and Siegel (1997) these knowledge factors are hypothesised as external to industry, so that the resulting effects on productivity are interpreted as evidence of spillovers which can be considered as efficiency factors. The underlying efficiency factors can cause downward shifts of cost curves, so that their effect on productivity can be examined through a cost-function approach. Although firms pay for the human capital embedded in their employees through their wages, they do not pay for the rest of the human capital available in the economy, which is considered as an external environmental variable in our framework.3
Therefore, we focus our attention on an aggregate production function expanded with this type of capital. This aspect must be taken into account when obtaining the corresponding PSE model, which presents an associated aggregate variable cost function as follows: VC = VC (PL , PM , Y, K, H)
(4)
where we consider two variable inputs, labour (L) and intermediates (M) which appear in the cost function through their prices, PL and PM respectively; a quasi-fixed input, physical capital, K; Y is output; and H is human capital. In other words, economies of scale in a cost function are now recast to include this new argument, so that variations in the human capital stock available in the economy can lead to shifts in cost curves.
Thus, the short-run cost function is the sum of the variable cost and the cost of the services provided by the existing capital: SC = VC(⋅) + PK ⋅ K
3
(5)
The use of a cost function to analyse the effect of human capital must be understood as parallel to the common practice in the economic growth literature of using a production function aggregated with the stock of human capital (see, for instance, Topel, 1999). Both frameworks rest on the same idea that a higher endowment of human capital in the economy may imply higher productivity growth. In the cost function, this result implies that additional investment in human capital results in a downward shift in the aggregate cost function. According to Morrison and Siegel (1997) the use of the duality theory provides more broad-based information about the returns to variable, quasi-fixed and external factors.
6
Research Institute of Applied Economics 2007
Working Papers 2007/17, 23 pages
By applying Shephard’s lemma, the vector of the different variable inputs that minimise costs (cost-minimising demands) is obtained as follows:
X i = X i (PL , PM , Y, K, H) =
∂VC ∂Pi
(6)
i = L, M
Furthermore, we can calculate each factor share (Si), i.e., the percentage of the cost supposed by the i-th input: Si =
Pi ⋅Xi ∂ ln VC ∂VC Pi = = VC ∂ ln Pi ∂Pi VC
(7)
i = L, M
Equation set (4) and (7) constitutes the solution to what can be defined as the short-run equilibrium related to variable factors, given the amount of Y, K and H.4 In other words, the preceding functions, and consequently the short-run solution, are not independent of the stock of the quasi-fixed factor and human capital.
On the other hand, the long-run demand for the quasi-fixed factor is given by minimising the total short-run cost function in (5) with respect to K (the envelope condition): ∂ SC ∂ VC = + PK = 0 ∂K ∂K
− PK =
∂VC ∂K
(8)
The fixed factor is at its static equilibrium level if and only if the cost savings it generates (shadow price) equal the market rental prices. Solving (8) for capital we obtain its equilibrium stock: K * = G (PL , PM , PK , Y, H)
(9)
The optimal demand for K depends not only on its own price but on the prices of variable inputs, the level of output and the fixed quantity of human capital. Thus, equations (4), (6)— or (7)—and (9) characterise the long-run equilibrium.
By substituting (9) into (5) we obtain the long-run cost function, equivalent to the full static equilibrium:5 C = VC (PL , PM , Y, K * , H) + PK ⋅ K * = C (PL , PM , PK , Y, H)
(10)
4
Either demand functions or factor share functions may be used. So, alternatively, we could talk about set (4) and (6). 5 It is evident that the FSE can be understood as a specific case of the general model of partial equilibrium, a model in which the quasi-fixed inputs are to be found at their equilibrium quantities at all times.
7
Research Institute of Applied Economics 2007
Working Papers 2007/17, 23 pages
From the functions previously described, a set of measures in relation to the effects of human capital investments can be obtained, as will be shown in section 4.
2.2 Empirical specification
The functional form chosen for the empirical work is based on a translog cost function, a general second degree polynomial in logs, with the following form: ln (VC / PM ) = β0 + β L ln
PL + βY lnY + βK ln K + βH ln H + β T t + PM
⎡ ⎤ 0.5⎢βLL ln 2 PL + βYY ln 2 Y + βKK ln 2 K + βHH ln 2 H + β TT t 2 ⎥ PM ⎣ ⎦ + βLY ln PL ln Y + βLK ln PL ln K + βLH ln PL ln H + βLT ln PL t PM PM PM PM + βYK ln Y ln K + βYH ln Y ln H + βYT ln Y t + βKH ln K ln H + βKT ln K t + βHT ln H t
(11)
where t is a time trend which summarises technological change. For ease of notation, variables in equation (11) onwards do not carry subscripts referring to the observations.
This functional form permits the consideration of a wide range of substitution possibilities and can be accommodated within any production technology without the need to impose a priori restrictions on returns to scale. Intermediate prices are included as a relative factor to
ensure that the function is homogeneous of degree one in factor prices and that symmetry conditions are imposed (Berndt, 1991). In addition, no kind of a priori returns to scale are imposed.
The share equations for variable inputs on variable costs are obtained through the differentiation of equation (11) with respect to variable input prices, ∂VC (⋅) / ∂Pi , with i=L, M. For the two variable factors we consider here, only one equation is independent, given that factor shares sum to one. Thus, we have:
P ·L ∂ lnVC SL ≡ PL = = βL + βLL ln L + βLY ln Y + βLK ln K + βLH ln H + βLT t VC ∂ ln PL PM
(12)
SM ≡ 1 − SL On the other hand, if fixed inputs are in their long-run equilibrium condition, the following condition holds: P ·K ∂ lnVC − S K ≡ − PK = = βK + βKK ln K + βLK ln L + βYK ln Y + βKH ln H + βKT t VC ∂ ln K PM
(13)
8
Research Institute of Applied Economics 2007
Working Papers 2007/17, 23 pages
In this situation, the marginal reduction in variable costs due to increases in capital equals the input price, − ∂VC (⋅) / ∂K = PK .
Finally, differentiating logarithmically the function of VC(·) with respect to Y and introducing the condition of equality between the price of the output and the marginal cost, we obtain P ·Y ∂lnVC SY ≡ PY = = βY + βYY ln Y + βLY ln L + βYK ln K + βYH ln H + βYT t VC ∂ ln Y PM
(14)
The set of expressions (11)-(14) would comprise the framework of the full static equilibrium. By contrast, using the model of partial static equilibrium, the parameters in (13) would not correspond with those in (11).
2.3 The impact of human capital on physical capital
The effect of human capital on production can be defined as the elasticity of output with respect to this factor, and can be calculated in the context of the cost system using the envelope theorem (Chambers, 1988) as: ∂VC H ∂ ln Y = ∂H εY ,H = ∂SC Y ∂ ln H ∂Y −
(15)
The returns to human capital in (15) can be computed by using the parameters estimated in the cost system and the corresponding values for the variables involved. However, in the case of human capital, it is more intuitive to analyse the impact on production of one additional year of education, and returns to human capital are therefore defined as the increase in production caused by an increase of one year in the average educational attainment of employees. In other words, the semi-elasticity of output with respect to human capital can be expressed as:
RH ≡
∂ ln Y 1 = ε Y ,H ∂H H
(16)
At the same time, to make it easier to compare returns to human capital with returns associated with the accumulation of alternative factors, returns to physical capital defined as its product elasticity—can be calculated similarly to (15), i.e., as the percentage variation in the output as a result of varying the stock of physical capital by 1%:
9
Research Institute of Applied Economics 2007
RK = ε Y , K
Working Papers 2007/17, 23 pages
∂VC K ∂ ln Y ≡ = ∂K ∂ SC Y ∂ ln K ∂Y −
(17)
Finally, and bearing in mind that the main objective is to analyse the extent to which human capital exerts a stimulus on investment in physical capital, we define the semi-elasticity of the optimum demand of physical capital with respect to human capital as follows: Semi − ε K*H ≡
1 1 ∂ ln K * = ε K*H = −β KH H SK H ∂H
(18)
This measure indicates the percentage change in the stock of optimum physical capital with respect to a one-year increase in the average education level.
3. DATABASE 3.1 Database and variables
As stated above, we shall consider the influence of human capital on physical capital in the private productive sector of the Spanish economy during a period in which there was a marked accumulation of education and physical capital in conjunction with the modernisation of the Spanish economy and its opening up to foreign countries following integration into the European Union. We have information for the 17 Spanish NUTS II regions6 and the period analysed runs from 1980 to 2000.
The measure used for human capital in this study combines the average number of years at each level of education with the percentage of the population in each of these levels, thereby producing an attractive synthetic indicator of human capital, as with the average number of years of schooling in an economy. This type of indicator has been constructed for various samples of economies by, among others, Kyriacou (1991), Barro and Lee (1993, 1996, 2001), and has been used to analyse the contribution of the factor to growth in, for example,
6
NUTS is the French acronym for Nomenclature of Territorial Units for Statistics, a hierarchical classification established by EUROSTAT to provide comparable regional breakdowns of EU member states. In the case of Spain, the NUTS II regions correspond to the 17 autonomous communities, which are historical and administrative regions with a high level of political and financial autonomy.
10
Research Institute of Applied Economics 2007
Working Papers 2007/17, 23 pages
Benhabib and Spiegel (1994), Temple (1999), del Barrio et al (2002), de la Fuente and Doménech (2006).7
The information required to construct the indicator was drawn from Mas et al (2002). For each year and region in Spain, they provide the share of workers across five levels of education: no schooling, primary education, secondary education, first level of higher education, and second level of higher education. We have followed Serrano (1996) by assigning 0 years to workers with no schooling, 3.5 years to workers with primary education studies, 11 years to those having completed secondary education, 16 years to workers with a first level of higher education and 17 years to those with a second level of higher education.
The remaining statistical information has been taken from the BD.MORES database prepared by the Spanish Ministry of Economy and Finance.8 Specifically, of the data provided by the BD.MORES database, we have used the series relating to Gross Value Added at factor prices, employment, wages, private physical capital stock and its cost, and intermediates. The output variable chosen is the production value, which is obtained by summing intermediates and value added. The time period for all these series runs from 1980 to 2000.
3.2 Descriptive analysis of human and physical capital in Spain
Table 1 shows the evolution of some of the variables of interest. Human capital (H)—i.e., the average years of schooling of workers in the private productive sector of the Spanish economy—almost doubled over the period. Specifically, the educational level increased more than four years over the two decades, reaching 9.32 years in 2000. However, it is interesting to highlight that the growth rate decelerated with time, so that further accumulation of human capital is not expected to continue with the same strength. As for physical capital (K), we also observe positive growth rates throughout the period under analysis, although the interesting point here is that it clearly shows pro-cyclical behaviour. Physical capital experienced slow growth in the period from 1980 to 1985, showed a strong expansion in the late eighties and underwent something of a slowdown in the early nineties that gave way to a growth period at the end of the century. Specifically, the analysis of the ratio of the two magnitudes leads to 7
Alternatives, such as the rate of schooling or the literacy rate, have drawn considerable criticism due to their clear limitations when approximating an economy's human capital stock. They have, however, been used in several studies because of the impossibility of obtaining detailed information about the education levels of the population. 8 Free access at http://www.igae.meh.es/SGPG/Cln_Principal/Presupuestos/Documentacion/Basesdatosestudiosregionales.htm
11
Research Institute of Applied Economics 2007
Working Papers 2007/17, 23 pages
the conclusion that the K/H ratio decreased over time with the exception of the last five years, where we observe a notable increment. This would point to the fact that human capital increased at higher rates than those of physical capital, except in the last five years when the reverse occurred. Labour productivity (Y/L) experienced increases throughout the whole period although at different growth rates, which decelerated especially at the end of the nineties. This evolution coincides in time with the capitalisation process of the Spanish economy, as shown by the K/L ratio.
[Insert Table 1 around here]
4. RESULTS 4.1. Estimate of the coefficients of the cost system
To choose the framework to use in computing the elasticities in section two, we need to determine whether the observed levels of physical capital correspond with their long-term optimal levels. This will allow us to determine the type of framework (FSE or PSE) which best fits the sample under consideration, without any a priori decision, as is usually the case in the literature. Therefore, the fixity assumption of K is explicitly tested by applying the test developed by Schankerman and Nadiri (1986).9 Both models are estimated using the iterative Zellner technique for seemingly unrelated regression equations, which converge to the maximum likelihood estimator for models of this type. The result of this contrast is shown in the lower panel of Table 2. The result is conclusive: for our sample, the model that best captures the behaviour of the production technology of the private sector is that of partial static equilibrium. In other words, the assumption that capital stock in this sector adjusts at all times to the optimum as a function of the existing production technology is clearly rejected. Consequently, we estimate the PSE model, which is the set of equations (11)-(14) where the parameters in (13) do not correspond with those in (11) since the restrictions between them are not imposed. The restrictions between the parameters of equation 11 and those of equations 12 and 14 are imposed (column i in Table 2, where we only give the estimates of equation 11 to avoid repetition), whereas equation 13 is estimated in the model without imposing restrictions between parameters (column ii). 9
In brief, the null hypothesis of long-run equilibrium is tested by applying a standard likelihood ratio test, which in essence compares the estimates from the specification that imposes the constraints in the coefficients across equations with those from the short-run equilibrium model that does not impose any restriction. The constrained estimator is consistent under the null but not under the alternative hypothesis, while the unconstrained estimator is consistent under both the null and the alternative.
12
Research Institute of Applied Economics 2007
Working Papers 2007/17, 23 pages
[Insert Table 2 around here]
In addition, we show the results obtained from the likelihood ratio test of the null hypothesis that the matrix of disturbance covariances of the system of equations is diagonal. The value obtained for the test statistic (108.8) lies clearly within the rejection zone of the null hypothesis, so that the Zellner estimation for the SURE-type model is adequate.
We have included two dummy variables interacting with the linear terms of the variable factor prices, the stock of physical capital and output. Correspondingly, the dummies have also been included in the factor share equations and in the equilibrium conditions of physical capital and output. The first of the dummies (D1) controls for the size of the regional economy, in terms of its share of the country’s total output. The second (D2) is included to account for the situation in some regions in which the ratio of physical to human capital was fairly low.
It should be pointed out that it is unreasonable to undertake any kind of direct interpretation or structural analysis from the estimated parameters, because we are using the translog approximation of the unknown functional form underlying the cost system. Similarly, it is worth stressing that convergence was reached in the estimation with a relatively small number of iterations and, more importantly from an economic point of view, that the coefficients of the terms that involve the dummy variables, as well as all the variables that describe the effect of human capital, are together significant. Consequently, the Wald test value reported in Table 2 confirms the existence of a significant effect of human capital on costs.
4.2. Does human capital stimulate investment in physical capital?
In keeping with the purposes of this paper, we will briefly analyse the direct effect of human capital on output and then focus our attention on checking whether the accumulation of human capital stimulates investment in physical capital. Finally, we will delve into the reasons underlying the relationship between the two types of capital.
Looking at Table 3, we observe that the estimation of the returns to human capital is positive and of a sizeable magnitude, with an average return around 7.3%. In other words, for the mean of the period under consideration, an increase of one year in the average level of education of the labour force gave rise to an increase of 7.3% in output. This result would 13
Research Institute of Applied Economics 2007
Working Papers 2007/17, 23 pages
therefore justify subsidies for the training of human capital, i.e. the education of individuals, as an effective tool of development policy, given that any resources diverted for this purpose would be profitably spent, even in comparison with the profitability levels of alternative investments such as in physical capital (average return of 7.6%). The relevance of human capital deduced from that result corresponds with the one obtained by Serrano (1997), whose findings indicate that the factor would have been responsible for between a third and a half of labour productivity growth in the Spanish economy in the last few decades.
[Insert Table 3 around here]
To analyse the extent to which human capital exerts a stimulus on investment in physical capital, we obtain the semi-elasticity of the optimum demand of physical capital with respect to human capital. This measure indicates the percentage change in the stock of optimum physical capital with respect to a one-year increase in the average educational level. We observe that this semi-elasticity is positive in all cases, indicating that human capital seems to have stimulated the stock of physical capital. In addition, the impact is quite significant since, in average terms over the period, an additional year of education meant an increase of around 19% in the optimal stock of capital. The effect, which was more significant at the beginning of the eighties,10 stabilised at levels near 13% from the second part of the decade.
We now turn to the analysis of the likely reasons that could explain why increases in human capital stimulated investment in physical capital. One possible explanation could be that the improvement in workers’ skills would have enabled a higher return from investment in physical capital. In this way, the accumulation of human capital could have offset the neoclassical mechanism of decreasing returns to additional investment in physical capital. According to the results for the returns to physical capital over time, although not monotonic in nature, we observe an increase in returns in the period (around two points between 1980 and 2000). This is true even after taking into account the constant increase of the factor in the Spanish economy. Thus, the decreasing returns mechanism seems not to be working in the accumulation of physical capital (at least not in net terms). That is, a high endowment of human capital in an economy would make it more attractive for existing firms to continue
10
In fact, the elasticity in 1980 is too high to be credible. This is due to the high value of the price of physical capital given the extremely high interest rates reported in that year in Spain.
14
Research Institute of Applied Economics 2007
Working Papers 2007/17, 23 pages
investing in physical capital and for new firms to locate, given the higher returns they can obtain, especially for high value-added activities which require skilled workers.
Unlike the case of physical capital, the neoclassical mechanism of decreasing returns is observed in the case of human capital accumulation. There is a considerable decrease in returns, so that at the end of the period returns are just 50% of what was observed at the beginning of the period. Bearing in mind the continuous increase in the stock of this factor (Table 1), the result would appear to point to a clear mechanism of decreasing returns to the accumulation of human capital. However, at the end of the period, the returns to an extra year of education are still considerable (roughly 5.6%).
Another reason for what could have happened in the Spanish economy in the given period is that the rate of accumulation in human capital surpassed that of physical capital (except in the last five years, 1996-2000, as shown in Table 1), producing an unbalance K/H ratio. This would have counteracted the re-equilibrium mechanism in the ratio of the two kinds of capital and therefore of the decreasing returns to the accumulation of physical capital, when increasing the marginal productivity of physical capital (predictions of the models of Uzawa, 1965 and Lucas, 1988)11.
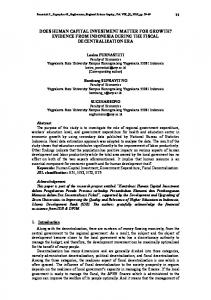
With the aim of confirming this idea, Figures 1 and 2 show the relationship between the physical capital to human capital ratio and the returns to both factors in our sample. In the case of human capital returns (Figure 1), we clearly see that, when physical capital is abundant in relation to human capital, the returns to human capital are much higher than when the balance is in favour of the educational stock. The coefficient of correlation between the two magnitudes has a significant value of 0.74. The same phenomenon takes place in the case of physical capital returns (Figure 2). In that case, the relationship with the ratio of the two kinds of capital is inverse although slightly less intense. However, it is equally significant (correlation of –0.49).
In order to assess the impact of education on the returns to physical capital, we have simulated what would have happened if the stock of human capital had increased at a different 11
In the Lucas model, output and human capital accumulation are expressed as Y = K α (uH )1− α and & = BH(1 − u ) − δH , where u is the fraction of time devoted to generating human capital. In this model, the H average productivity of physical capital, its marginal productivity and its returns depend on the ratio K/uH.
15
Research Institute of Applied Economics 2007
Working Papers 2007/17, 23 pages
pace so that the stock at the end of the period would have been different, all other economic variables being equal. The real figures for the Spanish economy in 2000 show an average number of years of education of 9.3, which enabled returns to physical capital of 8.8% in that year. However, as shown in Table 4, if the growth rate of education in the given period had been lower than the actual one, the returns to physical capital would also have been lower. For instance, with an average stock of human capital in 2000 of 8 years of education, the returns to physical capital would have amounted to 0.9%, or in the case of rising to 8.5 years of education, the returns would have been 4.2%. By contrast, if the growth rate of human capital had been higher, the returns to physical capital would have also been higher. Specifically, for an average stock of human capital of 10 years of education, physical capital returns would have been 12.9%, whereas in the case of an average of the population having completed secondary education (11 years of education), the returns would add up to 16.6%. According to these figures, if the Spanish economy had not made a substantial investment in enhancing educational levels, lower worker skill levels would have led to lower returns from investments in physical capital.
5. CONCLUSIONS
In this paper we have applied the framework established by duality theory to provide empirical evidence on the positive effect of the accumulation of human capital on economic growth. The main advantage of using the framework in this paper arises from the possibility of computing the elasticity of physical capital to human capital and analysing the indirect effect that the latter has on economic growth through its influence on the optimum stock of physical capital. That measure cannot be obtained by the standard practice of estimating a production function including human capital as an additional input. Our results suggest that, when modelling the effect of human capital on economic growth, the estimation of a cost system that includes this type of capital makes obtaining measures of its direct and indirect effects easy, making it thus preferable to the standard practice based on the primal approach.
Positive and non-negligible aggregate returns to human capital in the Spanish economy in the last few decades support a direct effect of worker education on aggregate productivity. But in addition, we have also detected a significant indirect effect through the stimulation of private investment in physical capital. From our results, we can conclude that the stock of human 16
Research Institute of Applied Economics 2007
Working Papers 2007/17, 23 pages
capital available in the economy exerts a beneficial effect on returns to physical capital, in such a way that it might well offset the traditional mechanism of decreasing returns. Therefore, improvements in the endowment of human capital in an economy would make investment in physical capital more attractive in such an economy.
The evidence reported in this paper reveals that, on average for the last two decades, each additional year in the level of workers’ schooling caused a 19% increase in the optimum stock of physical capital in the Spanish economy. Accordingly, we have also shown that returns to physical capital would have been much lower had the endowment of human capital increased at a slower pace. The implications of these results are then obvious. Human capital accumulation in Spain must have stimulated investments in existing firms, and helped improve its ability to attract new business and fight against the process of delocalisation towards economies with lower costs of production.
The lessons obtained from the Spanish case can be useful for the design of development and competitiveness policies in other economies. They also support public policies aimed at promoting improvements in human capital endowment, given that individuals are not aware of the indirect effect that their investment in education might have on aggregate productivity, through induced additional investment in physical capital. In the absence of such policies, there is likely to be underinvestment in human capital.
REFERENCES Barro R (1991) Economic growth in a cross section of countries, Quarterly Journal of Economics 106: 407-443 Barro R and Lee J.W. (1993) International comparisons of educational attainment, Journal of Monetary Economics 32: 363-394
Barro R and Lee J.W. (1996) International Measures of Schooling Years and Schooling Quality, American Economic Review 86: 218-223
Barro R and Lee J.W. (2001) International data on educational attainment: updates and implications, Oxford Economic Papers 53: 541-563
Barro R.J. (1998) Human capital and growth in cross-country regressions, mimeo, Harvard University Barro R and Sala-i-Martin X (1995) Economic growth, McGraw-Hill, Nueva York
17
Research Institute of Applied Economics 2007
Working Papers 2007/17, 23 pages
Benhabib J and Spiegel M.M. (1994) The role of human capital in economic development: evidence from aggregate cross-country data, Journal of Monetary Economics 34: 143-173 Berndt E.R. (1991) Modeling the interrelated demands for factors of production: estimation and inference in equation systems, en The Practice of Econometrics: Classic and Contemporany, Addison-Wesley, Nueva York Brown R.S. and Christensen L.R. (1981) Estimating elasticities of substitution in a model of partial static equilibrium: an application to US agriculture, 1947 to 1974, en Berndt E.R. y Fields B.C. (Eds) Modelling and measuring natural resource substitution, MIT Press, Cambridge MA
Chambers R (1988) Applied production analysis, Cambridge University Press, Cambridge de la Fuente A and Doménech R (2000) Human capital in growth regressions: how much difference does data quality make?, OECD Economics Department, Working Papers # 262 de la Fuente A and Doménech R (2001) Schooling data, technological diffusion, and the neoclassical model, American Economic Review 91: 323-327 de la Fuente A and Doménech R (2006) Human capital in growth regressions: how much difference does data quality make?, Journal of the European Economic Association 4: 1-36 del Barrio T, López-Bazo E and Serrano G (2002) New evidence on international R&D spillovers, human capital and productivity in the OECD, Economics Letters 77:41-45 Duffy J, Papageorgiou C and Pérez-Sebastian F (2004) Capital-Skill complementarity?, Review of Economics and Statistics, 86, 327-44.
Goldin C and Katz L.F. (1998) The origins of technology-skill complementarity, Quarterly Journal of Economics 113: 693-732
Krueger A.B. and Lindahl M (2001) Education and growth: why and for whom?, Journal of Economic Literature 39:1101-1136
Kyriacou G (1991) Level and growth effects of human capital, Working paper C. Starr Center, New York University Lucas R (1988) On the mechanics of economic development, Journal of Monetary Economics 22: 342 Mas M, Pérez F, Uriel E, Serrano L and Soler A (2002) Capital humano y actividad económica, series 1964-2001, Fundación Bancaixa, Valencia
Morrison C and Siegel D (1997) External capital factors and increasing returns in U.S. manufacturing, Review of Economics and Statistics 79: 647-655
Schankerman, M. and Nadiri M.I. (1986) A test of static equilibrium models and rates of return to quasi-fixed factors, with an application to the bell system, Journal of Econometrics 33: 97-118 Serrano L (1996) Indicadores de capital humano y productividad, Revista de Economía Aplicada 11: 177-190
18
Research Institute of Applied Economics 2007
Working Papers 2007/17, 23 pages
Serrano (1997) Productividad y capital humano en la economía española, Moneda y Crédito 205: 79101 Sianesi B and Reenen van J (2003) The returns to education: Macroeconomics, Journal of Economic Surveys, 17, 157-200.
Tamura R (2002) Human capital and the switch from agriculture to industry, Journal of Economic Dynamics and Control 27: 207-242
Temple J (1999) The new growth evidence, Journal of Economic Literature, 37: 112-156 Topel R (1999) Labour Market and economic growth, en Ashenfelter, O. y Card, D (Eds), The Handbook of Labour Economics, North-Holland, Amsterdam
Uzawa H (1965) Optimal technical change in an aggregative model of economic growth, International Economic Review 6: 18-31
Walle D van de (2003) Are Returns to Investment Lower for the Poor? Human and Physical Capital Interactions in Rural Vietnam, Review of Development Economics, 7(4), 636-53.
19
Research Institute of Applied Economics 2007
Working Papers 2007/17, 23 pages
RH
Figure 1. Relationship between returns to human capital and relative stocks of physical and human capital
Figure 2. Relationship between returns to physical capital and relative stocks of physical and
RK
human capital
20
Research Institute of Applied Economics 2007
Working Papers 2007/17, 23 pages
Table 1. Time evolution of human and physical capital (Spain) 1980 1981 1982 1983 1984 1985 1986 1987 1988 1989 1990 1991 1992 1993 1994 1995 1996 1997 1998 1999 2000
H 5.06 5.18 5.38 5.59 5.74 5.91 6.16 6.42 6.62 6.90 7.12 7.32 7.51 7.73 7.98 8.18 8.45 8.64 8.86 9.08 9.32
K 22017847 22499966 22854075 23167361 23284175 23376304 23678050 24246605 25043141 26117319 27200248 28269177 29236942 29736355 30322707 31219910 32142264 33247770 34560969 36175191 38117427
K/H 255423 255301 249971 243311 237960 231440 225343 221796 221658 221589 224177 227057 228736 225756 222601 222909 221927 224033 227211 231695 237483
Y/L 2.51 2.56 2.58 2.64 2.77 2.82 2.86 2.89 2.96 3.03 3.05 3.09 3.16 3.19 3.32 3.37 3.41 3.43 3.47 3.49 3.53
K/L 2.19 2.32 2.39 2.45 2.54 2.53 2.53 2.49 2.49 2.53 2.55 2.64 2.80 2.97 3.03 3.07 3.12 3.13 3.12 3.14 3.19
Annual growth (1) 3.17 1.20 -1.95 2.40 2.89 1980-1985 2.95 2.81 -0.10 1.28 0.18 1986-1990 2.24 2.01 -0.37 1.76 3.06 1991-1995 1.99 3.47 1.36 0.69 0.46 1996-2000 3.10 2.78 -0.36 1.73 1.90 1980-2000 (1) Annual accummulated growth rate. H refers to human capital stock measured as years of schooling. K is the monetary stock of physical capital, Y is output and L is number of workers.
21
Research Institute of Applied Economics 2007
Working Papers 2007/17, 23 pages
Table 2. Estimates of the partial static equilibrium model
R2 R2 R2 R2
(i)
(ii)
Dependent var. : ln(VC/PM), SL, SY
Dependent var.: -SK
Coefficient
Estimate
t-Ratio
Estimate
t-Ratio
β0 βL βY βK βH βT βLL βYY βKK βHH βTT βLY βLK βLH βLT βYK βYH βYT βKH βKT βHT D1βL D1βY D1βK D2βL D2βY D2βK D1 D2
-3.835 0.300 -0.219 1.544 2.636 -0.105 0.094 -0.022 -0.056 -0.992 -0.001 -0.137 0.161 -0.118 0.000 0.066 0.615 -0.015 -0.623 0.016 0.061 0.003 -0.037 0.038 0.023 0.039 -0.041
-7.446 4.59 -2.467 15.289 6.685 -8.003 14.457 -3.74 -7.712 -9.032 -5.788 -15.211 19.669 -5.573 -0.436 5.995 22.057 -15.698 -16.691 13.173 8.679 0.449 -4.302 4.214 3.711 4.433 -4.512
0.061
0.905
-0.054
-10.435
-0.055
-3.823
0.111
9.100
-0.136 0.005
-5.579 5.839
0.003 0.008
0.357 1.171
of Cost function (Eq 11) of Labor share (Eq 12) of Capital share (Eq 13) of Price = Marginal Cost Equation (Eq 14)
# observations (N=17; T=21) # iterations
0.998 0.683 0.304 0.710 357 22
LR Test of SURE –χ2(6) – Wald Test: Significance of regional dummies –χ2(8) – Significance of human capital –χ2(7) –
115.6
p-val: 0.000
65.4 847.1
p-val: 0.000 p-val: 0.000
Shankerman & Nadiri Test –χ2(27) –
729.9
p-val: 0.000
Note: SURE estimation of equations 11, 12, 13 and 14 as in the main text. The restrictions between the parameters of equation 11 and those of equations 12 and 14 are imposed (column i), whereas equation 13 is estimated in the SURE model without imposing restrictions between parameters (column ii).
22
Research Institute of Applied Economics 2007
Working Papers 2007/17, 23 pages
Table 3. Return of human and physical capital Return to human capital (RH)
Return to physical capital (RK)
Physical capital elasticity of human capital (Semi-εK*,H)
Average
7.30%
7.60%
19.10%
Time evolution 1980 1981 1982 1983 1984 1985 1986 1987 1988 1989 1990 1991 1992 1993 1994 1995 1996 1997 1998 1999 2000
10.04% 9.36% 9.12% 8.98% 8.01% 7.63% 7.93% 7.49% 7.31% 7.07% 6.96% 6.97% 6.96% 7.12% 6.80% 6.41% 6.37% 6.20% 5.94% 5.71% 5.56%
6.19% 6.61% 7.50% 8.22% 8.17% 8.19% 7.16% 7.22% 7.26% 7.66% 7.56% 7.26% 6.93% 7.21% 7.51% 7.92% 8.08% 8.20% 7.88% 7.93% 8.79%
62.76% 33.63% 25.10% 26.57% 18.44% 20.69% 17.20% 13.82% 16.23% 13.76% 12.62% 12.64% 12.06% 13.52% 13.51% 11.88% 12.34% 14.32% 14.89% 15.65% 20.16%
Table 4. Simulation of output elasticity of physical capital according to different levels of human capital in year 2000 8 Simulated RK
0.9%
Average years of education in Spain in 2000 8.5 9 9.3 10 10.5 11 4.2%
7.3%
8.8%
12.1%
14.2%
16.6%
23