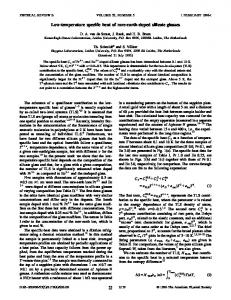
and n 1.6, 2.1, and 2.9 for the red, green, and blue emissions, respectively. The red ... ers glasses shows that the superior upconversion emission is caused by ...
PHYSICAL REVIEW B
VOLUME 53, NUMBER 10
1 MARCH 1996-II
Spectroscopic properties and upconversion mechanisms in Er31-doped fluoroindate glasses T. Catunda, L. A. O. Nunes, and A. Florez Instituto de Fı´sica de Sa˜o Carlos (IFSC), Universidade de Sa˜o Paulo, Caixa Postal 369, 13560-970 Sa˜o Carlos, Sa˜o Paulo, Brazil
Y. Messaddeq Instituto de Quı´mica, Universidade Estadual de Sa˜o Paulo, Araraquara, Sa˜o Paulo, Brazil
M. A. Aegerter Instituto de Fı´sica de Sa˜o Carlos (IFSC), Universidade de Sa˜o Paulo, Caixa Postal 369, 13560-970 Sa˜o Carlos, Sa˜o Paulo, Brazil ~Received 24 July 1995! Fluorindate glasses containing 1,2,3,4 ErF3 mol % were prepared in a dry box under argon atmosphere. Absorption, Stokes luminescence ~under visible and infrared excitation!, the dependence of 4S 3/2, 4I 11/2, and 4 I 13/2 lifetimes with Er concentration, and upconversion under Ti-saphire laser excitation at l5790 nm were measured, mostly at T577 and 300 K. The upconversion results in a strong green emission and weaker blue and red emissions whose intensity obeys a power-law behavior I; P n , where P is the infrared excitation power and n51.6, 2.1, and 2.9 for the red, green, and blue emissions, respectively. The red emission exponent n51.5 can be explained by a cross relaxation process. The green and blue emissions are due to excited state absorption ~ESA! and energy transfer ~ET! processes that predict a factor n52 and n53 for the green and blue emissions, respectively. From transient measurements we concluded that for lightly doped samples the green upconverted emission is originated due to both processes ESA and ET. However, for heavily doped samples ET is the dominant process.
I. INTRODUCTION
There is a great interest in the study of rare-earth doped heavy metal fluoride glasses. These materials present a high transparency from UV to IR region; they can be easily prepared and a relative high concentration of transition metal and rare earth can be incorporated into the matrix.1 Due to low multiphonon emission rates, rare-earth doped fluoride glasses present large upconversion efficiencies and fluorozirconate fiber lasers have been reported.2 Besides the well-known zirconates glasses several compositions based on indium fluoride have been studied. Compared to fluorozirconate glasses, these compositions present higher transparency in the mid-infrared range ~up to 8 mm!lower multiphonon emission rates and are also more stable against atmospheric moisture.3 The spectroscopy of Eu31 and Gd31 doped fluoroindate was studied showing evidence of Eu-Eu and Gd-Eu energy transfer.4 Upconversion of fluoroindate glasses doped with Pr31 ~Ref. 5! and Er31 ~Ref. 6! have been reported. In a previous work,6 some of us studied upconversion using a red laser ~l5647 nm! to pump the Er31 ions from the ground state to 4F 9/2. Er31 doped fluoride glasses conventional spectroscopy7–9 and upconversion6,10–12 have been studied very much lately. Upconversion have also been studied in many other glass types doped with Er31, like silicate,13 fluoride,10–13 tellurite,14 –15 oxide,16 chloride17 and others. A comparative study between fluoride and many others glasses shows that the superior upconversion emission is caused by their lower phonon energies.18 In the present work, we report results of absorption, fluorescence, lifetimes measurements and upconversion measurements in Er31 doped fluoroindate glasses. The upconversion was studied by using a Ti-saphire laser pumping the 4I 9/2 0163-1829/96/53~10!/6065~6!/$10.00
53
level. The results obtained in this work are substantially different from the ones obtained by pumping the 4F 9/2 level and provide a much better understanding of the upconversion mechanisms involved. II. EXPERIMENT
Fluoride glasses with bath compositions 20ZnF2-20SrF2-2NaF-16BaF2-6GaF3-~362x!InF3-xEr3 with x51, 2, 3, and 4 mol % were prepared. The concentration range ~1– 4 %! corresponds to 2.0– 8.031020 Er ions/cm3. The mixture was heated in a platinum crucible at 800 °C during one hour for melting and at 850 °C for fining, both treatments were performed in a dry box under argon atmosphere. The melt was cast into a preheated mold at 260 °C and slowly cooled down to room temperature. The samples were cut and polished into a parallel piped shape. The absorption paths of the samples were 2.07 mm, 1.77 mm, 2.01 mm, and 1.43 mm for concentrations 1,2,3, and 4 mol %, respectively. The emission spectra ~both conventional or Stoke luminescence and upconversion or anti-Stoke luminescence! were analyzed using a SPEX 1403 double monocromator equipped with RCA 31034 photomultiplier, connected to a PAR-128 lock-in amplifier. The infrared radiation ~at 1500 and 970 nm! was detected by using a nitrogen cooled Judson 516-D detector. The Stokes luminescences were obtained by pumping the Er31 with a Coherent Innova 400 Ar ion laser with a mirror for the UV lines ~351 and 364 nm!. Upconversion spectra were obtained by using a Coherent Mira-Basic Ti-saphire laser at lp 5790 nm ~used in cw mode!, resonant with the 4 I 15/2- 4 I 9/2 transition. Lifetimes were measured by chopping the cw pumping beam with a mechanical chopper, 6065
© 1996 The American Physical Society
CATUNDA, NUNES, FLOREZ, MESSADDEQ, AND AEGERTER
6066
53
TABLE I. Energy, peak cross section rP and calculated radiative lifetime t R at 300 K ~all the transitions are from the indicated levels to the ground state 4I 15/2!. Energy level 4
I 13/2 I 11/2 4 I 9/2 4 F 9/2 4 S 3/2 2 H 11/2 4 F 7/2 4 F 3/2, 4 F 5/2 2 G 9/2 4 G 11/2 4 G 9/2 4
Energy ~cm21!
rP ~10220 cm2!
t R ~msec!
6 602 10 279 12 612 15 379 18 552 19 267 20 592 22 362 24 692 26 457 27 451
0.4879 0.2563 0.2328 1.1547 0.7218 2.1767 1.3233 0.7227 0.3265 3.0054 1.2264
9.54 10.83 5.58 0.623 1.06 0.211 0.316 0.50 0.70 0.048 0.17
and by signal averaging the resulting fluorescence decays on a Hewlet Packard digital oscilloscope. III. RESULTS AND DISCUSSION A. Stokes emission and lifetimes measurements
By using the absorption data9 the energy level diagram for Er fluoroindate glass was determined. Table I shows the energy ~cm21!, peak cross section and radiative lifetime of 31
FIG. 1. Visible emission spectra of the 3 mol % sample at ~a! 300 K and ~b! 77 K. In part ~b! the vertical scale is 12 times larger than part ~a!. The spectra were obtained by pumping with l;355 nm radiation. Unless when indicated, all the peaks are related to transitions from excited states to the ground state 4I 15/2.
FIG. 2. Energy level diagram and Stokes emission processes under 364 nm ~a!, 488 nm ~b!, and 790 nm ~c! laser pumping.
the most important energy levels. These calculations were carried out by using the Judd-Ofelt theory; the complete data with Judd-Ofelt parameters, transitions probabilities, branching ratios, radiative lifetimes, and peak cross sections for stimulated emission can be found in Ref. 9. The Stokes emission ~conventional luminescence! spectra for the 3 mol % sample are shown in Fig. 1 and 3. Figures 1~a! and 1~b! show the visible Stokes emission obtained by pumping the sample with UV radiation from the Ar laser. The main laser lines are at 351 and 364 nm, the second one is in resonance with the 4G 9/2 level. These spectra show three main groups of lines ~blue, green, and red! that appear also in the absorption spectrum and correspond to the following 2 2 G 9/2→ 4 I 15/2; H 11/2, 4 S 3/2→ 4 I 15/2, and transitions: 4 4 F 9/2→ I 15/2. The line centered at ;12 000 cm21 corresponds to transition 4 S 3/2→ 4 I 13/2. The 300 K spectrum @Fig. 1~a!# also shows transitions 4 G 11/2→ 4 I 13/2, 2 G 9/2→ 4 I 11/2, and 2 H 11/2, 4 S 3/2→ 4 I 13/2. These transitions are indicated in process ~a! in Fig. 2. As the 2H 11/2 level is thermally populated its fluorescence disappears at low temperatures. The peculiar feature of these spectra, both at 300 and 77 K, is that the blue emission is much more intense than the red one. The opposite is found, for instance, in ZBLA ~ZrF4-BaF2-LaF3-AlF3! glass.7 It is also remarkable that the green emission increases by about one order of magnitude when the sample is cooled to 77 K. Figures 3~a! and 3~b! show the infrared Stokes emission spectra from 13 000– 6000 cm21 ~corresponding to 0.8 –1.7 mm!, obtained by pumping with the 488 nm radiation from the Ar laser @see also process ~b! in Fig. 2#. It is interesting to observe that at 77 K, the 4 S 3/2→ 4 I 13/2 luminescence is more intense than that of 4 I 13/2→ 4 I 15/2 transition and the transition 4 S 3/2→ 4 I 11/2 cannot be seen at 300 K. This is a consequence of the growth of the 4S 3/2 population when the temperature decreases as shown by relative increase of the 547 nm peak in Figs. 1. The peak observed in Fig. 3 indicated by an asterisk was not identified as an Er31 transition
SPECTROSCOPIC PROPERTIES AND UPCONVERSION . . .
53
6067
The fluorescence decays originated from the 4I 11/2 and I 13/2 levels, were obtained by pumping the 4I 9/2 Er31 level by using infrared radiation ~lp 5790 nm! from a Ti-sapphire laser. Level 4I 9/2 has a very short lifetime ~of the order of tens of microseconds7! due to fast nonradiative decay to 4 I 11/2. Thus the 4I 9/2 lifetime is negligible compared with 4 I 11/2 radiative lifetime which is about 8 msec as shown in Table II. Consequently, by taking the same arguments used for 4S 3/2 fluorescence, 4I 11/2 lifetime can be determined by analyzing its fluorescence decay under lp 5790 nm excitation @process ~c! in Fig. 2#. However, we cannot use this argument to explain the 4I 13/2 fluorescence ~using lp 5790 nm! because the decay times 4 I 11/2→ 4 I 13/2 and 4 I 13/2→ 4 I 15/2 are comparable. The fluorescence temporal behavior can be obtained from the rate equations for populations n 2 and n 1 of level 2 ~4I 11/2! and level 1 ~4I 13/2!, as indicated in Fig. 2, given by 4
FIG. 3. Infrared emission spectra of the 3 mol % sample at ~a! 300 K and ~b! 77 K. The spectra were obtained by pumping with l5488 nm radiation. The peak indicated by asterisk is probably due to an impurity.
and is possibly due to an impurity. Both absorption9 and Stokes emission spectra obtained from samples with different concentrations show identical characteristics and no significant effect of the doping level on the band structure has been observed. The lifetimes were obtained by fitting the luminescence time decay curves. The 4S 3/2 lifetimes were measured by pumping the 4F 7/2 level with 488 nm radiation from the Ar ion laser. For Er doped materials, usually all the levels excited above 4S 3/2 decay very fast to this level, by nonradiative cascade processes, and emit a green luminescence at 547 nm. Consequently, the nonradiative decay to the 4S 3/2 level is much faster than the 4S 3/2 lifetime and it can be disregarded in the lifetime analysis. The measurements were taken at 300 and 77 K and the results are shown in Table II. TABLE II. Lifetimes measurements.
Energy level 4
S 3/2 S 3/2 4 S 3/2 4 I 11/2 4 I 11/2 4 I 13/2 4 I 13/2 4
Er concentration x ~mol %!
T577 K t ~msec!
T5300 K t ~msec!
1 3 4 1 4 1 4
0.73 0.68 0.68 10.7 10.3 11.8 11.7
0.43 0.17 0.16 8.5 8.1 10.3 10.0
dn 3 /dt5 s 03Fn 3 2A 2 n 2 ,
~1a!
dn 2 /dt5A 32n 3 2A 2 n 2 ,
~1b!
dn 1 /dt5A 21n 2 1A 31n 3 2A 1 n 1 ,
~1c!
where si j is the absorption cross section for the transition from level i to j, F the incident pump flux for lp 5790 nm, A i j is the partial relaxation rate from level i to j and A i the total relaxation rate from level i given by A i 5 ( j A i j . We should remark that Eqs. ~1! are valid only at low excitation power so that upconversion terms can be neglected. By reminding that A 32@A 2 , the A 32 term in Eq. ~1b! can be neglected for longer times (t@1/A 32). Also the radiative decay term A 31 in Eq. ~1c! can be neglected because almost all the ions decay nonradiatively to level 2 (A 32@A 31). With these simplifications the n 2 (t) population decay ~4I 11/2! is given by a single exponential and n 1 (t) ~4I 13/2! by a double exponential: n 2 ~ t ! 5N 2 e 2A 2 t , n 1~ t ! 5
S
~2a!
D
A 2N 1 A 1 2A t e 2A 1 t 2 e 2 , A 2 2A 1 A2
~2b!
where N 3 5 s 03FN 0 /A 3 , N 2 5A 32N 3 /A 2 ; s 03FN 0 /A 2 , and N 1 5A 21N 2 /A 1 . The 4I 11/2 lifetime t251/A 2 was obtained by fitting the 980 nm fluorescence decay with an exponential curve. By using this t2 value as a fixed parameter, the 4I 13/2 fluorescence decay at l51.5 mm was fitted by a double exponential in order to determine the lifetime t151/A 1 . Figure 4 shows the experimental fluorescence decays of levels 4I 11/2 and 4I 13/2 with fits which agree well with Eq. ~2b!. The ratio (A 1 /A 2 )50.81 is in good agreement with the factor 0.80 obtained in the fit. In solids doped with rare-earth ions, the experimentally observed decay rate is a sum of three rates: a radiative decay ~W R 5t 21 R whose theoretically calculated values are given in Table I!, a multiphonon emission rate W ph and a rate due to luminescence quenching W q ~also called concentration quenching!. W ph depends strongly on the matrix phonon spectra and decreases exponentially with the effective phonon number ~p5E/h v eff!, which is the well-known energy gap law. Raman spectra for ZBLAN ~ZrF4-BaF2-LaF3-AlF3!
6068
CATUNDA, NUNES, FLOREZ, MESSADDEQ, AND AEGERTER
53
FIG. 4. Fluorescence decays from the 4I 13/2 level ~l51.5 mm! and 4I 11/2 level ~l50.973 mm! of the 1 mol % sample at 300 K. The line are the fits for the 4I 11/2 and 4I 11/2 fluorescences, a single exponential decay ~t258.1 msec! and a double exponential n 1 ;(e 2t/1020.80e 2t/8.1), respectively. These fits are in good agreement with Eq. ~2!.
show a polarized band at 580 cm21.19 In fluoroindate glasses Raman spectra show a strong polarized band at ;507 cm21 and a broad depolarized band centered at 203 cm21.20 IR reflection spectra show modes at ;484 and 225 cm21. In Eu31 and Gd31 doped fluoroindate glasses only vibronic bands associated with a vibrational mode at around 329 cm21 could be observed.4 The temperature behavior of the emission rate in Er31 doped ZBLA was studied in the range 4 –500 K.7 For the 4 S 3/2 level it was observed that W ph is constant at low temperatures and increases above T;100 K. In Er doped crystals and glasses the 4S 3/2 lifetime decreases with the concentration by two experimentally indistinguishable crossrelaxation processes ~Refs. 14 and 21!: ( 4 S 3/2, 4 I 15/2) →( 4 I 9/2, 4 I 13/2) and ( 4 S 3/2, 4 I 15/2)→( 4 I 13/2, 4 I 9/2). In the temperature range 77–300 K, for Er31 doped ZBLA, the 4S 3/2 experimental lifetime decreases by a factor 1.3 and 3.0 for 0.5 and 2 mol % Er concentration, respectively. For temperatures lower than 100 K both samples, with 0.5 and 2 mol % Er have the same lifetime. The fact that the 2 mol % sample has a shorter lifetime ~for T.100 K! indicates that crossrelaxation processes play an important role. We observed similar results, i.e., a decrease by a factor 1.1 and 2.7 for the 1 mol % and 3 mol % samples, respectively, when the temperature increases from 77 to 300 K ~Table II!. A similar behavior was also observed in tellurite glasses.14 The lifetime decreases strongly at high temperature but is almost constant at low temperature. The decreasing of the lifetime due to the increasing of the Er concentration (W q ) was also studied. At T5300 K the 4S 3/2 lifetime decreases by a factor 2.3 when Er31 concentration increases from 2.0 to 8.031020 ions/cm3. In the same concentration range, we observed a decrease by a factor of 2.8 ~Table II!. As observed in ZBLA,7 tellurite,14 aluminate and gallate18 glasses, the 4I 11/2 and 4I 13/2 lifetimes have a much less pronounced dependence with both concentration and temperature than the 4S 3/2 lifetime. This is a consequence of the small number of phonons involved. B. Upconversion process
Upconversion spectra have been measured by pumping Er ions with a Ti-saphire laser at lp 5790 nm. Figures 5~a! and
FIG. 5. Upconversion ~anti-Stokes emission! spectra of the 3 mol % sample under infrared excitation ~l5790 nm!; ~a! 300 K, and ~b! 77 K.
5~b! show the spectrum for the 3 mol % sample at T5300 K and T577 K, respectively. We observed a very intense green luminescence at l;547 nm corresponding to the thermally coupled 2 H 11/2, 4 S 3/2→ 4 I 15/2 transition, a red luminescence at l;650 nm due to the 4 F 9/2→ 4 I 15/2 transition and a blue luminescence at l;407 nm from the 2 G 9/2→ 4 I 15/2 transition. At 77 K @Fig. 5~b!# the green upconversion emission increases about one order of magnitude similar to the behavior observed in the visible Stokes emission spectra ~Fig. 1!. We also remind that in both visible and infrared Stokes emission spectra ~Figs. 1 and 3! the intensity of all transitions coming from the 4S 3/2 level increase at 77 K indicating an increase of its population. In barium-thorium fluoride glasses, Yeh et al.7 observed an increase of the upconversion green emission by a factor of ;2.8 when the temperature is decreased from 300 to 77 K. The green and blue spectrum shapes are very similar to the ones obtained by pumping the 4F 9/2 level with a Kr ion laser ~lp 5647 nm!.6 However, the integrated blue emission is much smaller for pumping at lp 5790 nm than for pumping at lp 5647 nm. To obtain more insight into the upconversion mechanisms the dependence of the upconversion intensity I was measured as a function of the incident pump power P at lp 5790 nm. All the experimental results can be fitted to a power-law behavior I; P n , with n52.1 for the green luminescence, n51.6 for the red luminescence, and n52.9 for the blue luminescence as shown in Fig. 6. A similar behavior for the green and blue luminiscences was observed by Harris et al.12 in ZBLAN glasses and for the red emission in Te based glasses by Oomen et al.10
53
SPECTROSCOPIC PROPERTIES AND UPCONVERSION . . .
2 4 I 11/2→ 4 I 15/21 4 F 7/2 .
FIG. 6. Log-log plots of the blue, green, and red upconversion emission intensities as a function of the infrared 790 nm excitation power for the 3 mol % sample.
As discussed previously, the lp 5790 nm excitation pumps essentially the Er31 ground state to the level 4I 11/2 @process ~a! in Fig. 7#. Two possible mechanisms for the green fluorescence can be envisaged: excited state absorption ~ESA! and energy transfer ~ET!. As shown by process ~b! in Fig. 7, ESA can happen from 4I 11/2 or 4I 13/2 states. The 4I 11/2 excited ion absorbs one more infrared photon, goes to 4F 3/2 and then decays to 2 H 11/2, 4 S 3/2. In the second case, the 4I 13/2 ion is promoted to the 2H 11/2 by absorbing another photon and then decay to 4S 3/2. In both cases the infrared laser is very close to resonance with ESA transitions ~the detuning is less than 5%!. However, the ESA absorption cross section of the second case is 2.3 times larger,9 and appears therefore more probable. In ET process, two 4I 11/2 excited Er ions exchange energy so that one of them ~the donor ion! decays to ground state 4I 15/2 and the other one ~the acceptor! is excited to 4F 7/2 which decays to 4S 3/2 @process ~c! in Fig. 7#:
FIG. 7. Er31 energy level diagram and excitation mechanisms.
6069
~3!
In both cases ~ESA and ET! two infrared photons are needed to reach 4S 3/2 which emits one green photon. This indicates an n52 exponent in the power-law behavior, that is very close to the experimental value n52.1. The blue luminescence can also be explained by ESA and ET transfer processes. ESA is possible by the transitions 4 I 9/2→ 2 G 9/2 or 4 F 9/2→ 4 G 9/2 which decay to 2G 9/2 @process ~d! in Fig. 7#. ET may happen with the donor ion excited in 4 I 11/2 and the acceptor ion excited in 4F 9/2. The donor decays to ground state and excites the acceptor to 4G 11/2 level, which decays to 2G 9/2 @process ~e! in Fig. 7#. In both ESA and ET processes, three infrared photons are needed to excite one ion to 2G 9/2 giving one blue photon. In this case, an n53 behavior is expected, in good agreement with the n52.9 experimental result. The blue upconversion luminescence is much weaker than the green one because the excitation mechanisms for the blue one involve states of shorter lifetimes and consequently having a lower population than the levels involved in the green luminescence. In the case of the red upconversion, the experimentally observed n51.5 dependence can be explained by a cross relaxation process.10 The donor ion in 4S 3/2 state decays to 4 F 9/2 while the acceptor ion in 4I 9/2 state is excited to 4F 9/2 @process ~f! in Fig. 7#: 4
S 3/21 4 I 9/2→2 ~ 4 F 9/2! ,
~4!
one infrared photon is needed to pump the 4I 9/2 state and two infrared photons are needed to reach 4S 3/2 producing two red photons. This reasoning gives a n51.5 dependence close to the value n51.6 found experimentally. We should remark that the green and blue upconversion results obtained with a red excitation ~647 nm!, close to 4F 9/2 level, are different from the ones presented in this work. In this case the experiment gave also a power law but with n51.5 for the green emission and n51.6 for the blue one ~results obtained for the 3 and 4 mol % samples!. The discrepancy between the experimental values and the expected value n52 was attributed to saturation effects. The exponent n also varies when the same Er31 energy level is pumped in different types of glasses. Experiments were done in oxide,16 chloride,17 ZBLAN,12 and in the present work, pumping the 4 I 9/2 using IR radiation around 800 nm. However in chloride glasses n;2 was obtained for both green and blue luminescence and in oxide glass n51.5 was obtained for the green luminescence. This indicates that the upconversion mechanisms depend strongly not only on the pumping wavelength, which determines the pumped energy level, but also on the glass type. We also studied the transient behavior of the green upconversion emission. The 1 mol % Er emission decay can be fitted by a double exponential with decay rates A 5 and 2A 2 , where A 5 and A 2 are the total relaxation rates of the levels 4 S 3/2 and 4I 11/2, respectively. The emission decays from the 3 and 4 mol % samples can be fitted by a single exponential with decay rate 2A 2 ~decay time ;4 msec!. This lengthening of the 4S 3/2 emission decay can be attributed to the ET pro-
6070
CATUNDA, NUNES, FLOREZ, MESSADDEQ, AND AEGERTER
cess given by Eq. ~3! as observed in LiYF4 :1% Er31.22 Consequently, we believe that for lightly doped Er samples the green upconversion is originated from both ESA and ET process. However, for heavily doped samples ET is the dominant process as observed in ZBLAN by Harris et al.12
1
Fluoride Glass for Optical Fibers, edited by P. W. France ~Blackie, London, 1990!. 2 J. Y. Allain, M. Monerie, and H. Pognant, Electron. Lett. 26, 166 ~1990!. 3 Y. Messaddeq, A. Delben, M. A. Aegerter, and M. Poulain, J. Mater. Res. 8, 885 ~1993!. 4 S. J. L. Ribeiro, R. E. O. Diniz, Y. Messaddeq, L. A. O. Nunes, and M. A. Aegerter, Chem. Phys. Lett. 220, 214 ~1994!. 5 L. E. E. Leite, A. S. Gomes, C. B. Arau´jo, Y. Messaddeq, A. Florez, O. L. Malta, and M. A. Aegerter, Phys. Rev. B 50, 16 219 ~1995!. 6 R. Reiche, L. A. O. Nunes, C. C. Carvalho, Y. Messaddeq, and M. A. Aegerter, Solid State Commun. 85, 773 ~1993!. 7 D. M. Shinn, W. A. Sibley, M. G. Drexhage, and R. N. Brown, Phys. Rev. B 27, 6635 ~1983!; D. C. Yeh, W. A. Sibley, M. Suscavage, and M. G. Drexhage, J. Appl. Phys. 62, 266 ~1987!. 8 R. Reisfeld, G. Katz, C. Jacoboni, R. de Pape, M. G. Drexhage, R. N. Brown, and C. K. Jorgensen, J. Solid State Chem. 41, 253 ~1982!; R. Reisfeld, G. Katz, N. Spector, C. K. Jorgensen, C. Jacoboni, and R. de Pape, ibid. 41, 253 ~1982!. 9 A. Florez, Y. Messaddeq, O. L. Malta, and M. A. Agaerter, J. Alloys Compounds 227, 135 ~1995!.
53
ACKNOWLEDGMENTS
This research was supported by Telebra´s, Fapesp, Capes, CNPq program RHAE-New Materials, Brazil, and the Departamento de Fı´sica, Universidad Industrial de Santander A. A. 678, Bucaramanga, Columbia.
10
E. W. J. L. Oomen, P. M. T. Le Gall, and A. M. A. van Dongen, J. Lumin. 46, 353 ~1990!. 11 M. Takahashi, R. Kanno, Y. Kawamoto, S. Tanabe, and K. Hirao, J. Non-Cryst. Solids 168, 137 ~1994!. 12 E. A. Harris, T. M. Searle, J. M. Parker, and D. Furniss ~unpublished!. 13 R. S. Quimby, M. G. Drexhage, and Suscavage, Electron. Lett. 23, 32 ~1987!. 14 W. Ryba-Romanowski, J. Lumin. 46, 163 ~1990!. 15 S. Tanabe, K. Hirao, and N. Soga, J. Non-Cryst. Solids 122, 79 ~1990!. 16 B. R. Reddy and P. Venkateswarlu, Appl. Phys. Lett. 64, 1327 ~1994!. 17 M. Shojiyam, M. Takahasi, R. Kanno, and K. Kadono, Appl. Phys. Lett. 65, 1874 ~1994!; A. Gharavi and G. L. McPherson, Appl. Phys. Lett. 61, 2635 ~1992!. 18 X. Zou and T. Izumitani, J. Non-Cryst. Solids 162, 68 ~1993!. 19 R. M. Almeida, J. Non Cryst. Solids 106, 347 ~1988!. 20 R. M. Almeida, J. C. Pereira, Y. Messaddeq, and M. A. Aegerter, J. Non-Cryst. Solids 161, 105 ~1993!. 21 D. S. Knowles and H. P. Jenssen, IEEE 28, 1197 ~1992!. 22 J. Rubin, A. Brenier, R. Moncorge, and C. Pedrini, J. Lumin. 36, 39 ~1986!.