Volume 6, Number 35
http://isedj.org/6/35/
March 14, 2008
In this issue:
A New Measure to Analyze Student Performance Using the Likert Scale
William J. Tastle Ithaca College Ithaca, NY 14850 USA
Jack Russell Northwestern State University Natchitoches, LA 71497 USA Mark J. Wierman Creighton University Omaha, NB 68178 USA
Abstract: Likert scale measures are commonly used in assessing student performance as well as student perceptions. They are particularly good in gathering data to subjective questions, but being able to compare and contrast multiple Likert data has been a challenge for the typical academic. Researchers and educators alike frequently assign a numerical value to each Likert category, and then take a weighted average to get some general overall value that can be used for comparative purposes. Such efforts are fraught with error, since Likert scales are ordinal measures. A new measure is presented here and discussed, and an example of its use is provided. The new measure is called the Consensus Measure; when used in conjunction with a weighted mean it is easy to intuitively grasp the dispersion of values around any mean. Ranking sets of Likert scale data is easily accomplished and philosophically established. Keywords: consensus measure, dispersion, weighted mean, weighted standard deviation
Recommended Citation: Tastle, Russell, and Wierman (2008). A New Measure to Analyze Student Performance Using the Likert Scale. Information Systems Education Journal, 6 (35). http://isedj.org/6/35/. ISSN: 1545-679X. (Preliminary version appears in The Proceedings of ISECON 2005: §2142. ISSN: 1542-7382.) This issue is on the Internet at http://isedj.org/6/35/
ISEDJ 6 (35)
Information Systems Education Journal
2
The Information Systems Education Journal (ISEDJ) is a peer-reviewed academic journal published by the Education Special Interest Group (EDSIG) of the Association of Information Technology Professionals (AITP, Chicago, Illinois). • ISSN: 1545-679X. • First issue: 8 Sep 2003. • Title: Information Systems Education Journal. Variants: IS Education Journal; ISEDJ. • Physical format: online. • Publishing frequency: irregular; as each article is approved, it is published immediately and constitutes a complete separate issue of the current volume. • Single issue price: free. • Subscription address:
[email protected]. • Subscription price: free. • Electronic access: http://isedj.org/ • Contact person: Don Colton (
[email protected]) 2008 AITP Education Special Interest Group Board of Directors Paul M. Leidig Grand Valley State University EDSIG President 2005-2006
Don Colton Brigham Young Univ Hawaii EDSIG President 2007-2008
Robert B. Sweeney U South Alabama Vice President 2007-2008
Wendy Ceccucci Quinnipiac Univ Member Svcs 2007-2008
Ronald I. Frank Pace University Director 2007-2008
Kenneth A. Grant Ryerson University Treasurer 2007-2008
Thomas N. Janicki Univ NC Wilmington Director 2006-2009
Albert L. Harris Appalachian St JISE Editor Alan R. Peslak Penn State Director 2007-2008
Kathleen M. Kelm Edgewood College Director 2007-2008
Kevin Jetton Texas St U San Marcos Chair ISECON 2008
Steve Reames Angelo State Univ Director 2008-2009
Patricia Sendall Merrimack College Secretary 2007-2008
Information Systems Education Journal Editors Don Colton Brigham Young University Hawaii Editor
Thomas N. Janicki Univ of North Carolina Wilmington Associate Editor
Information Systems Education Journal 2005-2006 Editorial Review Board Samuel Abraham Siena Heights U
Tonda Bone Tarleton State U
Alan T. Burns DePaul University
Lucia Dettori DePaul University
Kenneth A. Grant Ryerson Univ
Robert Grenier Saint Ambrose Univ
Owen P. Hall, Jr Pepperdine Univ
Jason B. Huett Univ W Georgia
James Lawler Pace University
Terri L. Lenox Westminster Coll
Alan R. Peslak Penn State Univ
Jack P. Russell Northwestern St U
Jens O. Liegle Georgia State U
Denise R. McGinnis Therese D. O’Neil Mesa State College Indiana Univ PA Jason H. Sharp Tarleton State U
Charles Woratschek Robert Morris Univ
EDSIG activities include the publication of ISEDJ, the organization and execution of the annual ISECON conference held each fall, the publication of the Journal of Information Systems Education (JISE), and the designation and honoring of an IS Educator of the Year. • The Foundation for Information Technology Education has been the key sponsor of ISECON over the years. • The Association for Information Technology Professionals (AITP) provides the corporate umbrella under which EDSIG operates. c Copyright 2008 EDSIG. In the spirit of academic freedom, permission is granted to make and
distribute unlimited copies of this issue in its PDF or printed form, so long as the entire document is presented, and it is not modified in any substantial way. c 2008 EDSIG
http://isedj.org/6/35/
March 14, 2008
ISEDJ 6 (35)
Tastle, Russell, and Wierman
3
A New Measure to Analyze Student Performance Using the Likert Scale William J. Tastle
[email protected] Dept of Business Administration Ithaca College Ithaca, New York 14850, USA Jack Russell
[email protected] College of Business Northwestern State University Natchitoches, Louisiana 71497, USA Mark J. Wierman
[email protected] Dept of Computer Science Creighton University Omaha, Nebraska 68178-2090, USA ABSTRACT Likert scale measures are commonly used in assessing student performance as well as student perceptions. They are particularly good in gathering data to subjective questions, but being able to compare and contrast multiple Likert data has been a challenge for the typical academic. Researchers and educators alike frequently assign a numerical value to each Likert category, and then take a weighted average to get some general overall value that can be used for comparative purposes. Such efforts are fraught with error, since Likert scales are ordinal measures. A new measure is presented here and discussed, and an example of its use is provided. The new measure is called the Consensus Measure; when used in conjunction with a weighted mean it is easy to intuitively grasp the dispersion of values around any mean. Ranking sets of Likert scale data is easily accomplished and philosophically established. Keywords: consensus measure, dispersion, weighted mean, weighted standard deviation 1. INTRODUCTION As educators, we spend a considerable amount of time involved in the assessment of our students, frequently by using a Likert scale. Sometimes we assess a student singularly, but usually we perform the assessment on teams. To clearly determine how a team progresses over time, i.e., if the team is working together and getting the job done,
c 2008 EDSIG
or has begun to flounder and is in need of some assistance, instructors commonly use the Likert scale to determine the level of need. The purpose of this paper is to describe a new measure that permits the assessment and ranking of ordinal scale (Likert) measures. The work is new, so the presentation is more theoretical than practical, though we illustrate the effectiveness of
http://isedj.org/6/35/
March 14, 2008
ISEDJ 6 (35)
Tastle, Russell, and Wierman
the method with an example from the classroom. The paper addresses the types of measurement scales and describes the mathematics behind this new measure. An example of an application of the measure to the analysis of student data is provided as an illustration of the power of the measure. Further, we describe how this measure also serves as an intuitive measure of dispersion, something that is difficult, at best, to do with the current dispersion measures of variance and standard deviation. The new measure is called the consensus measure; its properties have been described and proven elsewhere (Wierman and Tastle, 2005; Tastle and Wierman, 2005). It also has an inverse measure called dissension. 2. THE MATHEMATICS OF THE NEW MEASURE The measure is based on the fundamental theory of information as developed by Claude Shannon (1948) and recognized in the form of the Shannon entropy:
H (X ) = −
∑
n i =1
p ( xi ) log 2 p ( xi )
4
or decreasing alphabetical order is not a ranking order. Hence, any attempt to make meaningful comparisons is inappropriate. Ordinal scales are merely ordered categories, but the ordering makes comparisons implicitly possible. Testing the temperature of a cup of tea would permit someone to use the words cold, tepid, lukewarm, warm, moderately hot, hot, and very hot as their scale of comparative measure. There is no sense of interval scale in this measure and hence, equations such as cold + lukewarm = moderately hot, or the average of hot and very hot is hot and a half, is both impractical and illogical. Likert scales fall into this category of measures. The number of choices that may be selected as categories of a Likert scale are virtually without limit, although the five or seven category scales are the most prominent. With an increase in the number of categories, it may be argued that the accuracy of the category selected becomes crisper. However, regardless of the granularity of the categories, ordinal scales are merely ordered. The distance between each category, sometimes referred to as the interval, is incorrectly assumed to be equal.
Measures of Scales
Interval scales possess a definite and fixed interval about them such as is observed when viewing that the temperature is 70 degrees Fahrenheit. There does exist a scale created using the freezing and boiling points of water to define 32 degrees and 212 degrees, respectively. However, even though a fixed interval scale exists, there is no benchmark value that initiates an absolute zero value (the Kelvin scale, however, does possess such a value) so equations such as the 32 degrees * 2 = 64 degrees make no logical sense. Equations involving temperature must first be converted to Kelvin scale for computation purposes, and then converted back to the original scale. Interval scales permit addition and subtraction operations, but multiplication and division are not possible.
Collections of categories used to accumulate data that are without any sense of order are called nominal scales. An example of a nominal scale is a listing of continents, i.e., 1 = Africa, 2 = Antarctica, 3 = Asia, 4 = Australia, 5 = Europe, 6 = North America, and 7 = South America. It is not logical to say that any meaningful ranking order is possible among these categories, and an increasing
Ratio scales have an absolute zero base, possess an interval, and implicitly possess order. The number line is such a scale, and all mathematical operations can be conducted on it. To perform any kind of meaningful assessment requires the utilization of a ratio scale. The logical justification in using ratio-based mathematics to determine a value for an ordinal measure rests in the un-
This measure is fundamental to the study of information theory and has played a strong role in fuzzy mathematics (Klir and Wierman, 1997, 1998). The equation of the consensus measure is defined as: n
Cns( X ) = 1 +
∑ p log i
i =1
2
| Xi − µX | 1 − dX
where X is represented as the Likert scale, pi is the probability of the frequency associated with each X, dX is the width of X, Xi is the particular Likert attribute, and µX is the mean of X. The proof is found in Wierman and Tastle (2005).
c 2008 EDSIG
http://isedj.org/6/35/
March 14, 2008
ISEDJ 6 (35)
Tastle, Russell, and Wierman
derlying philosophy. What is crucial to the calculation of a value by which an ordinal scale measure can be compared to another is the means by which the resulting value is interpreted. Thus, merely claiming that an average value of an ordinal scale based on the assignment of a set of integers to the values, i.e., SA = 1, A = 2, etc, is not sufficient to be able to claim that a weighted average captures the respondents’ intent for there is an implicit interval in that interpretation, and ordinal scales have no such interval associated with them. Further, given a group of n individuals arguing over a statement, if ½ n strongly agree with the statement, and ½ n strongly disagree, the average is neutral! How accurate would it be to report that on the statement in question, the participants were unsure? Jamieson (2004) tells us that there is too much of this sort of measurement fraud in the literature. As educators, we have an opportunity to bring these inaccuracies into the view of our students and provide a relatively easy-to-use method by which we utilize ordinal scales to compare ordered categories. Dispersion Indicators The dispersion of values about a central value, i.e., the weighted mean, permits an assessment of the strength of the collective respondents perceptions without placing a focus on an arbitrary numerical interval assignment. Thus, a collective set of ordinal scale values that yield a narrow dispersion can logically be viewed as possessing a greater agreement than one with a wide dispersion. The logic is identical to that of the standard deviation except that the standard deviation, weighted or otherwise, is a real number that lends little value to understanding the values on which it is based. The consensus measure, on the other hand, informs the investigator of the sense of dispersion using the commonly understood concept of percentage. Thus, a weighted standard deviation of 8.0 means little, but a consensus of 0% indicates maximal dispersion of data on a Likert scale, that is, no consensus whatsoever. The mean and standard deviation each requires a fixed interval, a zero value, and a continuous scale, none of which are available in an ordinal scale. One might expect, therefore, that any use of ratio measure mathematics is thus inappropriate. If that argu-
c 2008 EDSIG
5
ment is true, then no mathematical measure can be used to make use of any ordinal scale, the Likert scale included. The alternative is to use a measure of dispersion that does not require a fixed interval or continuous scale, but does offer a minimum and maximum value. Hence, by using a relative measure, such as a percentage, there need not be any “agreed to” interval scale; all that needs to be in agreement are the extreme values. In the case presented here using a Likert scale, 0 represents complete dissent or an absence of agreement, and 1 represents complete agreement, or an absence of dissent. The consensus measure satisfies the above requirements and hence, is a suitable measure of agreement using ordinal scales. The original motivation for the measure was to resolve a problem dealing with group decision-making dynamics, and was thus named the consensus measure; it is equally proper to refer to it as a measure of agreement. 3. SIMULATIONS OF THE MEASURE OF CONSENSUS AND DISPERSION Table 1 shows a set of values for a fivecategory Likert scale, n = 12. The weighted mean, weighted standard deviation, consensus and dissension values are also provided. It can be easily observed that as the values move from the extreme values (row 1) to only one value (row 10), the consensus measure proceeds from 0 to 1, or 0% to 100%. It is reasonable to expect that of a group of 12 individuals in which two groups of six take opposing views, the consensus is zero. It is not possible for the group to be in further dissent. The dissension is defined as 1 minus Cns, so the Dis column is an easy transformation. The consensus measure also functions very well as a measure of dispersion. Using the weighted standard deviation column, the values are graphed against the consensus measure, yielding an R2 of 0.996. However, row 1 shows a weighted standard deviation of 8.0 for the extreme case, a value that is not intuitive. The Cns measure, however, gives a value of 0 for the same case. Regardless of n, the Cns will always be 0 but the weighted standard deviation will change. This interpretation permits the consensus measure to function as a substitute for dispersion.
http://isedj.org/6/35/
March 14, 2008
ISEDJ 6 (35)
Tastle, Russell, and Wierman
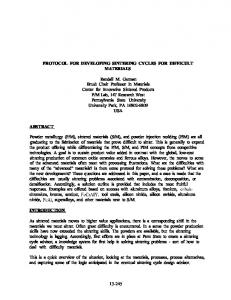
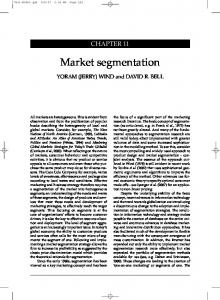
4. ILLUSTRATION OF THE APPLICATION OF THE CONSENSUS MEASURE Data was taken from one of the author's Advanced Systems Development classes for the Fall 2004 semester. The issues are provided in Table 2(a) and the tabulation of the data is shown in Table 2(b) and Table 2(c). Thus, issue 1 on personal attire ranges from 1 to 5 (low to high). For this analysis, the survey categories ranged from strongly disagree to strongly agree. The number of items in each category is counted and the weighted mean, weighted standard deviation, and consensus (as a percent) is calculated. From the data it is difficult to identify trends and meaningful comparisons. Counting the overall total might suggest that the highest value wins, but the degree of consensus (the dispersion of the data), suggests otherwise. Wt Mean vs Cns 100.0%
Cns (%)
95.0% 90.0% 85.0% 80.0% 75.0% 70.0% 3.5
4.0
4.5
5.0
w eighted Mean
Figure 1 The weighted mean vs. consensus. The data of figure 1 show a clear bifurcation of students into two groups, one centered on about 4.0 and the other on about 4.7. Given that 5 is the desired rating for each student's grade, the mean seems to identify the better performers. However, when the consensus is taken into account, the diagram analysis is more challenging and the knowledge gleaned from the charts more significant. Recall the earlier discussion on how the weighted mean can result in extremely erroneous information such as what occurs when ½n selects SA and the other ½n selects SD. The weighted mean is Neutral, and it would be inaccurate to permit a reader to assume that the entire population n were unable to form an opinion on the issue under discussion. In fact, the population has formed very strong, but opposing, opinions. Using the weighted mean
c 2008 EDSIG
6
fails to capture this dimension. On the other hand, providing a standard deviation or weighted standard deviation, while accurately capturing the dispersion, requires a ratio scale; Likert scales are, of course, ordinal. The consensus measure, using the unit interval of 0 to 1 as the set of all possible values of dispersion, conveys an immediate sense of agreement or dispersion. The closer we are to 1, or 100%, the less the dispersion and the greater the agreement. We turn to Table 2 for a closer examination of some details. The consensus values range from a low of 71% to a high of 96.5%, a difference of 25.5%. Those values at the lower end of the range are in less "agreement" than the values at the upper range. Further, the lower the value the greater the dispersion, for there is less consensus. Thus, we interpret the weighted mean value of 3.6 (row 6 of Table 2) as the least desirable value and also note that the dispersion about that number is also the greatest; stated differently, a group of individuals debating and discussing the value assigned to this issue possesses greatest disagreement. A combination of low weighted mean and low consensus indicates the issue 6, enunciation and tone, was handled least well by the students. The highest agreement, 96.5%, has a mediocre weighted mean of 3.95 for issue 9, asked or responded to questions well. Clearly it was relatively easy for the reviewer to count the number of issues asked and answered, and the assessment of the quality of response was in strong agreement. Other issues, however, leave considerable opportunities for debate as to their mastery. If we decide that the lower half of the consensus values require additional effort to master, then all consensus values of 83.75% or less reflect qualities that need to be mastered by the students. According to the data, issues 1 Appearance, 2 Professional Attire, 4 Body Language, 5 Introduction, 6 Enunciation and tone, 8 Group presence, 10 Organized, 11 Good eye contact, and 12 Attentive, are in deficit. On the other hand, issues 3 Grooming, 7 Vocabulary, 9 Asked or responded to questions well, 13 Friendly, 14 Asked appropriate questions or provided the questions, and 15 Answers appropriately and correctly, have high agreement.
http://isedj.org/6/35/
March 14, 2008
ISEDJ 6 (35)
Tastle, Russell, and Wierman
This example illustrates how the consensus measure can be used to rank ordered categories such that those categories can be logically compared and contrasted. Further, this measure permits for the analysis of classroom data, frequently assembled by faculty in the form of ordered categorical frequencies that can be used to rank individuals or groups. It is obvious that a weighted mean is insufficient by itself for any meaningful evaluation. 5. CONCLUSION The consensus measure, originally developed for use in group decision-making activities, has emerged as a useful tool in understanding dispersion of ordinal data by transforming the unit interval values to percentages. Hence, the consensus measure can be interpreted to possess the same information as a weighted standard deviation measure, except that it is much easier to understand and utilize dispersion when represented as a percentage. Low consensus values can also be interpreted as having a high dispersion about the weighted mean value, and high consensus values have a low dispersion about the weighted mean. Utilizing the Likert scale has been a continuing problem when seeking ways in which to tabulate and compare the values of ordinal scales. This measure breaks new ground in providing a tool for measuring student and instructor perceptions as collected via any ordinal scale.
c 2008 EDSIG
7
6. REFERENCES Jamieson, S, (2004), "Likert scales: how to (ab)use them." Medical Education, 38, pp. 1217-1218. Klir, George J. and Mark J. Wierman, (1997). Lecture Notes in Fuzzy Mathematics and Computer Science: Uncertainty-Based Information Elements of Generalized Information Theory. Center for Research in Fuzzy Mathematics and Computer Science, Creighton University, Omaha, Nebraska. Klir, George J. and Mark J. Wierman (1998). Uncertainty-Based Information. PhysicaVerlag, New York. Shannon, Claude E. (1948). “The mathematical theory of communication.” The Bell System Technical Journal, 27(3&4), pp. 379-423, 623-656. Tastle, William J and Mark J Wierman (2005), "Consensus and Dissension: A New measure of Agreement." North American Fuzzy Information Systems Processing Conference (NAFIPS), Ann Arbor, MI. Wierman, Mark J. and William J. Tastle (2005), "Consensus and Dissension: Theory and Properties." North American Fuzzy Information Systems Processing Conference (NAFIPS), Ann Arbor, MI.
http://isedj.org/6/35/
March 14, 2008
ISEDJ 6 (35)
Tastle, Russell, and Wierman
8
TABLES TABLE 1: CONSENSUS RESULTS UNDER VARIOUS POPULATION DISTRIBUTIONS Cns Dis SA A N D SD wMean wStdDev Consensus Dissent 1
6
6
3.0000
8.0000
0.0000
1.0000
2
6
1
5
2.9167
5.6146
0.0492
0.9508
3
6
2
4
2.8333
5.2083
0.0996
0.9004
4
5
1
2
4
2.9167
4.3241
0.1468
0.8532
5
5
1
2
4
2.4167
2.3241
0.4437
0.5563
6
1
5
2
4
2.7500
1.3611
0.6103
0.3897
7
1
5
4
2
2.5833
0.9907
0.6866
0.3134
8
6
5
1
9
9
3
10
12
2.5833
0.6146
0.7676
0.2324
2.2500
0.3750
0.8553
0.1447
2.0000
0.0000
1.0000
0.0000
TABLE 2(A): STUDENT ISSUES INCLUDED IN THE SAMPLE STUDY Question Category 1
Appearance (Personal Attire)
2
Professional Attire
3
Grooming
4
Body Language
5
Introduction
6
Enunciation and tone
7
Vocabulary
8
Group presence
9
Asked or responded to questions well
10
Organized
11
Good eye contact
12
Attentive
13
Friendly
14
Asked appropriate questions or provided questions
15
Answer are appropriate and correct
c 2008 EDSIG
http://isedj.org/6/35/
March 14, 2008
ISEDJ 6 (35)
Tastle, Russell, and Wierman
9
TABLE 2(B): RAW STUDENT RESPONSES Raw Student Responses by Student Number Q
1
2
3
4
5
6
7
8
9
10 11 12 13 14 15 16 17 18 19 20 21
1
5
5
5
5
5
5
4
3
5
5
4
4
5
5
4
5
5
5
5
5
2
2
4
4
5
4
4
4
3
3
4
5
5
5
5
4
4
4
4
5
4
4
3
3
4
4
5
4
4
4
4
3
4
5
4
4
5
4
4
4
5
5
4
4
4
4
3
4
5
4
4
4
4
3
5
5
4
5
5
4
4
5
4
5
5
4
4
5
3
5
5
4
3
4
4
4
5
5
4
4
5
4
4
5
4
5
4
4
4
6
3
3
5
3
3
3
3
3
3
4
4
4
5
3
3
4
3
5
5
3
3
7
3
4
5
4
3
4
4
3
4
4
4
4
4
4
3
4
4
4
4
4
4
8
4
4
5
5
4
4
4
3
5
5
4
5
5
4
3
4
4
5
5
4
3
9
4
4
4
4
4
4
4
3
4
4
4
4
4
4
4
4
4
4
4
4
4
10
4
5
5
5
4
5
4
3
5
5
5
5
5
5
4
5
5
4
5
5
5
11
4
4
5
4
3
4
4
3
5
5
4
5
5
4
3
5
4
5
5
4
3
12
4
4
5
4
4
4
4
4
4
5
4
5
5
4
3
5
4
5
5
4
3
13
4
4
4
5
4
4
4
4
4
4
4
5
4
4
4
4
4
5
4
4
4
14
5
4
5
5
5
5
5
4
5
5
5
4
5
5
4
5
4
5
5
5
5
15
5
5
5
5
5
5
5
4
5
5
5
4
5
5
4
5
4
5
5
5
5
TABLE 2(C): TABULATION AND ANALYSIS Statistics
Count Q
Tot
1
2
3
4
5
wMean
wStDev
Cns%
1
96
0
1
1
4
15
4.5714
0.8345
73.6%
2
87
0
0
3
12
6
4.1429
0.6122
80.1%
3
88
0
0
1
15
5
4.1905
0.3741
84.8%
4
90
0
0
2
11
8
4.2570
0.5918
78.3%
5
89
0
0
2
12
7
4.2381
0.5578
79.7%
6
75
0
0
13
4
4
3.5714
0.9388
71.0%
7
81
0
0
4
16
1
3.8571
0.3265
87.1%
8
89
0
0
3
10
8
4.2381
0.7007
76.5%
9
83
0
0
1
20
0
3.9524
0.0907
96.5%
10
98
0
0
1
5
15
4.6667
0.4762
81.1%
11
88
0
0
4
9
8
4.1905
0.8027
74.9%
12
89
0
0
2
12
7
4.2381
0.5578
79.7%
13
87
0
0
0
18
3
4.1429
0.2449
90.5%
14
100
0
0
0
5
16
4.7619
0.3628
86.0%
15
101
0
0
0
4
17
4.8095
0.3084
88.1%
c 2008 EDSIG
http://isedj.org/6/35/
March 14, 2008