of applying data mining techniques to build intrusion de- ..... Let F1 be service, src dst or dst host other .... rent one, the percentage of different services, the.
A Data Mining Framework for Building Intrusion Detection Models∗ Wenke Lee Salvatore J. Stolfo Kui W. Mok Computer Science Department, Columbia University 500 West 120th Street, New York, NY 10027 {wenke,sal,mok}@cs.columbia.edu
Abstract There is often the need to update an installed Intrusion Detection System (IDS) due to new attack methods or upgraded computing environments. Since many current IDSs are constructed by manual encoding of expert knowledge, changes to IDSs are expensive and slow. In this paper, we describe a data mining framework for adaptively building Intrusion Detection (ID) models. The central idea is to utilize auditing programs to extract an extensive set of features that describe each network connection or host session, and apply data mining programs to learn rules that accurately capture the behavior of intrusions and normal activities. These rules can then be used for misuse detection and anomaly detection. New detection models are incorporated into an existing IDS through a meta-learning (or co-operative learning) process, which produces a meta detection model that combines evidence from multiple models. We discuss the strengths of our data mining programs, namely, classification, meta-learning, association rules, and frequent episodes. We report our results of applying these programs to the extensively gathered network audit data for the 1998 DARPA Intrusion Detection Evaluation Program.
1 Introduction As network-based computer systems play increasingly vital roles in modern society, they have become the target of intrusions by our enemies and criminals. In addition to intrusion prevention techniques, such as user authentication (e.g. using passwords or biometrics), avoiding programming errors, and information protection (e.g., encryption), intrusion detection is often used as another wall to protect ∗ This research is supported in part by grants from DARPA (F3060296-1-0311) and NSF (IRI-96-32225 and CDA-96-25374).
computer systems. Intrusion detection techniques can be categorized into anomaly detection and misuse detection. Anomaly detection systems, for example, IDES [14], flag observed activities that deviate significantly from the established normal usage profiles as anomalies (i.e., possible intrusions). Misuse detection systems, for example, IDIOT [9] and STAT [5], use patterns of well-known attacks or weak spots of the system to match and identify known intrusion, patterns or signatures. While accuracy is the essential requirement of an IDS, its extensibility and adaptability are also critical in today’s network computing environment. There are multiple “penetration points” for intrusions to take place in a network system. For example, at the network level carefully crafted “malicious” IP packets can crash a victim host; at the host level, vulnerabilities in system software can be exploited to yield an illegal root shell. Since activities at different penetration points are normally recorded in different audit data sources, an IDS often needs to be extended to incorporate additional modules that specialize on certain components (e.g., hosts, subnets, etc.) of the network systems. The large traffic volume in security related mailing lists and Web sites suggest that new system security holes and intrusion methods are continuously being discovered. Therefore it is imperative that IDSs be updated frequently and timely. Currently building an effective IDS is an enormous knowledge engineering task. System builders rely on their intuition and experience to select the statistical measures for anomaly detection [13]. Experts first analyze and categorize attack scenarios and system vulnerabilities, and hand-code the corresponding rules and patterns for misuse detection. Because of the manual and ad hoc nature of the development process, current IDSs have limited extensibility and adaptability. Many IDSs only handle one particular audit data source, and their updates are expensive and slow. Some of the recent research and commercial IDSs have started to provide built-in mechanisms for customization
2 A Systematic Framework
and extension. For example, both Bro [18] and NFR [6] filter network traffic streams into a series of events, and execute scripts, e.g., Bro policy scripts and NFR’s N-Codes, that contain site-specific event handlers, i.e., intrusion detection and handling rules. The system administration personnel at each installation site must now assume the roles of both security experts and IDS builders because they are responsible for writing the correct event handling functions. Our first-hand experience with both Bro and NFR show that while these systems provide great flexibility, writing the scripts involves a lot of effort, in addition to learning the scripting languages. For example, there is no means to “debug” the scripts. These systems also handle a fixed set of network traffic event types. On a few occasions we were forced to make changes to the source code of the original IDS to handle new event types.
A basic premise for intrusion detection is that when audit mechanisms are enabled to record system events, distinct evidence of legitimate activities and intrusions will be manifested in the audit data. Because of the sheer volume of audit data, both in the amount of audit records and in the number of system features (fields of the audit records), efficient and intelligent data analysis tools are required to discover the behavior of system activities. Data mining generally refers to the process of extracting descriptive models from large stores of data [4]. The recent rapid development in data mining has made available a wide variety of algorithms, drawn from the fields of statistics, pattern recognition, machine learning, and databases. Several types of algorithms are particularly useful for mining audit data:
Our research aims to develop a more systematic and automated approach in building IDSs. We are developing a set of tools that can be applied to a variety of audit data sources to generate intrusion detection models. We take a data-centric point of view and consider intrusion detection as a data analysis process. Anomaly detection is about finding the normal usage patterns from the audit data, whereas misuse detection is about encoding and matching the intrusion patterns using the audit data. The central theme of our approach is to apply data mining programs to the extensively gathered audit data to compute models that accurately capture the actual behavior (i.e., patterns) of intrusions and normal activities. This automatic approach eliminates the need to manually analyze and encode intrusion patterns, as well as the guesswork in selecting statistical measures for normal usage profiles. More importantly, the same data mining tools can be applied to multiple streams of evidence, each from a detection module that specializes on a specific type(s) of intrusion or a specific component (e.g., a missioncritical host) of the network system, to learn the combined detection model that considers all the available evidence. Thus our framework facilitates the construction of adaptive IDSs.
Classification: maps a data item into one of several predefined categories. These algorithms normally output “classifiers”, for example, in the form of decision trees or rules. An ideal application in intrusion detection will be to gather sufficient “normal” and “abnormal” audit data for a user or a program, then apply a classification algorithm to learn a classifier that can label or predict new unseen audit data as belonging to the normal class or the abnormal class; Link analysis: determines relations between fields in the database records. Correlations of system features in audit data, for example, the correlation between command and argument in the shell command history data of a user, can serve as the basis for constructing normal usage profiles. A programmer, for example, may have “emacs” highly associated with “C” files; Sequence analysis: models sequential patterns. These algorithms can discover what time-based sequence of audit events are frequently occurring together. These frequent event patterns provide guidelines for incorporating temporal statistical measures into intrusion detection models. For example, patterns from audit data containing network-based denial-of-service (DOS) attacks suggest that several per-host and per-service measures should be included.
The rest of the paper is organized as follows. Section 2 outlines the main components of our framework. Section 3 briefly describes several data mining programs, and discusses how they can be applied to discover frequent intrusion and normal activity patterns, which are the basis for building misuse detection models and user anomaly detection models. Section 4 describes how to construct temporal and statistical features using the frequent patterns mined from audit data. Section 5 reports the results of our experiments on building intrusion detection models using the audit data from the DARPA evaluation program. Section 6 discusses related research projects. Section 7 outlines our future research plans.
We are developing a framework, first proposed in [11], of applying data mining techniques to build intrusion detection models. This framework consists of programs for learning classifiers and meta-classification [2], association rules [1] for link analysis, frequent episodes [16] for sequence analysis, and a support environment that enables system builders to interactively and iteratively drive the process of constructing and evaluating detection models. The 2
end product are concise and intuitive rules that can detect intrusions, and can be easily inspected and edited by security experts when needed. In our approach, the learned rules replace the manually encoded intrusion patterns and profiles, and system features and measures are selected by considering the statistical patterns computed from the audit data. Meta-learning is used to learn the correlation of intrusion evidence from multiple detection models, and produce a combined detection models. It is very important to point out that our framework does not eliminate the need to pre-process and analyze raw audit data, e.g., tcpdump [7] and BSM [22] output. In fact, to build intrusion detection models for network systems, our data mining programs use pre-processed audit data where each record corresponds to a high level event, e.g., a network connection or host session. Each record normally includes an extensive set of features that describe the characteristics of the event, for example, the duration of a connection, the number of bytes transfered, etc. While analyzing and summarizing raw audit data is an essential task for an IDS, we argue that generic utilities should first be developed by network and operating system experts, and made available to all IDSs as the lowest level building blocks. Bro and NFR can be regarded as examples of such robust and free utilities, as they both perform IP packet filtering and reassembling, and allow event handlers to output summarized connection records. Our framework assumes such building blocks are available when constructing IDSs.
“not found” errors, and “Jump to” instructions, etc. RIPPER [3], a classification rule learning program, generates rules for classifying the telnet connections are displayed in Table 2. Here we see that RIPPER indeed selects the unique feature values in identifying the intrusions. These rules can be first inspected and edited by security experts, and then be incorporated into misuse detection systems. The accuracy of a classification model depends directly on the set of features provided in the training data. For example, if the features hot, compromised and root shell were removed from the records in Table 1, RIPPER would not be able to produce accurate rules to identify buffer overflow connections. In [11] we showed that due to the temporal nature of network events, especially certain intrusions such as probing (e.g., port-scan, ping-sweep, etc.) and denial-of-service (e.g., ping-of-death, teardrop, etc.), adding per-host and per-service temporal statistics resulted in significant improvement in the accuracy of the classification models. Thus, selecting the right set of system features is a critical step when formulating the classification tasks. Our strategy is to first mine the frequent sequential patterns from the network audit data, and then use these patterns as guidelines to select and construct temporal statistical features. Section 3.3 discusses this process in greater detail. 3.1.1 Meta-Classification There are several important reasons for combining multiple detection models. First, in order to avoid becoming a performance bottleneck and an easy target of “subversion”, an IDS should consist of multiple cooperative lightweight subsystems that each monitor a separate part (e.g., access point) of the entire network environment. For example, an IDS that inspects the full data contents of each IP packet and keeps track of all opened connections may run out of memory (i.e., buffers) during a DOS attack (e.g., SYN flood) and cease to function. On the other hand, a more lightweight IDS that only inspects the header of each IP packet can detect only those intrusions that are targeted to the network protocols, and not those that try to exploit the hosts (e.g., guess password, buffer overflow, etc.). A solution is to have one relatively lightweight system on the gateway that checks only the packet headers, and several host-based systems that monitor the activities on the mission-critical hosts. A “global” detection system can then combine the evidence from these subsystems and take appropriate actions. We believe that the best way to make intrusion detection models adaptive is by combining existing models with new models that are trained on new intrusion data or new normal data (e.g., audit data from a new network component), instead of restarting the entire model building process using the aggregate of the archived audit data and new data.
3 Mining Audit Data In this section we describe our data mining algorithms, and illustrate how to apply these algorithms to generate detection models from audit data. Here audit data refers to pre-processed timestamped audit records, each with a number of features (i.e., fields).
3.1 Classification Intrusion detection can be thought of as a classification problem: we wish to classify each audit record into one of a discrete set of possible categories, normal or a particular kind of intrusion. Given a set of records, where one of the features is the class label (i.e., the concept), classification algorithms can compute a model that uses the most discriminating feature values to describe each concept. For example, consider the telnet connection records shown in Table 1. Here, hot is the count of access to system directories, creation and execution of programs, etc, compromised is the count of file/path 3
label normal normal guess normal overflow normal guess overflow normal ...
service telnet telnet telnet telnet telnet telnet telnet telnet telnet ...
flag SF SF SF SF SF SF SF SF SF ...
hot 0 0 0 0 3 0 0 3 0 ...
failed logins 0 0 6 0 0 0 5 0 0 ...
compromised 0 0 0 0 2 0 0 2 0 ...
root shell 0 3 0 0 1 0 0 1 0 ...
su 0 1 0 0 0 0 0 0 0 ...
duration 10.2 2.1 26.2 126.2 92.5 2.1 13.9 92.5 1248 ...
... ... ... ... ... ... ... ... ... ... ...
Table 1. Telnet Records RIPPER rule guess :- failed logins >= 5. overflow :- hot = 3, compromised = 2, root shell = 1. ... normal :- true.
Meaning If number of failed logins is greater than 5, then this telnet connection is “guess”, a guessing password attack. If the number of hot indicators is 3, the number of compromised conditions is 2, and a root shell is obtained, then this telnet connection is a buffer overflow attack. ... If none of the above, then this connection is “normal”.
Table 2. Example RIPPER Rules from Telnet Records time am am am am am am am am am am
We use Meta-learning [2] as a mechanism to inductively learn the correlation of predictions by a number of base detection models (i.e., classifiers). The resulting metaclassifier thus combines the detection power of all the base detection models. This approach has been extensively studied [21] and empirically evaluated in a related domain of fraud detection and has been shown to be an effective and scalable approach.
3.2 Association Rules There is empirical evidence that program executions and user activities exhibit frequent correlations among system features. For example, certain privileged programs only access certain system files in specific directories [8], programmers edit and compile C files frequently, etc. These consistent behavior patterns should be included in normal usage profiles. The goal of mining association rules is to derive multifeature (attribute) correlations from a database table. Given a set of records, where each record is a set of items, support(X) is defined as the percentage of records that contain item set X. An association rule is an expression X → Y, [c, s] [1]. Here X and Y are item sets, and X ∩ Y = ∅, s = support(X ∪ Y ) is the support of the ) rule, and c = support(X∪Y support(X) is the confidence. Table 3 shows the shell input commands during one telnet session by a secretary. Here we keep only the file-
am am am ... am
hostname pascal pascal pascal pascal pascal pascal pascal pascal pascal pascal ... pascal pascal pascal ... pascal
command mkdir cd vi tex mail subject vi vi mail subject ... vi latex dvips ... logout
arg1 dir1 dir1 tex vi fredd progress tex tex williamf progress ... tex tex dvi ...
arg2
...
-o ...
Table 3. Shell Command Records name extensions, remove the (input) contents of mail bodies and files, and use “am” to represent all the morning timestamps. Not all associations are relevant in analyzing program or user behavior (for example, hostname = pascal → arg1 = tex). We utilized the “schema” level information about the audit records to direct the pattern mining process. Observe that certain features are essential in describing the data, 4
while others provide only “auxiliary information”. For example, in shell command data, since the combination of the exact time and command uniquely identifies each record, command is an essential feature; likewise, in network connection data, the combination of the features timestamp, source and destination hosts, source port, and service (destination port) uniquely identifies a connection record. Thus, they can be the essential features. We argue that the “relevant” association rules should describe patterns related to the essential features. We call these essential features(s) axis features when they are used as a form of item constraint. We restrict the association rules to only output rules that include axis attribute values. In practice, we need not designate all essential features as the axis features. For example, some network analysis tasks require statistics about various network services while others may require the patterns related to the hosts. We can use service as the axis feature to compute the association rules that describe the patterns related to the services of the connections. In the case of shell command records, we use command as the axis feature. Table 4 shows some example association rules from the shell command data in Table 3. Each of these association rules conveys information about the user’s behavior. The rules mined from each telnet/login session (of the same user) can be merged into an aggregate rule set to form the user’s normal profile. Section 5.3 details our experiments of using association rules for anomaly detection.
ously described. Then it generates the frequent serial patterns from these associations. Thus, our approach combines the associations among features and the sequential patterns among the records into a single rule. Another interesting schema-level fact about audit records is that some essential features can be the references of other features. These reference features normally carry information about some “subject”, and other features describe the “actions” that refer to the same “subject”. For example, if we want to study the sequential patterns of connections to the same destination host, then dst host is the “subject” and service is the action. In this case, we can designate dst host as the reference feature. When forming an episode, our program tests the condition that, within the episode’s minimal occurrences, the event records covered by its constituent item sets have the same reference feature value.
4 Feature Construction We use the mined frequent episodes from network connection records as guidelines to construct temporal statistical features for building classification models. Raw tcpdump output are first summarized into network connection records using pre-processing programs, where each record has a set of “intrinsic” features. For example, the duration, service, src host and dst host (source and destination hosts), src port (source port), src bytes and dst bytes (number of data bytes), a f lag indicating normal or error status according to the protocols, etc., are intrinsic features of a single connection. Table 5 shows examples of connection records. Note that these “intrinsic” features are for general network analysis purposes, and not specific to intrusion detection. We apply the frequent episodes program to both normal connection data and intrusion data, and compare the resulting patterns to find the “intrusion only” patterns. The details of the pattern comparison algorithm is described in [12]. Briefly, since the number of patterns may be very large and there are rarely exactly matched patterns from two data sets, this heuristic algorithm considers two episodes related to two different sets of axis features as more different, and outputs (the user-specified) top percentage of the most “intrusion only” patterns. As an example, consider the syn flood attack records shown in Table 5. Here the attacker used many spoofed source addresses to send a lot of S0 connections (i.e., only the first SYN packet is sent) to a port (e.g., http) of the victim host in a very short time span (e.g., all in timestamp 1.1). Table 6 shows the top intrusion only pattern, produced using service as the axis feature and dst host as the reference feature. Each of these intrusion patterns is used as a guideline
3.3 Frequent Episodes There is often the need to study the frequent sequential patterns of network events in order to understand the nature of many attacks. We use frequent episodes to represent the sequential audit record patterns. Given a set of timestamped event records, where each record is a set of items, an interval [t1 , t2 ] is the sequence of event records that starts from timestamp t1 and ends at t2 . The width of the interval is defined as t2 − t1 . Let X be a set of items, an interval is a minimal occurrence of X if it contains X and none of its proper sub-intervals contains X. Define support(X) as the ratio between the number of minimum occurrences that contain X and the total number of event records. A frequent episode rule is the expression X, Y → Z, [c, s, w] [15]. Here X, Y and Z are item sets, and they together form an episode. s = support(X∪Y ∪Z) ∪Z) is the support of the rule, and c = support(X∪Y support(X∪Y ) is the confidence. The width of each of the occurrences must be less than w. We introduced several extentions to the original frequent episodes algorithm. Our extended algorithm computes frequent sequential patterns in two phases. First, it finds the frequent associations using the axis features(s) as previ5
Association rule command = vi → time = am, hostname = pascal, arg1 = tex, [1.0, 0.28] command = subject → time = am, hostname = pascal, arg1 = progress, [1.0, 0.11]
Meaning When using vi to edit a file, the user is always (i.e. 100% of the time) editing a tex file, in the morning, and at host pascal; and 28% of the command data has this pattern. The subject of the user’s email is always ((i.e. 100% of the time) about “progress”, in the morning, and at host pascal; and 11% of the command data has this pattern.
Table 4. Example Association Rules from Shell Command Data timestamp 1.1 1.1 1.1 1.1 1.1 1.1 1.1 ... 10.1 12.3 13.4 13.7 15.2 ...
duration 0 0 0 0 0 0 0 ... 2 1 60 1 1 ...
service http http http http http http http ... ftp smtp telnet smtp http ...
src host spoofed 1 spoofed 2 spoofed 3 spoofed 4 spoofed 5 spoofed 6 spoofed 7 ... A B A B D ...
dst host victim victim victim victim victim victim victim ... B D D C A ...
src bytes 0 0 0 0 0 0 0 ... 200 250 200 200 200 ...
dst bytes 0 0 0 0 0 0 0 ... 300 300 12100 300 0 ...
flag S0 S0 S0 S0 S0 S0 S0 ... SF SF SF SF REJ ...
... ... ... ... ... ... ... ... ... ... ... ... ... ... ...
Table 5. Network Connection Records for adding additional features into the connection records to build better classification models. We use the following automatic procedure for parsing a frequent episode and constructing features:
This “syn flood” pattern results in the following additional features: a count of connections to the same dst host in the past 2 seconds, and among these connections, a percentage of those that have the same service, and percentage of those that have the “S0” f lag. An open problem here is how to decide the right time window value w. We mine sequential patterns using different w values, for example, from 0.1 to 20 with an increment of 1, and plot the number of patterns generated at each run. Our experience show that this plot tends to stabilize after the initial sharp jump. We call the smallest w in the stable region w0 . In [11], we reported experiments of using different w values to calculate temporal statistical features for classification models. Our results showed the plot of accuracy of the classifier also stabilizes after w ≥ w0 and tend to taper off. Intuitively, a requirement for a good window size is that its set of sequential patterns is stable, that is, sufficient patterns are captured and noise is small. We therefore use w0 for adding temporal statistical features. In order to construct the appropriate features to detect an intrusion, we need to select the right axis and reference features to generate the most distinguishing and useful intrusion patterns. This could be a bottleneck in building effective models since it requires empirical evaluation. We have implemented a feature construction system, described
• Assume F0 (e.g., dst host) is used as the reference feature, and the width of the episode is w seconds. • Add the following features that examine only the connections in the past w seconds that share the same value in F0 as the current feature: – A count of these connections; – Let F1 be service, src dst or dst host other than F0 . If the same F1 value (e.g., “http”) is in all the item sets of the episode, add a percentage of connections that share the same F1 value as the current connection; otherwise, add a percentage of different values of F1 . – Let V2 be a value (e.g., “S0”) of a feature F2 (e.g., f lag) other than F0 and F1 . If V2 is in all the item sets of the episode, add a percentage of connections that have the same V2 ; otherwise, if F2 is a numerical feature, add an average of the F2 values. 6
Frequent episode (service = http, f lag = S0, dst host = victim), (service = http, f lag = S0, dst host = victim) → (service = http, f lag = S0, dst host = victim) [0.93, 0.03, 2]
Meaning 93% of the time, after two http connections with S0 flag are made to host victim, within 2 seconds from the first of these two, the third similar connection is made, and this pattern occurs in 3% of the data
Table 6. Example Intrusion Pattern in [12], to support the iterative procedure of pattern mining and comparison, feature construction from patterns, and model building and evaluation. In each iteration, we choose a different data mining strategy regarding the choices of axis and reference features. These choices are limited among the “essential” features (see Section 3.2), that is, service, dst host, src dst, or src port. Since intrusions are generally targeted to some victim host(s) in the network, the system starts with service and dst host.
by a local unprivileged user, for example, various of buffer overflow attacks, • PROBING, surveillance and probing, for example, port-scan, ping-sweep, etc. In addition, there were anomalous user behavior such as “a manager becomes (i.e., behaves like) a system administrator”. 5.1.1 Data Pre-processing
5 Experiments
We used Bro as the packet filtering and reassembling engine. We extended Bro to handle ICMP packets, and made changes to its packet fragment inspection modules since it crashed when processing data that contains teardrop or ping-of-death attacks. We implemented a Bro “connection finished” event handler to output a summarized record for each connection. Each connection record includes these “intrinsic” features: its time, duration, service, src host, dsth ost, src port, wrong f ragment (fragmentation error, e.g., fragment size is not multiple of 8 bytes, or the offsets are overlapped, etc.), f lag (how the connection is established and terminated). We used Bro event handlers to examine the telnet sessions, and extract the shell commands of the users. We further pre-processed the shell commands by replacing timestamps with am, pm, and nt (for night), and eliminated the input (i.e., contents) of edit and sendmail commands, and kept only the filename extensions. Table 3 shows examples of the processed command data. These shell command records were used for user anomaly detection, to be discussed in Section 5.3.
We participated in the DARPA Intrusion Detection Evaluation Program, prepared and managed by MIT Lincoln Labs. The objective of this study was to survey and evaluate the state of the art in research in intrusion detection. A standard set of extensively gathered audit data, which includes a wide variety of intrusions simulated in a military network environment, is provided by DARPA. Each participating site was required to build intrusion detection models or tweak their existing system parameters using the training data, and send the results (i.e., detected intrusions) on the test data back to DARPA for performance evaluation. We report our experience here.
5.1 The DARPA data We were provided with about 4 gigabytes of compressed tcpdump data of 7 weeks of network traffic. This data can be processed into about 5 million of connection records of about 100 bytes each. The data contains content (i.e., the data portion) of every packet transmitted between hosts inside and outside a simulated military base. BSM audit data from one UNIX Solaris host for some network sessions were also provided. Four main categories of attacks were simulated, they are:
5.2 Misuse Detection The training data from DARPA includes “list files” that identify the timestamp, source host and port, destination host and port, and the name of each attack. We used this information to select intrusion data to perform pattern mining and feature construction, and to label each connection record with “normal” or an attack type to create training data for building classification models. Since the amount of audit data is huge, for example, some days have several millions of connection records due
• DOS, denial-of-service, for example, ping-of-death, teardrop, smurf, syn flood, etc., • R2L, unauthorized access from a remote machine, for example, guessing password, • U2R, unauthorized access to local superuser privileges 7
to the nasty DOS attacks, we did not aggregate all the connection records into a single training data set. Instead, we extracted all the connection records that fall within a surrounding time window of plus and minus 5 minutes of the whole duration of each attack to create a data set for each attack type. We also randomly extracted sequences of normal connections records to create the normal data set.
are embedded in the data portions of the packets and normally involve only a single connection. Therefore, it is unlikely that they can have any unique frequent traffic patterns. In other words, our automatic feature construction process failed to produce any features for these attacks. After studying the outcome of this mining process, we focussed our attention to the content of the connections. In the Bro event handlers, we added functions that inspect data exchanges of interactive TCP connections (e.g., telnet, ftp, smtp, etc.). These functions assign values to a set of “content” features to indicate whether the data contents suggest suspicious behavior. These features are: number of failed logins, successfully logged in or not, whether logged in as root, whether a root shell is obtained, whether a su command is attempted and succeeded, number of access to access control files (e.g., “/etc/passwd”, “.rhosts”), number of compromised states on the destination host (e.g., file/path “not found” errors, and “Jump to” instructions, etc.), number of hot indicators, (e.g., access to system directories, creation, and execution of programs, etc.), and number of outbound connections during a f tp session. Our approach here is to include an extensive set of indicators, and then let classification programs decide which minimal set of discriminating features should be used to identify intrusions.
5.2.1 Manual and Automatic Feature Construction Following the feature construction approach described in Section 4, for each attack type, e.g., syn flood, port-scan, etc., we performed pattern mining and comparison using its intrusion data set and the normal data set. We constructed appropriate features according to the intrusion only patterns. Here we summarize the temporal and statistical features automatically constructed by our system: • The “same host” feature that examine only the connections in the past 2 seconds that have the same destination host as the current connection: – the count of such connections, the percentage of connections that have the same service as the current one, the percentage of different services, the percentage of the S0 flag, and the percentage of the REJ (i.e., rejected connection) flag;
5.2.2 Detection Models It is evident that different categories of intrusions require different sets of constructed features in order to be detected. We therefore built classification models using different feature sets:
• The “same service” features that examine only the connections in the past 2 seconds that have the same service as the current connection: – the count of such connections, the percentage of different destination hosts, the percentage of the S0 flag, and the percentage of the REJ flag.
• The “traffic” model: each connection record contains the “intrinsic” and the “traffic” features. Table 7 shows some example labeled connection records. The resultant RIPPER classifier detects the DOS and PROBING attacks. Table 8 shows some example RIPPER rules.
We call these the (time-based) “traffic” features for connection records. There are several “slow” PROBING attacks that scan the hosts (or ports) using a much larger time interval than 2 seconds, for example, one in every minute. As a result, these attacks did not produce intrusion only patterns with the time window of 2 seconds. We sorted these connection records by the destination hosts, and applied the same pattern mining and feature construction process. In stead of using a time window of 2 seconds, we now used a “connection” window of 100 connections, and constructed a mirror set of “host-based traffic” features as the (timebased) “traffic” features. We discovered that unlike most of the DOS and PROBING attacks, the R2L and U2R attacks don’t have any “intrusion only” frequent patterns. This is because most of the DOS and PROBING attacks involve sending a lot of connections to some host(s) in a very short period of time, and therefore can have frequent sequential patterns that are different from the normal traffic. The R2L and U2R attacks
• The host-based “traffic” model: each connection record contains the “intrinsic” and the host-based “traffic” features. The resultant RIPPER classifiers detect the slow PROBING attacks. • The “content” model: each connection record contains the “intrinsic” and the “content” features. Table 1 shows some example labeled connection records. The resultant RIPPER classifier detects the R2L and U2R attacks. Table 2 shows some example RIPPER rules. These classification models each specialize to a certain type of intrusion. We then constructed a meta-level classifier to combine these detection models. Each meta-level training record consists of four features, the three predictions each from one of the base models, plus the true class label (i.e., “normal” and an attack type). RIPPER was then 8
label normal smurf satan normal ...
service ecr i ecr i user-level http ...
flag SF SF REJ SF ...
host count 1 350 231 1 ...
srv count 1 350 1 0 ...
host REJ % 0 0 85% 0 ...
host diff srv % 1 0 89% 1 ...
duration 0 0 0 3 ...
... ... ... ... ... ...
Table 7. Example “Traffic” Connection Records RIPPER rule smurf :- service=ecr i, host count ≥ host srv count ≥ 5.
5,
satan :- host REJ % ≥ 83%, host diff srv % ≥ 87%.
Meaning If the service is icmp echo request, and for the past 2 seconds, the number of connections that have the same destination host as the current one is at least 5, and the number of connections that have the same service as the current one is at least 5, then this is a smurf attack (a DOS attack). If for the connections in the past 2 seconds that have same the destination host as the current connection, the percentage of rejected connections are at least 83%, and the percentage of different services is at least 87%, then this is a satan attack (a PROBING attack).
Table 8. Example RIPPER Rules for DOS and PROBING attacks applied to learn the rules that combine the evidence from the “traffic”, host-based “traffic”, and “content” classifiers to make a (final) prediction on a connection. The resulting meta-level rules basically use the predictions from the “content” model to detect R2L and U2R attacks, and the combination of “traffic” and host-based “traffic” models to detect the DOS and (fast and slow) PROBING attacks. That is, the meta-classifier predicts a connection as an attack of R2L or U2R whenever the “content” model does so; and an attack of DOS or PROBING whenever the “traffic” model does so, or whenever the “traffic” model predicts “normal” but the host-based model predicts a PROBING attack. Model content traffic host traffic
# of features in records 22 20 14
# of rules 55 26 8
point out that not all features in the connection records were selected by RIPPER. This is because RIPPER, like most classification algorithms, has a built-in “feature selection” process to select the most discriminating and generalizable features according to their statistical significance and performance (e.g., in a hold-out test dataset that simulates the “unseen/future” data). Because of the large amount of audit data, a human expert is not able to manually gather and test various statistics, and thus tend to do a poor job in selecting the features. As a result, hand crafted “signature” rules tend to be very specific to a small intrusion data set. Alternative classification algorithms that compute underlying probability distributions may indeed require all features be evaluated in their resultant models. A crucial issue here is the tradeoff between model accuracy and model cost. The RIPPER output indicates that some features are irrelevant and hence we need not compute these at run-time, thus reducing the cost of detection. This is the subject matter of our ongoing research.
# of features in rules 11 4+9 1+5
Table 9. Model Complexities 5.2.3 Results
Table 9 summarizes the complexity of the base models in terms of the number of features in a connection record, the number of RIPPER rules produced, and the number of distinct features actually used in the rules. The numbers in bold, for example, 9, indicate the number of automatically constructed temporal and statistical features being used in the RIPPER rules. We see that for both the “traffic” and host-based “traffic” models, our feature construction process contribute the majority of the features. We should
We report the performance of our detection models as evaluated by MIT Lincoln Labs. We trained our intrusion detection models, i.e., the base models and the meta-level classifier, using the 7 weeks of labeled data, and used them to make predictions on the 2 weeks of unlabeled test data (i.e., we were not told which connection is an attack). The test data contains a total of 38 attack types, with 14 types in test data only (i.e., our models were not trained with instances 9
70
100 90
60 80 70 Detection Rate
Detection Rate
50 40 Columbia Group1 Group2 Group3
30
60 50 40 30
20
Columbia Group1 Group2 Group3
20 10 10 0
0
0.05
0.1 False Alarm Rate
0.15
0
0.2
0
0.05
(a) DOS 70
70
60
60
0.2
50 Columbia U2R Group3 U2R Group3 R2L Group1 R2L Columbia R2L
50 40
Detection Rate
Detection Rate
0.15
(b) PROBING
80
30
40 Columbia Group1 Group3
30 20
20
10
10 0
0.1 False Alarm Rate
0
0.05
0.1 False Alarm Rate
0.15
0
0.2
(c) U2R and R2L
0
0.05
0.1 False Alarm Rate
0.15
0.2
(d) Overall
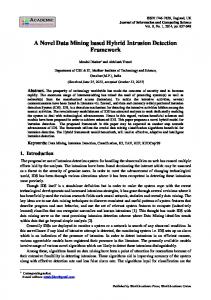
Figure 1. ROC Curves on Detection Rates and False Alarm Rates of these attack types).
models. We can see from the figure that our detection model has the best overall performance, and in all but one attack category, our model is one of the best two. However, it is also clear that all models performed very poorly on R2L attacks. For all intrusions, an overall detection rate of below 70% is hardly satisfactory in a mission critical environment.
Figure 1 shows the ROC curves of the detection models by attack categories as well as on all intrusions. In each of these ROC plots, the x-axis is the false alarm rate, calculated as the percentage of normal connections classified as an intrusion; the y-axis is the detection rate, calculated as the percentage of intrusions detected. A data point in the upper left corner corresponds to optimal performance, i.e., high detection rate with low false alarm rate. We compare here our models with other participants (denoted as Group 1 through 3) in the DARPA evaluation program. (The tested systems produced binary output, hence, the ROC’s are not continuous. These plots are duplicated from the presentation slides of a report given by Lincoln Labs in a DARPA PI meeting. The slides can be viewed on line via http://www.cs.columbia.edu/˜sal/JAM/PROJECT/MIT/mitindex.html). These participating groups used knowledge engineering approaches to build their intrusion detection
Category DOS PROBING U2R R2L Overall
Old 79.9 97.0 75.0 60.0 80.2
New 24.3 96.7 81.8 5.9 37.7
Table 10. Comparing Detection Rates (in %) on Old and New Attacks
10
Although our models were intended for misuse detection, we had hoped that the features we constructed would be general enough so that the models can detect new variations of the known intrusions. Table 10 compares the detection rates of old intrusions and new intrusions. Here new intrusions refer to those that did not have corresponding instances in the training data. We see that our models were able to detect a large percentage of new PROBING and U2R attacks, but not as effective for new DOS and R2L attacks.
most people. A user’s actions during a login session needs to be studied as a whole to determine whether he or she is behaving normally. Our initial exploratory approach is to mine the frequent patterns from user command data, and merge or add the patterns into an aggregate set to form the normal usage profile of a user. A new pattern can be merged with an old pattern if they have the same left-hand-sides and right-hand-sides, their support values are within a 5% of each other, and their confidence values are also within 5% of each other. To analyze a user login session, we mine the frequent patterns from the sequence of commands during this session. This new pattern set is compared with the profile pattern set and a similarity score is assigned. Assume that the new set has n patterns and among them, there are m patterns that have “matches” (i.e., rules that they can be merged with) in the profile pattern set, then the similarity score is simply m n . Obviously, a higher similarity score means a higher likelihood that the user’s behavior agrees with his or her historical profile.
5.2.4 Discussion PROBING attacks have relatively limited variance because they all involve making connections to a large number of hosts or ports in a given time frame. Likewise, the outcome of all U2R attacks is that a root shell is obtained without legitimate means, e.g., login as root, su to root, etc. Thus, for these two categories of attacks, given some representative instances in the training data, our data mining system was able to construct features that capture their general behavior patterns. As a result, our detection models can detect a high percentage of old and new PROBING and U2R attacks. On the other hand, DOS and R2L have a wide variety of behavior because they exploit the weaknesses of a large number of different network or system services. The features constructed based on the available attack instances are very specialized to the known attack types. Our detection models therefore missed a large number of new DOS and R2L attacks. The results here are not entirely surprising since our models are misuse detection models. We need to use anomaly detection models on network traffic or system programs to guard against the new and diversified attacks. Anomaly detection is much more challenging than misuse detection. For example, we need to first decide whether we should build normal profile for each network service or a group of services, and for each host or a groups of hosts. The feature construction process will likely to be more complex since unlike a relatively small number of “intrusion only” patterns, normal network traffic can have a large number of variations. Network anomaly detection is an important problem and an active area of research.
User sysadm
programmer1
programmer2 secretary manager1 manager2
Normal Activities logs in as root, cats the password file, and runs commands such as top. writes public domain C code, use a vi editor, compiles the C code, reads and sends mail, and executes unix commands. a similar user profile, but works in afternoons and evenings. edits latex files, runs latex, reads mail, and sends mail. reads and sends mail reads mail.
Table 11. User Descriptions The DARPA data also includes user anomaly data to evaluate anomaly detection systems. Table 11 describes the consistent behavior of the 6 users for anomaly analysis. Note that since we were the only group that performed anomaly detection on the test data, Lincoln Labs did not evaluate our results. We report our experiments on the training data here. We apply our frequent episode algorithms to the command data from each login session (of the same user), with command as the axis feature and w = 5 (i.e., we look for patterns within the range of 5 consecutive commands), to mine the frequent sequential patterns on the associations among user commands, their arguments, time segments, and hosts. We treat the first 4 weeks as a data gathering period, during which we simply merge the patterns into each user’s profiles. Each user has 3 profiles, one for the ac-
5.3 User Anomaly Detection “Insiders” misusing their privileges can be hard to detect since they don’t normally need to break-in, and IDSs and security personnel tend to focus on guarding outside attacks. Insider problems are some of the most vexing problems for security personnel. (Indeed, who checks the checkers, i.e., the person to whom the IDS reports?) It is often very difficult to classify a single event by a user as normal or abnormal because the unpredictable nature of 11
User programmer2 secretary sysadm programmer1 secretary programmer1 sysadm manager1 manager2
6 Related Work
Anomaly Description logs in from beta logs in at night logs in from jupiter becomes a secretary becomes a manager logs in at night becomes a programmer becomes a sysadm logs in from pluto
Network intrusion detection has been an on-going research area [17]. More recent systems, e.g. Bro [18], NFR [6], and EMERALD [19] all made extensibility their primary design goals. Our research focuses on automatic methods for constructing intrusion detection models. The meta-learning mechanism is designed to automate the extention process of IDSs. We share the same views discussed in [20] that an IDS should be built using standard components. We believe that the operating system and networking community should be responsible for building a robust “Event” box. In [10], algorithms for analyzing user shell commands and detecting anomalies were discussed. The basic idea is to first collapse the multi-column shell commands into a single stream of strings, and then string matching techniques and consideration of “concept drift” are used to build and update user profiles. We believe that our extended frequent episodes algorithm is a superior approach because it considers both the association among commands and arguments, and the frequent sequential patterns of such associations.
Table 12. User Anomaly Description
User programmer2 secretary sysadm programmer1 secretary programmer1 sysadm manager1 manager2
Normal (0.58, 0.79) (∞, ∞) (0.84, 0.95) (0.31, 1.00) (0.41, 0.98) (∞, ∞) (0.64, 0.95) (0.57, 1.00) (1.00, 1.00)
Anomaly 0.00 0.00 0.00 0.04 0.17 0.00 0.00 0.00 0.00
7 Conclusions and Future Directions
Table 13. Similarity with User’s Own Profile
In this paper, we outline a data mining framework for constructing intrusion detection models. The key idea is to apply data mining programs to audit data to compute misuse and anomaly detection models, according to the observed behavior in the data. To facilitate adaptability and extensibility, we propose the use of meta-learning as a means to construct a combined model that incorporate evidence from multiple (lightweight) base models. This mechanism makes it feasible to introduce new ID components in an existing IDS possibly without significant re-engineering. We extend the basic association rules and frequent episodes algorithms to accommodate the special requirements in analyzing audit data. Our experiments show that the frequent patterns mined from audit data can be used as reliable user anomaly detection models, and as guidelines for selecting temporal statistical features to build effective classification models. Results from the 1998 DARPA Intrusion Detection Evaluation Program showed our detection models performed as well as the best systems built using the manual knowledge engineering approaches. Our future work includes developing network anomaly detection strategies, and devising a mechanical procedure to translate our automatically learned detection rules into modules for real-time IDSs. A preliminary project in collaboration with NFR has just started.
tivities of each time segment (am, pm, and nt). We treat the 5th week as the training period, during which we compare the patterns from each session to the profile of the time segment. We record the normal range of the similarity scores during this week. The data in the 6th week has some user anomalies, as described in Table 12. For each of the anomalous sessions, we compare its patterns against the original user’s profile, and then compare the resulting similarity score against the recorded normal range of the same time segment. In Table 13, the column labeled “Normal” is the range of similarity of each user against his or her own profile as recorded during the 5th week. A ∞ here means that the user did not login during the time segment in the 5th week. The column “Anomaly” is the similarity measure of the anomalous session described Table 12. We see that all anomalous sessions can be clearly detected since their similarity scores are much smaller than the normal range. For example, when the sysadm becomes programmer (see Table 12), his/her patterns have zero matches with the sysadm’s profile, while for the whole 5th week, the pm similarity scores are in the range of 0.64 to 0.95. Unfortunately, formal evaluation statistics are not available to determine the error rates of this approach. However, this initial test indicates a path worthy of future study. 12
8 Acknowledgments
[15] H. Mannila and H. Toivonen. Discovering generalized episodes using minimal occurrences. In Proceedings of the 2nd International Conference on Knowledge Discovery in Databases and Data Mining, Portland, Oregon, August 1996. [16] H. Mannila, H. Toivonen, and A. I. Verkamo. Discovering frequent episodes in sequences. In Proceedings of the 1st International Conference on Knowledge Discovery in Databases and Data Mining, Montreal, Canada, August 1995. [17] B. Mukherjee, L. T. Heberlein, and K. N. Levitt. Network intrusion detection. IEEE Network, May/June 1994. [18] V. Paxon. Bro: A system for detecting network intruders in real-time. In Proceedings of the 7th USENIX Security Symposium, San Antonio, TX, 1998. [19] P. A. Porras and P. G. Neumann. Emerald: Event monitoring enabling responses to anomalous live disturbances. In National Information Systems Security Conference, Baltimore MD, October 1997. [20] S. Stainford-Chen. Common intrusion detection framework. http://seclab.cs.ucdavis.edu/cidf. [21] S. J. Stolfo, A. L. Prodromidis, S. Tselepis, W. Lee, D. W. Fan, and P. K. Chan. JAM: Java agents for meta-learning over distributed databases. In Proceedings of the 3rd International Conference on Knowledge Discovery and Data Mining, pages 74–81, Newport Beach, CA, August 1997. AAAI Press. [22] SunSoft, Mountain View, CA. SunSHIELD Basic Security Module Guide.
We wish to thank our colleagues at Columbia University, Chris Park, Wei Fan, and Andreas Prodromidis, for their help and encouragement.
References [1] R. Agrawal, T. Imielinski, and A. Swami. Mining association rules between sets of items in large databases. In Proceedings of the ACM SIGMOD Conference on Management of Data, pages 207–216, 1993. [2] P. K. Chan and S. J. Stolfo. Toward parallel and distributed learning by meta-learning. In AAAI Workshop in Knowledge Discovery in Databases, pages 227–240, 1993. [3] W. W. Cohen. Fast effective rule induction. In Machine Learning: the 12th International Conference, Lake Taho, CA, 1995. Morgan Kaufmann. [4] U. Fayyad, G. Piatetsky-Shapiro, and P. Smyth. The KDD process of extracting useful knowledge from volumes of data. Communications of the ACM, 39(11):27–34, November 1996. [5] K. Ilgun, R. A. Kemmerer, and P. A. Porras. State transition analysis: A rule-based intrusion detection approach. IEEE Transactions on Software Engineering, 21(3):181– 199, March 1995. [6] N. F. R. Inc. Network flight recorder. http://www.nfr.com, 1997. [7] V. Jacobson, C. Leres, and S. McCanne. tcpdump. available via anonymous ftp to ftp.ee.lbl.gov, June 1989. [8] C. Ko, G. Fink, and K. Levitt. Automated detection of vulnerabilities in privileged programs by execution monitoring. In Proceedings of the 10th Annual Computer Security Applications Conference, pages 134–144, December 1994. [9] S. Kumar and E. H. Spafford. A software architecture to support misuse intrusion detection. In Proceedings of the 18th National Information Security Conference, pages 194– 204, 1995. [10] T. Lane and C. E. Brodley. Sequence matching and learning in anomaly detection for computer security. In AAAI Workshop: AI Approaches to Fraud Detection and Risk Management, pages 43–49. AAAI Press, July 1997. [11] W. Lee and S. J. Stolfo. Data mining approaches for intrusion detection. In Proceedings of the 7th USENIX Security Symposium, San Antonio, TX, January 1998. [12] W. Lee, S. J. Stolfo, and K. W. Mok. Mining in a data-flow environment: Experience in intrusion detection. submitted for publication, March 1999. [13] T. Lunt. Detecting intruders in computer systems. In Proceedings of the 1993 Conference on Auditing and Computer Technology, 1993. [14] T. Lunt, A. Tamaru, F. Gilham, R. Jagannathan, P. Neumann, H. Javitz, A. Valdes, and T. Garvey. A real-time intrusion detection expert system (IDES) - final technical report. Technical report, Computer Science Laboratory, SRI International, Menlo Park, California, February 1992.
13