INTERNATIONAL JOURNAL OF RESEARCH IN COMPUTER APPLICATIONS AND ROBOTICS www.ijrcar.com
Vol.3 Issue.3, Pg.: 118-124
March 2015
INTERNATIONAL JOURNAL OF RESEARCH IN COMPUTER APPLICATIONS AND ROBOTICS ISSN 2320-7345
AN APPROACH OF ARTIFICIAL NEURAL NETWORKS FOR PREDICTION OF GENERALIZED ANXIETY DISORDER M.SRIBALA Sr.Asst.Professor Department of Computer Science and Engineering Lakireddy Balireddy College of Engineering Mylavaram Krishna Dt.
[email protected] ABSTRACT: - Anxiety disorders are most rapidly increasing in the present society. Among them one of the serious disorders is GAD stands for Generalized Anxiety Disorder which is observed in various cases of people. We have implemented Artificial Neural Networks using sensitivity analysis and without using sensitivity analysis for developing of better predictive models for GAD. The results were observed that sensitivity analysis improves the performance of neural networks when compared with without using sensitivity analysis.
Keywords: - Anxiety disorders, sensitivity analysis, Data mining, artificial neural networks 1. INTRODUCTION It is very important to regulate emotions of people in the society. Now a days so many emotional disorders were present in all the people starting from women, children and adults. They are suffering from a lot of stress, anxiety etc. Some of the disorders if we don’t predict prior itself they leads to the severe disorders like depression and schrezophinia etc. From the last 2 decades good research was conducted in this wing and several models were produced for emotional disorders [1]. These are mainly categorized as mood and anxiety disorders. Here we are developing predictive models for anxiety disorder category that is Generalized Anxiety Disorder (GAD) by implementing artificial neural networks. They can produce better class predictive models for any disease. We are implementing this using a machine learning tool with a clinical dataset of 66 subjects. They are so many kinds of anxiety disorders. 1) Panic Disorder 2) Obsessive compulsive disorder 3) Generalized anxiety disorder 4) Social anxiety disorder For our research we are taking GAD the most common disorder which is existing in all cases of patients .Symptoms include uneasiness, stress, anxiety etc[2].
2. GENERALIZED ANXIETY DISORDER This disorder includes excessive, unrealistic worry and tension for very small reasons. Generalized anxiety disorder (GAD) is a Kind of continuous anxiety and worry for small and different events and activities. Generalized anxiety disorder (GAD) is a common condition. Family history and genetically issues are also a cause of anxiety disorders. Stress increases anxiety so it plays a major role for developing this disorder .Any person of any age can develop this disorder, even children. Most people with the disorder report that they have
M.Sribala
Page 118
INTERNATIONAL JOURNAL OF RESEARCH IN COMPUTER APPLICATIONS AND ROBOTICS www.ijrcar.com
Vol.3 Issue.3, Pg.: 118-124
March 2015
been anxious for as long as they can remember. It occurs more often in women than in men. The main symptom is continuous worry or tension, without any small cause. Worries seem to float from one problem to another, which are family and relationship issues, work related issues, money and health problems. Other symptoms includes concentration is difficult, highly irritable, problems in sleep, always feeling restless. Along with the worries and anxieties, a number of physical problems may also be present, including muscle tension such as shakiness, headaches and stomach problems like diarrhoea[3][4][5].
3. DATA MINING Data mining is considered as an important of information management and technology and it is method to extract, analyze the data, patterns in a large relational database. The main steps are listed below [7]. 3.1. Data selection Depending on objectives and subjects of the work extract and identify relevant data from the database. 3.2. Data integration Integrate sources of data obtained from various places. 3.3. Data purification and cleansing Select delete and filter through volumes of datasets for inappropriate or inconsistent data. 3.4. Data transformation Transform data into the acceptable data format for data mining. 3.5. Data Mining Apply Data mining techniques to build suitable model. 3.6. Model evaluation Use measurement tools to evaluate accuracy of the model. 3.7. Display of knowledge Use graphical representation to visualize and present the knowledge discovered in front of users [8].
4. ARTIFICIAL NEURAL NETWORKS Neural networks are designed by the Inspiration of the working of the brain. These networks with parallel & distributed processing (PDP) architecture and inspired by the working of the brain these are large collection of simple processing units (neurons) and local connections between units. There is no central control processing unit. Here the information processed in a parallel and distributed way. They are capable of performing computations, including universal computations. They are also capable of “learning” by changing the relative strengths of connections between neurons. The main types of neural networks are
feed forward neural networks, feed backward networks and The combination of both.
The main applications of neural networks are given below. 4.1. Function approximation here the estimation of non-linear function mapping input to output without the need to specify functional form is done. 4.2. Regression Here the main task is time series prediction. 4.3. Classification The main task under this are pattern recognition, image classification & reconstruction. Here back propagation is a supervised learning technique used and is most suitable in diagnostic and predictive problems. BPNN involves multi-layer topology that includes an input layers hidden layer, hidden layer and an output layer. 4.5. Research methodology
M.Sribala
Page 119
INTERNATIONAL JOURNAL OF RESEARCH IN COMPUTER APPLICATIONS AND ROBOTICS www.ijrcar.com
Vol.3 Issue.3, Pg.: 118-124
March 2015
This experiment is divides into 3 different stages. First stage includes data collection and pre-processing .Data obtained from patients using DSM IV standard questionnaire. Total 66 samples were collected based on the questionnaire .Missing and incomplete data is removed. Second stage includes obtaining predictive models on datasets. To get predictive models we have used a machine learning and data mining tool Clementine V11.1 from SPSS. We integrated 66 samples with possible 14 factors which are noting but attributes. First we implemented NN without using sensitivity analysis and next we have applied on the data .It is a technique to improve the predictive model accuracy. Third stage includes presenting results. The results were produced using graphs compared and analysed. The following diagram shows the 3 different stages pictorially.
Stage 1 Collection data, pre-processing and screening produce training datasets.
Stage 2 Use artificial neural networks for prediction by using Sensitivity analysis and without using it .
Stage 2 Produce results analyze them
4.6. Attribute description Here attributes are divides into 2 categories. 1. General attributes 2. Attributes related to DSM IV standard questionnaire.[16]. General attributes Attribute
type
Description
Age
Symbol 0-2
0-below 18,1 for above 18 to 60 and 2 for above 60.
Zender
Symbol 0-1
1 for male and 2 for female
Occupation
Symbol 0-2
0 for unemployed,1 for employed and 2 for retired.
Working hours
Symbol 0-1
0 is 8 hrs
Score
Symbol 0-8
Depending upon the answers answered by the patients in the
M.Sribala
Page 120
INTERNATIONAL JOURNAL OF RESEARCH IN COMPUTER APPLICATIONS AND ROBOTICS www.ijrcar.com
Vol.3 Issue.3, Pg.: 118-124
March 2015
questionnaire, the score is calculated. Min value is 6 and max value is 8.
Symbol y/n
Disordered
Depending on the above attribute score disordered or not is decided. Y for disordered and N for not.
4.7. Attributes based on DSM IV questionnaire Attribute
type
Description
Nervous,
Symbol 0-1
Not Being Able To Stop Or Control Worrying
Symbol 0-1
1 for YES and 0 for NO
Worrying Too Much About Different Things
Symbol 0-1
1 for YES and 0 for NO
Symbol 0-1
1 for YES and 0 for NO
Symbol 0-1
1 for YES and 0 for NO
Symbol 0-1
1 for YES and 0 for NO
Feeling Anxious
Trouble Relaxing
Becoming Annoyed Irritable
Easily Or
Feeling Afraid As If Something might Happen
1 for YES and 0 for NO
5. TRAINING AND TESTING OF NEURAL NETWORK Here we have implemented neural networks for performing predictive modelling, here the input layer consisting all of the input fields or variables which are used to predict the outcome variables. The output layer consisting an output field which is the target field of the prediction. The hidden layer consisting a number of neurons where the outputs from the previous layer. A network can be having any number of hidden layers. All neurons in one layer in the network are connected to all neurons within the next layer when the network is in the learning stage. The following figure provides details of implementation of neural network using Clementine 11.0.[9][10]. Clementine V11.0 provides two different types of supervised neural networks, one is Multi-Layer Perceptron (MLP) and the second one Radial Basis Function Network (RBFN). There are five different
M.Sribala
Page 121
INTERNATIONAL JOURNAL OF RESEARCH IN COMPUTER APPLICATIONS AND ROBOTICS www.ijrcar.com
Vol.3 Issue.3, Pg.: 118-124
March 2015
algorithms available within the Neural Net node of Clementine but this paper has used the most widely used method called Quick method. Here in the Quick method feed-forward back-propagation network is used, the topology of this network is based on the number and types of the input and output fields. To prevent the problems like over-training in neural networks, randomly selected proportion of the training data is used to train the network. The data pass repeatedly through the network, and then the network learn patterns that exist in the sample only and thus over-train. Hence the network becomes too specific to the training sample data. Here the randomly selected proportion of the training data of the network is used to train the network and once the proportion of data has made a complete pass through the network, the remaining part of the data is reserved as a test set which is to evaluate the performance of the current neural network architecture.[16].
6. SENSITIVITY ANALYSIS It can provide a way of understanding of relationships of attributes and objectives. Here we can input a different set of parameters, variable and values that can produce different outcomes. This method analyzes and reflects the sensitivity degree of how the outcome of the model can be apportioned and altered to different circumstances of variation. The main objectives of sensitivity analysis are 1. Delete variables that have no or less influence to neural network while in training to reduce network complexity. 2. Understanding the degree of influence of each and every variable to network training. As the sensitivity degree increases it shows the larger impact on the outcomes of ANN’s.
7. RESULTS AND ANALYSIS The analysis section of the generated model displays information about the neural network. Figure of the following represents the predictive accuracies of 2 neural networks using sensitivity analysis and without using it . The predicted accuracy for the neural network without sensitivity analysis is 90.323%, after implementing sensitivity analysis the accuracy became 96.429%, which is indicating the proportion of the test set correctly predicted and improving the accuracy .This study has experimented with multiple hidden layers in the neural network, containing one input layer with 15 neurons one hidden layer with three neurons. The output layer contains two neurons corresponding to the two values of the output field. The following figure shows the difference in accuracies using sensitivity analysis and without using sensitivity analysis. It is performed after the network is trained. It provides information on which input fields are most important in predicting the output field. The result of sensitivity analysis is shown below.[10][11][12][13]. 98
96.429
96 94 92
90.323
90 88 86 The above diagram represents the accuracies of neural networks using sensitivity analysis and without using it. This result indicating that it improves the performance of neural networks and predictive accuracy.
M.Sribala
Page 122
INTERNATIONAL JOURNAL OF RESEARCH IN COMPUTER APPLICATIONS AND ROBOTICS www.ijrcar.com
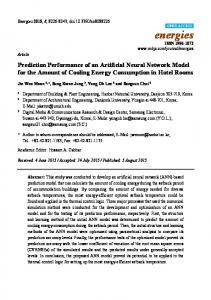
relative importance score
0.064
family history
0.044
Feeling Afraid As If…
0.012
Becoming Easily…
0.08
Being So Restless…
0.0297 0.103
Trouble Relaxing Worrying Too Much…
0.287
Not Being Able To…
0.245
Feeling Nervous,…
0.173
WORKNG_HOURS
0.009
OCCUPATION
0.052
ZENDER
0.048
AGE
0.038
relative importance
0
0.1
0.2
0.3
Vol.3 Issue.3, Pg.: 118-124
March 2015
0.4
Figure of above represents relative importance of the input variables by implementing sensitivity analysis of the generated neural network.[16]. The input fields are listed with relative importance. Importance values can range from 0.0 and 0.2, where 0.0 indicates unimportant and 0.2 and above indicates extremely important .Here we observed that “worrying too much about different things” variable is most important field than others remaining fields having more relative importance of 0.287. The generated Neural Net calculates two new fields, $NDisordered and $NC- Disordered, for every record in the input data base. The first represents the predicted Disordered (yes or no) and the second a confidence value for the prediction.
8. FUTURE SCOPE AND CONCLUSION Anxiety disorders becoming serious issue in the society. So to build an effective and efficient model is an important research problem now. The main objective of this paper is to develop an effective and efficient model for prediction of GAD and also suggests that data mining techniques can be a promising solution for disease prediction. For our future works several issues can be taken into consideration. The very first step includes effective data pre-processing, secondly the neural networks can be implemented for existing data by applying various other predictive techniques such as SVM (Support Vector Machines),genetic algorithms and develop hybrid models to improve performance and accuracy. Finally implementing the data on more no of factors [14][15[17].
9. REFERENCES [1] Anxiety Disorders National Institute of Mental Health. U.S. Department of Health and Human Services. Accessed February 5, 2010. [2] Hoffmann SG, Smits JA.Cognitive-behavioral therapy for adult anxiety disorders: a meta-analysis of randomized placebo-controlled trials. J Clin Psychiatry. 2008;69:621-632. [3] Pollack MH, Kinrys G, Delong H, Vasconcelos e Sá D, Simon NM. The pharmacotherapy of anxiety disorders. In: Stern TA, Rosenbaum JF, Fava M, Biederman J, Rauch SL, eds. Massachusetts General Hospital Comprehensive Clinical Psychiatry. 1st ed. Philadelphia,Pa: Mosby Elsevier;2008:chap 41. [4] Pubmed healthcare at http://www.ncbi.mlm.nih.gov [5] Medilineplus health at http://www.nih.gov/mediplus
M.Sribala
Page 123
INTERNATIONAL JOURNAL OF RESEARCH IN COMPUTER APPLICATIONS AND ROBOTICS www.ijrcar.com
Vol.3 Issue.3, Pg.: 118-124
March 2015
[6] Prediction of postpartum depression using multilayer perceptron’s and pruning. S.Tortajada, J.GarciaGomc2 Universidad politecnia de Valencia, Valencia, Spain. [7] Data mining learning models and algorithms for medical
[email protected]@icrs.bas.bg petiacvc.vab.es [8] Data Mining Tecniques & Concepts -by Jiawi Hau And Micheline Kambhr. [9] SPSS Clementine for data mining is institutional research. [10] Clementine 8.0user Guide. http://www.spss.com [11] Datamining by Clementine Devised by W.Ji ; updated by C.H.Bryant and IArana. [12] Exploiting data mining techniques for improving the efficiency of time series DATA using SPSS.clementine. Pushpalata pujari, jyothi balagupta [13] A comparison study between data mining tools over some classification methods. Abdullah H wahbeh, Qasem A.Al.Radaideh, Mohammed N.Al.Kahi, and Mead M.shawakfa (department of computer information systems Faculty of information technology, yarmouk university Irbil 21163, Jordon). [14] Applying decision tree and neural network to increase of dermatologic diagnosis chun-lang chang&chih-Haochen Institute of Industrial engineering and management, National Formosa University, 64 wun-Hwa road, Huwei, yunlin. [15] Analysis of heart diseases dataset using neural network approach Dr. K. Usha Rani Dept. of Computer Science Sri Padmavathi Mahila Visvavidyalayam (Women’s University) Tirupati - 517502 , Andhra Pradesh, India. [16] Prediction of Kidney Failure Using Artificial Neural Networks Adenike O. Osofisan E-mail:
[email protected]: +234-8136902165 Babatunde A. Sawyerr Oluwafemi Eweje Computer Science Department, University of Ibadan, Ibadan, Nigeria. [17] The Mood Disorder Questionnaire (MDQ) Robert M. A. Hirschfeld, MD (University of Texas Medical Branch), at American Journal of Psychiatry. (Hirschfeld R, Williams JB, Spitzer RL, et al. Development and validation of a screening instrument for bipolar spectrum disorder:The Mood Disorder Questionnaire. Am J Psychiatry. 2000; 157; 1873-1875.) [18] A Neural Network based Approach for Predicting Customer Churn in Cellular Network Services Anuj Sharma,Dr. Prabin Kumar Panigrahi, Information Systems Area Indian Institute of Management, Indore, India.
A Brief Author Biography M.Sri Bala working as a Sr.Asst.Professor at department of CSE at Lakireddy Balireddy college of Engineering. She completed her Master of Computer Applications at Indira Gandhi National Open University and M.tech from Campus College Acharya Nagarjuna University.
M.Sribala
Page 124