LATEST TRENDS on COMPUTERS (Volume I)
Application of Neural Networks to Damage Classification in Composite Structures Mahmoud Z. Iskandarani Faculty of Engineering Al-Zaytoonah Private University of Jordan P O BOX: 911597, Post Code: 11191, Amman Jordan
[email protected] Abstract: - Smart classification software is designed to process data taken for damaged composite structures such as modern car bodies. This software is used in conjunction with Neural Networks algorithms to provide predictive models for impact damage in composite structures. The developed neural models correlates between various NDT testing techniques, such that in the absence of one technique, its results can be predicted by the Neural Network through interrogation of available data obtained from using other testing methods. Key-Words: - Neural Networks, Classification, Damage, Composites, Algorithm, Prediction.
1 Introduction Predictive and deterministic analysis is an important tool in reliability tests. Components can experience a successful or unsuccessful performance. In both conventional and advanced interpreting systems, initial steps have to be taken to determine the parameters that govern the criteria under which a component can be ranked or classified. Typical considerations are [1-4]: (1) (2) (3) (4) (5) (6) (7)
Some model selection processes are mainly based on statistical techniques such as discriminant analysis, canonical correlation, principal component, regression on principal component and stepwise procedures. The previous highlights the need for an intelligent classification system, which is flexible enough to accommodate different boundary conditions with complex non-linear behavior in a fast and accurate manner with capabilities of generalization and prediction [5-8]. In recent years there has been a rapid development of models and intelligent systems for complex pattern recognition. In this paper Neural Networks are used in conjunction with a novel Smart Classification Algorithm (SCA) to correlate, classify and predict composite structures conditions using wide range of testing technique.
Arranging defect types in terms of their significance in influencing failure. Organising the tested components according to their theoretical propensity of failure. Tabulating untested components based on their tendency of failure. Classification of the known test results into either success or failure population. Establishing a model and assess the model in terms of correct classifications. Modifying the manufacturing process to obtain less defective components. Testing of new components and updating the model as needed.
2 Experimental Testing resin injection molded (RIM) samples response to impact damage was carried out using the following techniques:
In addition to the above, various separate probability distributions can be involved, namely: (1) (2) (3)
(1) (2) (3) (4)
The probability that a specific defect of certain size will result in a failure. The probability that inspection will succeed for those defects of importance. The probability that there is a flaw in the material or component Prior to inspection.
ISSN: 1792-4251
Low Frequency Tapping. Visual Imaging. Low Temperature Thermoimaging. Tensile Strength.
SCA was used on each data file to produce a fingerprint. The collated data was then fed to the designed Neural Structures.
109
ISBN: 978-960-474-201-1
LATEST TRENDS on COMPUTERS (Volume I)
Training of the Networks was carried out using Back Propagation Algorithm. The algorithm implements the following expression in computing and correcting error or difference in between predicted and actual data:
A1 B1 X1 A B X 2 2 2 S1 = , S 2 = …., S m = ….(3) An Bn X n
dE (t ) + (α dW (t − 1)) ……. (1) dW (t ) = −η + dW (t )
From (3) we obtain:
Where:
n
S1T = ∑
dW : Neural Net Weight Change.
i =1
η : Learning Rate (0 to 1) α : Weight Change Coefficient (Magnitude)
Ai
θ
, S 2T =
n
Bi
∑θ
,… S mT =
i =1
n
Xi
∑θ
.. (4)
i =1
Where: θ is a normalizing factor.
E : Error As the original matrix is simplified in (4), the data classification column matrix is represented in equation (5).
The last term in equation (1) is a momentum term that includes a proportion of the last weight updated in the current one, which has the effect of preventing ripples in the error surface and adds speed to training and convergence.
S1T S 2T ………………(5) D= S mT
The initial raw data is conditioned before entering into the Neural Networks using the SCA algorithm, which utilizes matrix equations, where individual data matrices that correspond to different testing techniques are grouped into an overall matrix as follows: In the SCA algorithm, the converted data file is converted into sequences S1 to Sm containing vectors of individual column matrices extracted from the converted source data file. The overall extracted matrix consists of discrete combination of all column sequences as in equation (2)
S1 a .r 11 11 a 21 .r21 a n1 .rn1
S2 a12 .r12 a 22 .r22
a n 2 .rn 2
a1m .r1m a 2 m .r2 m a nm .rnm
The designed classification algorithm takes into account reference, undamaged sample data in its operations.
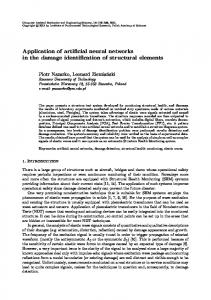
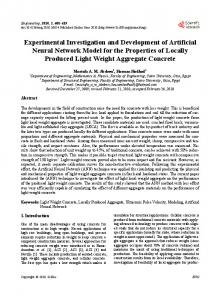
3 Results Table (1) shows the testing data using the mentioned four techniques. The data is used to train the networks. Figure (1) illustrates the initial neural network used for training, while Figure (2) illustrates a neural network with two hidden layers for better classification accuracy.
Sm
(2)
Where: aij
:
Original matrix elements
rij
:
Amplitude Factor Fig.1: Single Hidden Layer Neural Model.
From (2) we obtain:
ISSN: 1792-4251
110
ISBN: 978-960-474-201-1
LATEST TRENDS on COMPUTERS (Volume I)
Impact Energy
Sample Thickness
Tensile Strength
%SCA
%SCA
Low Frequency
Thermoimaging
Defect Diameter
(J)
mm
N/mm
No Units
No Units
mm
7.14
2
205.16
74.5
28.60
0.727
7.14
5
208.30
91.5
24.98
0.573
14.3
2
190.00
67.0
35.40
1.210
14.3
5
206.78
87.5
30.05
0.858
28.6
2
150.74
49.2
46.02
2.840
28.6
5
205.67
59.5
35.01
1.540
42.0
2
150.68
46.0
46.04
2.850
42.0
5
180.96
57.4
39.92
1.970
47.6
2
150.68
29.0
46.04
2.850
47.6
5
153.44
37.0
45.07
2.710
The overall system is devised to make use of the five human senses to classify damage in composites whereby the absence of one sense is complemented by the experience gained which is redistributed among the other senses. This system makes full use of the associative and predictive properties of Neural Networks.
Fig.2: Dual Hidden Layer Neural Model.
Table1: Training data Avg. Error
4 Discussion &Conclusion Table (2) shows the predicted data using the networks shown in Figures (1) and (2) with learning curve shown in Figure (3). From the table, it is observed that a very good predication is achieved using Neural Networks. Figure (4) shows another implementation of the Neural Networks in deciding whether to accept or reject a component by using all or some of the input techniques used earlier. This provides a fast process of testing and production. This emphasizes the point that Neural Networks are useful tools in data processing and would be invaluable if the received data is corrupted or part of it is missing. For the application discussed in this paper, Neural Networks served to save time and effort in determining the extent of damage in composite structures. It also helped in establishing a way of determining if a composite body such as a vehicle is fit for service. In addition, by using the associative and predictive features of such algorithms manufacturing time and cost would be saved [9-14]. It is concluded that choice of the type of Neural Networks to use is quite important, factors like speed of convergence, maximum and average errors and time of training are very critical. Pruning the designed network to achieve a balance between speed and accuracy is usually recommended.
ISSN: 1792-4251
Time
Fig.3: Learning Curve.
Fig.4: Damaged/Undamaged decision Neural Network.
111
ISBN: 978-960-474-201-1
LATEST TRENDS on COMPUTERS (Volume I)
Impact Energy
Sample Thickness
Tensile Strength
N/mm
%SCA
%SCA
Low Frequency
Thermoimaging
No Units
No Units
Defect Diameter
(J)
mm
mm
7.14
2
204.42
78.0
28.32
0.647
7.14
5
208.65
92.0
26.08
0.587
14.3
2
191.92
63.6
35.11
1.317
14.3
5
206.58
84.9
29.20
0.877
28.6
2
150.08
42.0
45.83
2.807
28.6
5
202.05
63.7
35.20
1.438
42.0
2
149.73
40.3
46.03
2.830
42.0
5
183.02
51.3
40.37
2.032
47.6
2
149.70
40.1
46.04
2.831
47.6
5
153.94
42.8
45.14
2.709
Table2: Predicted data
Impact Energy
Sample Thickness
Tensile Strength
%SCA
%SCA
Low Frequency
Thermoimaging
Defect Diameter
(J)
mm
Ratio
Ratio
Ratio
Ratio
7.14
2
0.996
1.047
0.990
0.890
7.14
5
1.000
1.005
1.044
1.024
14.3
2
1.010
0.949
0.992
1.088
14.3
5
0.999
0.970
0.972
1.022
28.6
2
0.996
0.854
0.996
0.988
28.6
5
0.983
1.071
1.005
0.934
42.0
2
0.994
1.115
0.998
0.993
42.0
5
0.995
0.894
1.011
1.031
47.6
2
0.994
1.383
1.000
0.993
47.6
5
1.003
1.157
1.002
1.000
Table3: Ratio between actual and predicted data values.
ISSN: 1792-4251
112
References: 1]Tshilidzi Marwala, S. Chakraverty, Fault classification in structures with incomplete measured data using autoassociative neural networks and genetic algorithm, CURRENT SCIENCE, Vol. 90, No. 4, 2006, pp. 542-548. [2]I. Jung, GA. Wang, Pattern classification of back-propagation algorithm using exclusive connecting network, Int. J. Comp. Sci. Eng., VOL.2, NO.2, 2008, pp. 76-80. [3] E. Sancak, Prediction of bond strength of lightweight concretes by using artificial neural networks, Scientific Research and Essay, Vol.4, No.4, 2009, pp.256-266. [4] C. Zang, M.I. Friswell, M. Imregun, Structural Health Monitoring and Damage Assessment Using Measured FRFs from Multiple Sensors, Part II: Decision Making with RBF Network, Key Engineering Materials Vols.245-246, 2003, pp.141148. [5] V. Albuquerque, P. Cortez, A. Alexandria, W. Aguiar, Image segmentation system for quantification of microstructures in metals using artificial neural networks, Revista Matéria, Vol.12, No.2, 2007, pp.394-407. [6] R. Biernacki, J. Kozłowski, D. Myszka, M. Perzyk, Prediction of properties of austempered ductile iron assisted by artificial neural network, Materials Science (Medžiagotyra), Vol.12, No.1, 2006, pp.11-15. [7] O. Wang, J. Lai a, D. Sun, Artificial neural network models for predicting flow stress and microstructure evolution of a hydrogenized titanium alloy, Key Engineering Materials, Vol.353, 2007, pp.541-544. [8] J. Davim, J. Rubio, A. Abrão, A novel approach based on digital image to evaluate the delamination factor after drilling compositen laminates, Composites and Science and Technology, Vol.67, 2007, 1939-1945. [9] J. Lee, S. Kim, Structural damage detection in the frequency domain using neural networks, Journal of Intelligent Materials Systems and Structures, Vol. 18, 2007, pp. 785-792. [10] Z. Li, X.Yang, Damage identification for beams using ANN based on statistical property of structural responses, Computers and Structures, Vol. 86, 2008, pp. 64-71. [11] Y. Liu, A. Li, Q. Fei, Y. Ding, Feature extraction and damage alarming using time series analysis, Journal of Southeast University, Vol. 23, No.1, 2007, pp. 86-91. [12]K. Nair, A. Kiremidjian, Time series based structural damage detection algorithm using
ISBN: 978-960-474-201-1
LATEST TRENDS on COMPUTERS (Volume I)
Gaussian mixtures modeling, Journal of Dynamic Systems, Measurement, and Control, Vol. 129, 2007, pp. 285-293. [13] Q. Liu, C. Xun, N. Gindy, Fuzzy pattern recognition of AE signals for grinding burn, International Journal of Machine Tools & Manufacture, Vol.45, 2005, pp.811-818. [14] J. Kwak, M. Ha, Neural network approach for diagnosis of grinding operation by acoustic emission and power signals, Journal of Materials Processing Technology, Vol.147, 2004, pp.65-71.
ISSN: 1792-4251
113
ISBN: 978-960-474-201-1