MATEC Web of Conferences 120, 01010 (2017)
DOI: 10.1051/ matecconf/201712001010
ASCMCES-17
Artificial earthquake record generation using cascade neural network Khaldoon A. Bani-Hani1,*, and Mu'ath I. Abu Qamar2 1Civil 2Civil
Engineering, Jordan University of Science & Technology, Irbid, Jordan Engineering, Yarmouk University, Irbid, Jordan.
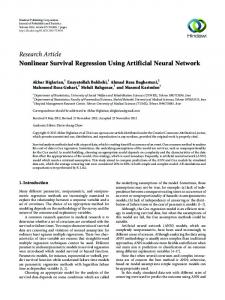
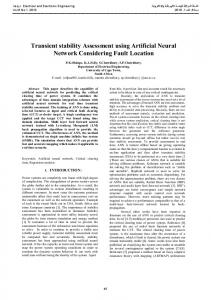
Abstract. This paper presents the results of using artificial neural networks (ANN) in an inverse mapping problem for earthquake accelerograms generation. This study comprises of two parts: 1-D site response analysis; performed for Dubai Emirate at UAE, where eight earthquakes records are selected and spectral matching are performed to match Dubai response spectrum using SeismoMatch software. Site classification of Dubai soil is being considered for two classes C and D based on shear wave velocity of soil profiles. Amplifications factors are estimated to quantify Dubai soil effect. Dubai's design response spectra are developed for site classes C & D according to International Buildings Code (IBC -2012). In the second part, ANN is employed to solve inverse mapping problem to generate time history earthquake record. Thirty earthquakes records and their design response spectrum with 5% damping are used to train two cascade forward backward neural networks (ANN1, ANN2). ANN1 is trained to map the design response spectrum to time history and ANN2 is trained to map time history records to the design response spectrum. Generalized time history earthquake records are generated using ANN1 for Dubai's site classes C and D, and ANN2 is used to evaluate the performance of ANN1.
1 Introduction Design of structures to withstand seismic activity is mostly depends the results of seismic hazard analysis and site response analysis [1]. This analysis is conducted on sites of interest by calculating and measuring the factors that affect the study site conditions by the seismic waves that initiated at the bedrock level [2]. In general, the seismic activity originated on bedrock is amplified due to the soil geology and soil profile. This might produce divesting seismic waves with significant impacts on structures. The site investigation and seismic hazard analysis are the most critical phases in earthquake engineering design and analysis [3, 4]. UAE has minor seismic activity and few of them were recorded, however, the neighbouring areas are described as active seismic areas, such as Iran, Afghanistan and Oman. The importance of considering the seismic design in UAE is increasing due to the *
Corresponding author:
[email protected]
© The Authors, published by EDP Sciences. This is an open access article distributed under the terms of the Creative Commons Attribution License 4.0 (http://creativecommons.org/licenses/by/4.0/).
MATEC Web of Conferences 120, 01010 (2017)
DOI: 10.1051/ matecconf/201712001010
ASCMCES-17 remarkable expansion and investment in huge infrastructure and mega constructions like the Palm Island, Jumeira, and Burj Khalifa. For this reason UAE municipality and structural engineers in UAE starts to include the seismic design part in their projects and monitoring and recording of seismic activities. Municipality of Dubai, for example, provides the construction sites by reports of soil investigation that were performed at selected sites to be utilized for seismic hazards analysis. In this study, the soil column profile and boreholes reports, for Dubai, are adopted from recent work by Irfan [1]. Around 36 boreholes from Dubai area in this study were most of the boreholes depths stretched between 15 m to 30 m. This paper presents an inverse mapping problems solution. Most engineering problems are fundamentally inverse problems. The inverse problems is to determine the input from the output of a system or to determine the system characteristics from the measured input and output of the system (system identification). Artificial Neural Networks are employed in this study to perform inverse mapping problem to obtain generalized time history for design response spectra using ANN.
2 Methodology
Spectral Response Acceleration Sa (g)
As mentioned above, soil conditions have major effect on seismic waves propagated from bedrock. The soil characteristics are responsible of earth vibration differences for different sites even though the source is the same at the bedrock. The process of analysing the waves at this level is called the site response analysis [3]. The response characteristics of specific site undergone site response analysis mainly depends on the soil column geology. Therefore, results’ variation are expected for site response analysis from one site to another. This result suggests conducting a site-specific response analysis for each structures to be constructed. To do so, time, money and efforts would be compromise and it is really would be unpractical to be carried out for each site under study. To simplify the work with reliable and affordable method, building codes introduce ‘site amplification factors’ that can replace and account for the amplification or de-amplification of the seismic waves due to site geotechnical properties. The National Earthquake Hazard Reduction Program [5] presents maps for North American region that give an estimate to the site amplification factors Strong ground motions records are essential to execute a comparable linear and nonlinear dynamic analysis of critical structures. The response of the structures under several time history records for different earthquakes are estimated using DeepSoil [6]. The ground time histories motion are tuned to match the target response spectrum for specific site with particular site condition. Probabilistic Seismic Hazard Analysis (PSHA) is a stochastic method that can produce the target response spectrum for this goal. 1.8 Bedrock Response Spectra - Layer 9
1.6
Surface Response Spectra - Layer 1 1.4 1.2 1 0.8 0.6 0.4 0.2 0 0
0.2
0.4
0.6
0.8
1
1.2
1.4
1.6
1.8
2
Period (T) Seconds
Fig. 1. A comparison between response spectra at surface and bedrock to quantify local site effect.
2
MATEC Web of Conferences 120, 01010 (2017)
DOI: 10.1051/ matecconf/201712001010
ASCMCES-17 The site response analysis is usually conducted for particular sites using the estimated ground motions at the bedrock level. The amplification or de-amplification factors can be measured as the ratio between the bedrock spectrum and the estimated surface response spectrum as shown in Figure 1 and Figure 3. 2.1 Spectral matching Spectral matching is to tune the selected records to match target response spectrum. This was conducted using SeismoMatch [7]; a software available freely for research The spectral matching conducted in the time domain where the source record is calibrated to be compatible with the site-specific response spectrum [8]. Spectral matching has been under research for several years; several approaches are proposed and discussed [4]. Some of these methods perform the matching in time domain and others do the work in frequency domain. Some current software that are commonly used to perform this such as EZFRISK, RSP Match EDT and SeismoMatch use the time domain method to adjust the accelerograms. To achieve spectral matching two inputs are required: (a) Target response spectrum computed by seismic hazard analysis. This spectrum is referred to as target because the generated accelerograms are tuned and adjusted to have a response spectrum compatible with this response spectrum. (b) A number of accelerograms chosen carefully to be tuned and customized to the target response spectrum. Eight historical records were selected for the Dubai study area. The response spectrum of these accelerograms were generated and matched to the target spectrum to find the best record that provide the most compatible response spectrum concerning spectrum shape and confidence in de-aggregation results [1]. The eight time history records selected here are available in PEER (Pacific Earthquake Engineering Research). Dubai's target response spectrum was defined and SeismoMatch v.2.1 was utilized to generate the required matched records. The historical records names and corresponding information used for matching are given in Table 1. Table 1. Time histories selected for spectral matching Magnitude (Source PEER). Earthquake
PGA (g)
Distance (km)
Mag.
Chi-Chi, Taiwan-02, 17:57, 09-19-79 Morgan Hill, 1984-04-24, 21:15 Irpinia, Italy-02 1980-11-23 19:35 Coalinga-01 1983-05-02 23:42 N. Palm Springs 1986-07-08 09:20 Whittier Narrows-01 1987-10-01 14:42 Griva, Greece 1990-12-21 06:58 Chi-Chi, Taiwan-06 1999-09-25 23:52
0.1173 0.1017 0.1062 0.1127 0.1056 0.1126 0.1038 0.1190
27 27 23 29 39 30 33 26
5.90 6.19 6.20 6.36 6.06 5.99 6.10 6.30
Acceptable spectral matching results was achieved with the eight ground motion records for Dubai city. The target response spectrum and the generated matched spectrum are in perfect agreement and have relatively closer trends as depicted in Figure 2.
3
MATEC Web of Conferences 120, 01010 (2017)
DOI: 10.1051/ matecconf/201712001010
Spectral Response Acceleration (g)
ASCMCES-17 0.7 0.6 0.5 0.4 0.3 0.2 0.1 0 0
0.2
0.4
0.6
0.8
1
1.2
1.4
1.6
1.8
2
Period (T) Seconds
Fig. 2. Matching response of selected records on Dubai response spectrum.
2.2 Site response analysis One dimensional linear site response analysis was conducted for 36 boreholes from Dubai city using DeepSoil software. Considering the spatial distribution sites for Dubai, the borehole logs were chosen for site analysis [1]. The propagated ground motion through soil profiles defined using the boreholes data in Dubai, are used to find the response of soils and their effect such as amplification factors. Site amplification factors were estimated following the recommendations of IBC2012, where the spectral response at 0.2 and 1s periods are required as shown in Figure 3. Finding the ratio between two response spectra, Fa and Fv can be calculated for all sites used in this study. To show the effect of soil profile on seismic waves propagating from the bedrock, such as response spectra comparison between bedrock and surface spectra, PGA of input record through soil column, and shear wave velocity through soil column. These effects are presented in Figure 3. (b) -2
2
-5
1.5
Soil Depth (m)
-5 -8
-10
-11
1
-15
-14
Fa
-17
Fv
0.5
(c) 0
0
Bedrock Response Spectra Surface Response Spectra
Soil Depth (m)
Spectral Response Acceleration Sa (g)
(a) 2.5
-20
-20 0 0.01
0.2
Period (T) Seconds
1
-23 0.1 0.15 0.2 0.25 0.3 0.35 0.4
Peak Ground Acceleration (g)
-25 695 705
715
725
735
Shear wave velocity (m/s)
Fig. 3. (a) Response spectra on surface and half space, (b) effect of soil on PGA of input earthquake record, (c) Shear wave velocity (m/sec) Versus Depth (m).
The amplification factors are calculated for each time history and the average value was determined as shown in Table 2. Additionally, the response spectrum of each matched records are computed and the average spectrum is estimated to compute the corresponding
4
MATEC Web of Conferences 120, 01010 (2017)
DOI: 10.1051/ matecconf/201712001010
ASCMCES-17 short (0.2s) and 1-second periods (S s and S 1 ). Figure 4 and 5 show how the S s and S 1 for the records are estimated for the two soil classes. Table 2. Amplification factors based on selected time histories for Dubai. Amplification Factor
Fa
Fv
DeepSoil – Class D
1.390
4.350
DeepSoil– Class C
0.961
1.812
Based on the response spectrum generated and the estimated S s and S 1 , the short periods (S MS ) and at 1 second (S M1 ) are computed for site class C and D using IBC 2012 recommendations. The final design response spectrum for sites that classified as "C & D" at Dubai city is depicted on Figure 4 and 5.
SDs = 0.3948
Spectral Response Acceleration (g)
Ss = 0.426
Sa = 0.114 + 4.935 T
0.4
0.5
0.3
S1 = 0.033
0.3
0.2
0.2
0.1
0.1 0 0
0.2
0.4
0.6
0.8
1
1.2
1.4
1.6
1.8
0
2
Sa = (0.0957 / T)
Ts = 0.2424
0.4
To = 0.0485
Spectral Response Acceleration (g)
0.5 Average Response Spectrum 0.6
0
SD1 = 0.0957
0.2
0.4
Period (T) Seconds
0.6
1
0.8
1.2
1.4
Period (T) Seconds
1.6
1.8
2
0.5
0.5 0.4 0.3 S1 = 0.0287 0.2 0.1 0 0
0.2
0.4
0.6
0.8
1
1.2
1.4
1.6
1.8
2
SDs = 0.3948 Sa = 0.114 + 4.935 T
0.4
0.3
0.2
0.1
0
Sa = (0.0957 / T)
Ts = 0.2424
Ss = 0.447
0.6
To = 0.0485
Average Response Spectrum
Spectral Response Acceleration (g)
Spectral Response Acceleration (g)
Fig. 4. Average response spectrum and the corresponding design response spectrum for Dubai – Site Class C.
0
SD1 = 0.0957
0.2
0.4
0.6
0.8
1
1.2
1.4
1.6
1.8
2
Period (T) Seconds
Period (T) Seconds
Fig. 5. Average response spectrum and the corresponding design response spectrum for Dubai – Site Class D.
5
MATEC Web of Conferences 120, 01010 (2017)
DOI: 10.1051/ matecconf/201712001010
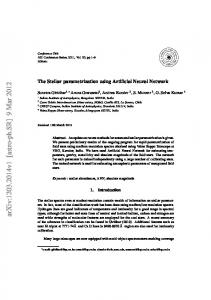
ASCMCES-17 2.3 Generation of artificial earthquake records using (ANN) Construction of an artificial neural network capable of producing a reasonable artificial accelerogram is the theme of this research. Artificial neural network is an intelligent system that realizes the general relation between set of inputs and outputs points through training process. The idea of using artificial neural network is inspired by the nerve cells in the human brain. The evolution of ANN modelling go through three stages: training, validation, and testing. Neural network training mechanism is shown in the Figure 6.
End Model
Divide Training, Validation and Testing Data
Initial Weights
Activation Function
Output Layer
Errors
Stopping Criteria
Weight Modification
Tested
Fig. 6. Schematic chart showing the neural network training mechanism.
To train ANN that can learn the inverse problem between the design response spectrum and the corresponding accelerograms, thirty historically novel records are utilized and verified. The time histories records employed in the training both neural networks are described in Table 3. The training data were prepared by discretizing the accelerograms at 0.02 seconds with strong motion durations of 10 seconds. To control the duration for all accelerograms, points with zero amplitude were embedded to all accelerograms to achieve similar number of discrete points in training data. All the acceleration response spectra were computed using DeepSoil for 5% damping. The design response spectra also discretized with same number of points used in accelerograms. Table 3. Earthquake accelerograms used in training neural networks. No.
Earthquake
PGA (g)
No
Earthquake
PGA (g)
1
Chi-Chi, Taiwan-02
0.1173
16
San Fernando 1971
0.2994
0.1017 0.1062 0.1127 0.1056 0.1126 0.1038 0.1190 0.1674 0.2584 0.1474 0.2006 0.2488 0.1426 0.1861
17 18 19 20 21 22 23 24 25 26 27 28 29 30
Mammoth Lakes-01 Norcia, Italy 1979 Taiwan SMART1(5) 1981 Nahanni, Canada 1985 Kalamata, Greece-01 1986 Tabas, Iran 1978 New Zealand-02 1987 Superstition Hills-02 1987 Spitak, Armenia 1988 Cape Mendocino 1992 Landers 1992 Northridge-01 1994 Duzce, Turkey 1999 Manjil, Iran 1990
0.2818 0.1856 0.1124 0.1512 0.2649 0.1089 0.2926 0.1349 0.2071 0.1668 0.1298 0.1061 0.1305 0.1703
2 3 4 5 6 7 8 9 10 11 12 13 14 15
Morgan Hill 1984 Irpinia, Italy-02 Coalinga-01 N. Palm Springs 1986 Whittier Narrows-01 Griva, Greece 1990 Chi-Chi, Taiwan-06 1999 Helena, Montana-01 Imperial Valley-02 Trinidad 1980 Upland 1990 Loma Prieta 1989 Kobe, Japan 1995 Northern Calif-03 1954
6
MATEC Web of Conferences 120, 01010 (2017)
DOI: 10.1051/ matecconf/201712001010
ASCMCES-17 Two Cascade forward backward neural networks (ANN1 and ANN2) are constructed. ANN1 trained to learn the inverse mapping for the design response spectra obtained using DeepSoil for 5 % damping ratio for the corresponding 30 prescribed accelerograms. ANN2 trained to perform forward mapping that relate earthquake accelerograms to the design response. The methodology in training the inverse problem and the feedforward mapping and working stages are schematically depicted in Figure 7. The proposed method implemented using thirty accelerograms with PGA (0.1 – 0.3) g and design response spectra developed using Dubai amplification factors for 5% damping ratio to train the neural networks. The neural networks robustness is demonstrated when new design response spectrum is used in the ANN model. ANN1 (Inverse mapping) ANN1 Inputs: 500 discrete points, Design Response Spectra. ANN1
0.3
ANN1 Output
ANN1 Input
0.2
0.04
Acceleration (g)
ResponseSpectralAcceleration (g)
0.4
ANN1 Outputs: 500 discrete points, Earthquake Time History.
0.08
0
-0.04 0.1
-0.08 0 0
0.5
1
1.5
2
-0.12
Period(T), Second
0
Response SpectralAcceleration (g)
ANN2 Input
ANN2 Outputs: 500 discrete points, Design Response Spectra.
0 0.4
2
4
6
8
10
Time (Sec)
ANN1 Output, ANN2 Input ANN2 Inputs: 500 discrete points, Earthquake Time History.
0.3
ANN2 Output 0.2
0.1
ANN2 0 0
0.5
1
1.5
2
Period(T), Second
Fig. 7. ANN1 and ANN2 used in generating the accelerograms. In general, the accelerogram predicted using ANN1 is expected to have same characteristics of the accelerograms group used in training the neural networks, or to map the response spectrum to one of the accelerograms used in the training set. In either case, the NN predicted accelerograms are expected to provide a response spectra similar to that used as input to ANN1. If none of the previous cases true, the ANN1 will generate artificial earthquake accelerograms matched to one of the records used in the training group. Therefore, it is expected that this ANN1 to be a good replacement to many software for generating an artificially spectral-matched accelerogram. The artificially generated accelerogram retains features of accelerograms exist in the training set and it can be called generalized time history earthquake record because its response spectra is close to the response spectra that developed from a group of time histories for specific site conditions and PGA range, magnitude, and distance range.
7
MATEC Web of Conferences 120, 01010 (2017)
DOI: 10.1051/ matecconf/201712001010
ASCMCES-17
3 Results As mentioned above two cascade neural networks, ANN1 and ANN2 are trained and built to map the relationship between the accelerograms and the response spectra in both direction. Evaluation of the developed ANN capability in replicating reasonable accelerograms matched design response spectra is investigated for different earthquake records. In Figure 8, a comparison between the generated accelerogram and the original accelerogram is shown for Palm Springs time history, as can be seen the ANN1 is greatly successful in generating the accelerograms from the response spectrum of the original record. Similar results were found for other historical records. 0.15
Original record Matched record
Acceleration (g)
0.1 0.05 0
-0.05 -0.1
-0.15 -0.2
0
2
4
6
8
Time (sec)
12
10
Fig. 8. Earthquake Palm Springs, time history record before and after spectral matching.
Generated Time History Kobe, Japan 1995 using ANN1 0.08 0.06
0.6 0.5 0.4
0.04 0.02
-0.04
0.2
0
-0.08 0
0.5
1
1.5
2
2.5
Period (T) Second
3
3.5
4
-0.1
Response Spectra Generated Using ANN2 Response Spectra of Kobe Input to ANN1
0.6 0.5
0.3
0.2
-0.06 0.1
0.7
0.4
0
-0.02
0.3
Spectral Response Acceleration (g)
Response Spectra of Kobe, Japan 1995, Input to ANN1 0.7
Acceleration (g)
Spectral Response Acceleration (g)
Additionally, both neural networks are tested for generating the corresponding accelerograms from design response spectra generated using the method discussed earlier by the help of the software DeepSoil. The generalized time history record and the corresponding design response spectrum for Kobe, Japan 1995 earthquake using ANN1 and ANN2, is depicted in Figure 9. It is very clear that both cascade neural networks model are capable of producing soundly correct accelerograms, using ANN1, and the corresponding design response spectrum using ANN2
0
1
2
3
4
5
6
Time (Second)
7
8
9
10
0.1 0
0
0.5
1
1.5
2
2.5
3
3.5
4
Period (T) Second
Fig. 9. The generalized time history record and its response spectrum, Kobe, Japan 1995 using ANN1 & ANN2. In Figure 10, the trained neural networks are fed with a Dubai design response spectrum classes C and D, as input to trained neural network, and the generated accelerogram used as input to ANN2 and its response spectrum was obtained and shown. This results show that
8
MATEC Web of Conferences 120, 01010 (2017)
DOI: 10.1051/ matecconf/201712001010
ASCMCES-17 the generated accelerograms by ANN have the same characteristics of the training group set and the corresponding response spectrum is closely matched to the required design response spectrum. 0.5 Dubai Design Response Spectra Class C “Input to ANN1”
0.3 0.25 0.2 0.15 0.1 0.05 0
0
0.2
0.4
0.6
1.4
1.6
1.8
0.4
0.3
0.2
0.1
0
2
0
0.2
0.4
0.6
0.1
The Generalized Record Generated using ANN1
0.8 1 1.2 Period (T) Seconds
1.4
1.6
1.8
2
The Generalized Record Generated using ANN1
0.03
Acceleration (g)
Acceleration (g)
0.04
0.8 1 1.2 Period (T) Seconds
Dubai Design Response Spectra Class D “Input to ANN1”
Spectral Response Acceleration (g)
Spectral Response Acceleration (g)
0.4 0.35
0.02 0.01 0 -0.01 -0.02 -0.03 -0.04
0.05
0
-0.05
-0.1
-0.05 0
Spectral Response Acceleration (g)
0.45
1
2
3
4
5 6 Time (Sec)
7
8
9
10
0.7
Response Spectrum Generated using ANN2 Response spectra of Dubai Class ' C' used as ANN1 Input
0.4
-0.15 0
1
2
3
4
5 6 Time (Sec)
7
8
9
10
3.5
4
Response Spectra Generated using ANN2 Response spectra of Dubai Class ' D' used as ANN1 Input
Spectral Response Acceleration (g)
-0.06
0.6
0.35
0.5
0.3
0.4
0.25 0.2
0.3
0.15
0.2
0.1
0.1
0.05 0
0
0.5
1
1.5
2
2.5
3
3.5
4
0
0
0.5
1
1.5
2
2.5
3
Period (T) Second
Period (T) Second
Fig. 10. The generalized time history record and its response spectra, Dubai class C and D. using ANN1 & ANN2. ANN1 and ANN2 were verified with earthquake response spectra not used in the training set group to demonstrate the generality and soundness of the method. In other words, when new input spectrum that was not enclosed in the training data used as input, the NN will act in two different strategies. The neural network selects an accelerogram from the training pool if its response spectrum was close to the input spectrum, or when there is no similar response spectrum matched accelerogram in the training set, the neural network model will generate artificially matched spectrum accelerogram based on the characteristics it learned from training set. The above discussed examples embrace both categories mentioned above. Finally it is safe to say that practically the trained neural network is successful of producing artificial earthquake time history records corresponds to any novel design response spectrum maintain the desired response spectrum characteristics and close to the input response spectrum.
9
MATEC Web of Conferences 120, 01010 (2017)
DOI: 10.1051/ matecconf/201712001010
ASCMCES-17
4 Conclusion Spectral matching is performed for eight selected earthquake records to match Dubai response spectra using SeismoMatch software. The soil columns are obtained by performing nonlinear and equivalent linear site response analysis using DeepSoil software. Acceleration parameters S s and S 1 are obtained by average response spectra at 0.2 and 1s respectively. Next, the design acceleration parameters, the design response spectrum are developed for two site soil classes C and D for Dubai. Furthermore, generation of a generalized time history earthquake record is obtained by solving the inverse mapping problem using cascade artificial neural network for any design response spectrum. Artificial neural network is trained using 30 design response spectra generated by DeepSoil software. The response spectra of the generalized time history compared to input spectra were in good agreement. In general, using ANN1 and ANN2, it is possible to generate time histories accurately with hassle free and no software with no loss of generality. The generated accelerograms have preserved the actual profile of original accelerograms with sound and representative characteristics. The generated accelerograms are general in the sense of comprising the knowledge of the accelerograms obtained by the neural network during training.
References 1. 2. 3.
4.
5. 6. 7. 8.
M. Irfan. Seismic site response analysis and characterization of major cities of U.A.E. M.S. Thesis, University of Sharjah, Sharjah, UAE, (2011) N. A. Abrahamson, W.J. Silva. Empirical response spectra attenuation relations for shallow crustal earthquakes. Seismological Research Letters, 68, 1, 94-127 (1997) J. P. Stewart, A. H. Liu, Y. Choi. Amplification factors for Spectral Acceleration in Tectonically active Regions. Bulleting of Seismological Society of America, 93, 1, 332-352 (2003) K.A. Bani-Hani, A.I. Malkawi. A Multi-step Approach to Generate ResponseSpectrum-Compatible Artificial Earthquake Accelerograms. Soil Dynamics and Earthquake Engineering, accepted for publication, (2017) PEER (Pacific Earthquake Engineering Research Center, NGA Database), http://peer.berkeley.edu/nga/search.html Y.M.A Hashash, D.R. Groholski, C. A. Phillips, D. Park, M. Musgrove. DEEPSOIL5.1. User Manual and Tutorial. 107 (2012) Seismosoft Ltd. SeismoMatch Version 2.1.0. Available from: http://www.seismosoft.com/en/HomePage.aspx (2009) F. Cotton, F. Scherbaum, J.J. Bommer, H. Bungum .Criteria for selecting and adjusting ground-motion models for specific target applications: applications to Central Europe and rock sites. Journal of Seismology, 10, 2, 137-156, (2006)
10