Science of the Total Environment 550 (2016) 439–448
Contents lists available at ScienceDirect
Science of the Total Environment journal homepage: www.elsevier.com/locate/scitotenv
Assessment of methods for simplified traffic noise mapping of small cities: Casework of the city of Valdivia, Chile Nicolás A. Bastián-Monarca, Enrique Suárez, Jorge P. Arenas ⁎ Institute of Acoustics, Universidad Austral of Chile, PO Box 567, Valdivia, Chile
H I G H L I G H T S
G R A P H I C A L
A B S T R A C T
• A simplified traffic noise mapping method is successfully applied to a small city. • A road traffic noise prediction model is applied to a small city of Chile. • A simplified acoustic method for modeling buildings produces acceptable results. • An official road classification can be used for road traffic noise modeling. • A road traffic noise map is developed at low cost and with limited information.
a r t i c l e
i n f o
Article history: Received 24 December 2015 Received in revised form 22 January 2016 Accepted 22 January 2016 Available online xxxx Editor: D. Barcelo Keywords: Environmental noise in cities Traffic noise modeling Simplified methods Acoustic simulation
a b s t r a c t In many countries such as Chile, there is scarce official information for generating accurate noise maps. Therefore, specific simplification methods are becoming a real need for the acoustic community in developing countries. Thus, the main purpose of this work was to evaluate and apply simplified methods to generate a cost-effective traffic noise map of a small city of Chile. The experimental design involved the simplification of the cartographic information on buildings by clustering the households within a block, and the classification of the vehicular traffic flows into categories to generate an inexpensive noise map. The streets have been classified according to the official road classification of the country. Segregation of vehicles from light, heavy and motorbikes is made to account for traffic flow. In addition, a number of road traffic noise models were compared with noise measurements and consequently the road traffic model RLS-90 was chosen to generate the noise map of the city using the Computer Aided Noise Abatement (CadnaA) software. It was observed a direct dependence between noise levels and traffic flow versus each category of street used. The methodology developed in this study appears to be convenient in developing countries to obtain accurate approximations to develop inexpensive traffic noise maps. © 2016 Elsevier B.V. All rights reserved.
1. Introduction
⁎ Corresponding author. E-mail address:
[email protected] (J.P. Arenas).
http://dx.doi.org/10.1016/j.scitotenv.2016.01.139 0048-9697/© 2016 Elsevier B.V. All rights reserved.
Environmental noise pollution has been a growing worldwide problem over the last few years mostly due to the increasing use of vehicles in cities. This fact has not only contributed to raise greenhouse gas
440
N.A. Bastián-Monarca et al. / Science of the Total Environment 550 (2016) 439–448
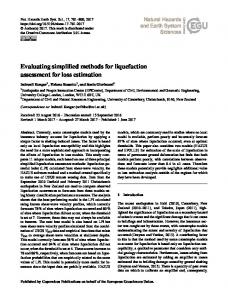
Fig. 1. Example of building simplification. A partially-occupied block is shown.
emissions but it also has produced an increase in annoying noise and noisy environments which has been reported by numerous studies (Belojevic et al., 2008; Pathak et al., 2008; Paunovic et al., 2009; Szeremeta and Zannin, 2009; Di et al., 2012; Halonen et al., 2012; Paviotti and Vogiatzis, 2012; Vogiatzis, 2013). Some previous works have analyzed the relationship between traffic and pollutants, i.e. physical, such as noise, or chemical (Barrigón Morillas et al., 2005; Su et al., 2008; Can et al., 2011a, 2011b; Foraster et al., 2011) and methods for the calculation of the external cost of road traffic noise have also been reported (Maibach et al., 2008; European Union, 2011; Moliner et al., 2013). Moreover, recent studies suggest that both road traffic noise and air pollution exposure are risk factors for stroke (Sorensen et al., 2014). Thus, road traffic noise is clearly an invisible pollutant that can harm human health. Daytime equivalent sound pressure levels above 65 dBA have become unacceptable in many cities, although many residential areas are located in acoustically deficient areas with levels ranging between 55
and 65 dBA (Zannin et al., 2013). About 20% of the EU population is estimated to suffer noise levels considered to be unacceptable, and 45% is residing in areas where noise can cause serious annoyance (Affenzeller and Rust, 2005). According to a published report by the World Health Organization (WHO) “Noise pollution is the second largest environmental threat to health after air pollution, and responsible for, according to estimates of the health agency, 50,000 heart attacks every year in Europe” (WHO, 2011). In this sense, noise maps are an important tool to provide relevant information to local and global action plans (Klaeboe et al., 2006; Guedes et al., 2011; Vogiatzis, 2011). In urban administration and planning, noise mapping is a very useful tool for generating information about environmental impacts and enabling the visualization of noise pollution in the urban landscape (Zannin et al., 2013) and many cities in the world have produced their noise maps. Research on noise maps is a subject of great interest in European countries (Vogiatzis and Remy, 2014) where the use of GIS has provided relevant information
Fig. 2. Road classification according to the Road Authority of the city of Valdivia. (For interpretation of the references to color in this figure, the reader is referred to the web version of this article.)
N.A. Bastián-Monarca et al. / Science of the Total Environment 550 (2016) 439–448
441
Fig. 3. Measured (observed) and predicted traffic noise for different models.
for noise maps and specific maps have been developed for airport noise (Vogiatzis, 2012, 2014). In Chile there is no regulation requiring cities to have a mandatory noise map. However, the Ministry of the Environment has conducted a series of studies of this type in a number of cities (CONAMA, 2009; MMA, 2015) including Santiago, the largest city of the country (MMA, 2011). Road traffic noise is an element of outstanding importance within the overall context of environmental impact. Studies have concluded that 80% of all the sources are road-traffic related (Filho et al., 2014). This problem must be technically addressed from an efficient point of view, and either solutions or alternatives should be considered by means of appropriate and consolidated procedures (Ruis-Padillo et al., 2014). In addition, emissions from road traffic noise depend on many factors, such as vehicle speed, acceleration, and the characteristics of road surfaces. Currently, computer-based calculation methods have become a general practice in the elaboration of noise maps, and regardless of their advantages and shortcomings with respect to sampling methods based on in-situ measurements they still need the former to verify the results obtained (WG-AEN, 2007). It has been demonstrated that categorization is adequate for the description of noise in medium-sized cities (Barrigón Morillas et al., 2005) and clearly has a better prediction capacity than the standardized grid method (Barrigón Morillas et al., 2011; Rey Gozalo et al., 2012). Recent studies (Rey Gozalo et al., 2013) have shown that using the method of categorization jointly with the concept of functionality can be applied to study other transportation related pollutants. There is a variety of road traffic noise models and all have different equations to predict noise levels. Steele (2001) conducted a comparative
analysis of the main models of road traffic noise at the time, but new models are now available having a stronger technical basis. Later, Garg and Maji (2014) updated Steele's study by including new models, such as the French model NMPB-Routes-2008. Both studies have concluded that there is no an ideal model, because the predictions depend on many variables and specific conditions. Thus, the choice of a model for predicting road traffic noise should be adapted to each urban reality. Studies performed in the largest city of Chile have reported that modeled results obtained through the German model RLS-90 showed a better correlation with the measured noise levels (Dintrans and Préndez, 2013; Suárez and Barros, 2014). During the period 2009–2012 the European Commission developed CNOSSOS-EU (Common Noise Assessment Methods in Europe), the common and harmonized methodological framework for strategic noise mapping under the European Directive 2002/49/EC on the assessment and management of environmental noise (EC, 2002; Kephalopoulos et al., 2014). The main goal was to have the common noise assessment methodology operational in 2017. However, due to a number of challenging issues that had taken too long to overcome (Bento Coelho et al., 2011; Kephalopoulos et al., 2014) CNOSSOS-EU will probably be implemented and operational for a future round of strategic noise mapping. Since the CNOSSOS-EU methodology uses more input data than the data collected for the city of Valdivia and that this methodology is still in the implementation process, the CNOSSOS-EU methodology was not considered in the present study. It is important to highlight the need for countries such as Chile, to generate noise maps for urban planning and consequently taking actions for mitigating noise pollution. However, due to the lack of awareness of these societies, in general government authorities do not
Fig. 4. Correlation of measured and predicted traffic noise levels (dBA) for three models.
442
N.A. Bastián-Monarca et al. / Science of the Total Environment 550 (2016) 439–448
Fig. 5. Dispersion of data through Q–Q plots for three traffic noise models.
provide broad resources to study noise in small cities. This fact justifies the need for developing low-cost methodologies for generating noise maps. It has to be noted that at present there is no Chilean recommendation comparable to the European Directive 2002/49/EC for the assessment and management of environmental noise. In this work, a low-cost traffic noise map implemented through modeling software was developed in a small city. For this, the city streets were classified according to the official classification of Chile. Then, an analysis of road traffic and noise levels was performed involving the separation of light and heavy vehicles, and motorbikes. 80 measurement points located in different types of roads without exceeding 5% gradients were chosen. These measurements were performed under the conditions described in the standard ISO 1996-2:2007 (ISO, 2007). A comparative analysis between the measured and predicted levels obtained by models of road traffic noise RLS-90 (German model), STL-86 (Swiss model) y STATENS PLANVERK 96 (Nordic model) was performed. These models were chosen because they use variables that are easy to obtain in the field. Furthermore, the traffic flow information was obtained in-situ and a further simplification of the city's cartographic information was considered to elaborate the noise map. 2. Methodology The noise map was produced by the Computer Aided Noise Abatement (CadnaA 3.7.123, 32-bit) software, taking into consideration the methodology developed in previous projects in Chile (CONAMA, 2009; MMA, 2010, 2011). The software incorporated information on cartographic data and traffic flow to perform the modeling process. It is worth mentioning that the resulting noise map is only limited to the noise produced by vehicular traffic, and does not include any other noise sources. The noise map considered an analysis of the road network (roadway type, number of vehicles, etc.), traffic flow (segregated in light vehicles, heavy motor vehicles and motorcycles), high-rise building developments, topography, etc. A standard speed of 60 km/h is assumed for all roads, which is the maximum permissible speed in the urban territory in Chile. The vehicular traffic flow and noise levels were determined by studying 80 noise measurements. It was decided to perform acoustic measurements for 10 min at each point. It was observed that at that time the levels could be considered stable (vehicular traffic noise). In addition, some recent studies have used the same measurement time for vehicular traffic noise (Zannin and Sant'Ana, 2011; Guedes et al., 2011; Romeu et al., 2011; Zannin et al., 2013; Fiedler and Zannin, 2015). The measurements were performed under the conditions
described in ISO 1996-2:2007 (ISO, 2007) and they were carried out between 9:00 and 18:00 without differentiating between valley and peak hours. Moreover, noise measurements were performed to compare the data provided by the Computer Aided Noise Abatement (CadnaA) software and assessing how reliable are the results delivered by this. 2.1. Modeling process The noise map modeling was implemented after an analysis of the available input data and required carrying out the following steps: a) Obtain the cartographic information on the city (streets, buildings, parks, etc.). b) Verify the information gathered through field observations. c) Classify streets by category. d) Perform traffic flow and acoustic measurements. e) Compare predicted levels from models with measurements in the field. f) Select the most appropriate prediction model. After completing these initial steps, the work continued on the software as indicated below: a) Import the cartographic information into the software. b) Apply simplification methods.
Fig. 6. Residue analysis versus normal theoretical values obtained.
N.A. Bastián-Monarca et al. / Science of the Total Environment 550 (2016) 439–448 Table 1 Results obtained for each model.
Mean absolute error (dB) Standard deviation (dB) % of points b 1 dB % of points b 3 dB Overestimated points (%) Underestimated points (%) Pearson's r-coefficient
c) d) e) f)
RLS-90
SP-96
STL-86
2.80 2.17 15.5 42.3 90.1 9.9 0.83
2.27 1.41 23.9 71.8 53.5 46.5 0.82
2.13 1.42 23.9 76.1 52.1 47.9 0.83
Set the modeling scenario: streets, buildings, contour lines, etc. Use the most appropriate prediction model. Produce the noise map by software modeling. Compare the results generated by the software with noise measurements.
2.2. Simplifications of traffic flow characterization The acoustic modeling process considered the official roadway classification as established by the Ministry of Housing and Urban Development of Chile (MINVU, 2009). However, the city of Valdivia has no formal classification defined by a governmental authority and therefore it had to be implemented with the collaboration of a city planning consultant. Considering their main function, conditions and design standards, urban roads for vehicle circulation to serve inter-communal and communal public needs were classified into five categories: express, trunk, collector, service and local roads. This classification of roads into different categories allows for a significant stratification from the statistical point of view, it reduces the number of traffic flow and acoustical measurements, and makes possible studying a larger area of the city (Suárez and Barros, 2014).
443
time. The present study adopted a simplification process based on criteria such as the clustering of households within a representative block and considering a common height for all buildings (Ausejo et al., 2010). The complete model for the city of Valdivia (155,000 inhabitants) included 30,000 buildings, corresponding to 1588 blocks in the simplified model. This strategy allowed for the modeling of the entire city, focusing on building façades, and the preservation of the façade most exposed to vehicular traffic noise for each building or cluster of buildings in the model. The simplification process considered the following criteria (Suárez and Barros, 2014): a) Continuous façade: the simplification consists of merging all dwelling units/buildings in a single block representing the entire block. The boundary of such block corresponds to the unification of those façades facing the street. b) Discontinuous façade: based on the above classification, a discontinuous façade is one that presents gaps or separations between buildings. In this case we chose to ignore such discontinuities and complete the boundary of the block as in the previous case. A similar approach was adopted for dead-end streets, access to condos and pedestrian streets within the block. c) Partially occupied block: this approach contemplates the creation of a block corresponding to the occupied area. Two particular instances can be individualized: 1) A set of buildings grouped in one section of the block, usually corresponding to dwelling units, and the block is constructed according to the above criteria applied to the area in use; 2) isolated constructions distributed within the block, which because of their size and location are easy to distinguish as single units and not as part of a cluster. This criterion does not involve the development of blocks, but it only considers the existing constructions. Fig. 1 shows an example of this building simplification. 2.4. Modeling height
2.3. Simplifications of the modeling scenario In the modeling stage, some simplifications of the cartographic information referred to buildings were necessary to optimize the use of
Although the recommendations of Directive 2002/49/EC indicate that noise maps must be produced at a height of 4 m above ground level, the present work was conducted at a height of 1.5 m. Since most
Fig. 7. Distribution of average traffic flow (hourly equivalent traffic) by type of road.
444
N.A. Bastián-Monarca et al. / Science of the Total Environment 550 (2016) 439–448
Fig. 8. Distribution of A-weighted equivalent continuous sound pressure levels per road type.
of the constructions in the city of Valdivia are one-story buildings, and that acoustical measurements were performed at this height (allowing for direct comparison between modeled and measured data), modeling at 1.5 m was the most appropriate alternative. 2.5. Classification of roads and measurements The classification proposed is that shown in Fig. 2. It must be noted that the city of Valdivia has no urban streets complying with the design established for service roads, and therefore all streets in blue were
considered collector or service roads. However, previous studies have found that collector and service roads are very similar from an acoustic point of view and therefore they could be classified into a single category (Suárez and Barros, 2014). The road classification used in this work corresponds to the official regulatory classification in Chile. It is very similar to that presented in the document Environmental criteria for road traffic noise (Environment Protection Authority, 1999), in which the roads are classified into four categories according to their function. Furthermore, in a previous study (Rey Gozalo et al., 2013) a city road classification into five categories was performed from the point of view of functionality with very good results. Interestingly, the classification used by that study is quite similar to the classification proposed in this work, so it has been assumed to produce similar performance. The traffic flow measurement points were distributed according to the road classification system applied to the city (Fig. 2), considering that within such classification some streets showed a more regular behavior than others regarding vehicle flow and traffic noise levels. Thus, 12.98% were categorized as expressways (highly regular), 30.27% as trunk roads (regular), 43.77% as collector or service roads (irregular), and 12.98% as local roads (highly irregular). Since local roads were located in residential neighborhoods and condos, and that the main noise source was not related to vehicular traffic, the measuring points to determine noise levels followed the same distribution as that implemented in expressways and no resources were focused on such road types given the above methodology (i.e. the noise map considered only vehicular traffic noise). Therefore, 80 traffic flow and noise measuring points were distributed as follows: 10 measuring points in expressways, 24 measuring points in trunk roads, 36 measuring points in collector or service roads, and 10 measuring points in local roads. The segregated-vehicle flow measurements in this study recorded light vehicles (passenger cars, pick-up trucks, mini-buses, light-duty trucks up to two axles), heavy vehicles (intercity buses, city buses, trucks with two or more axles) and motorbikes (motorcycles and scooters).
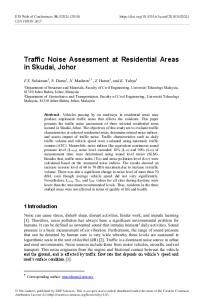
Fig. 9. Day time sound levels (Ld) from vehicular traffic of the city of Valdivia.
N.A. Bastián-Monarca et al. / Science of the Total Environment 550 (2016) 439–448
10-min noise measurements in terms of LAeq (A-weighted equivalent continuous sound pressure level) were conducted to determine the vehicle flow over each period and compare its effect on the measured versus modeled LAeq relationship. In addition, data on the roadway characteristics were also recorded such as width (m), circulation speed of traveling vehicles (km/h), distance to the nearest façade (m), distance to the side of the carriageway (m), and distance between officiallydemarcated road boundaries, among others. No speed measurements of traveling vehicles were performed during the process of traffic flow determination, but an average circulation speed per road type (60 km/h for all roads), as recommended by the Good Practice Guide for Strategic Noise Mapping and the Production of Associated Data on Noise Exposure (WG-AEN, 2007), was assumed. It must be noticed that the classification of roads into different categories was based on their design standards and vehicular traffic flow. This categorization was essential to achieve good verifiable results since modeling considers both their function and behavior. Special emphasis should be put on road classification when modeling noise maps since the slightest mistake would reflect on every road on the map. 3. Choosing a road traffic noise model The automotive market in Chile has some unique characteristics that make it one of the most wide-ranging in the world. According to the National Automotive Association (ANAC, 2015) 63 brands of cars, 28 of trucks, and 16 of buses from all over the world are currently available in the country, with more than 1400 different models and versions. In this wide market about 19% of the vehicles are SUVs. In addition, there are a large number of road pavement types in Chilean cities ranging from Portland cement concrete to different asphalt mixes. In such a context, the choice of a road traffic noise model that appropriate describes the Chilean urban reality become very important. To select an appropriate road traffic noise model, a comparison between measured and predicted noise levels for each model was performed. For this, we considered 73 out of 80 measurement points, since in the seven points that were discarded, there was no traffic flow. These points correspond to local roads having a regular flow in these pathways that are classified as residential. Fig. 3 shows predicted noise levels at each observation point by different noise models and the corresponding measured levels. Fig. 4 reports the regression analysis between measured and predicted levels by three models. Fig. 5 shows the dispersion of data for different traffic noise models and Fig. 6 reports the corresponding box-and-whisker diagram. Table 1 summarizes the statistical behavior of each model considered. Analyzing the results of Fig. 4 and Table 1, the three model predictions were comparable to the measured values with a correlation coefficient higher than 80% in all cases. It is observed in Fig. 5 that the normality of the residuals indicates that the actual values are very close to the values estimated by the three models. It is shown in Fig. 6 that quartiles are approximately 2 dB, which is attributed to the dispersion of data. This is because some categories were measured when the traffic flow was very low, resulting in a noticed difference between observed versus predicted noise levels. Considering the above results, it was decided to use the German model RLS-90, because it is the only model that overestimates by approximately 2 dB the noise levels (see Fig. 6). This corresponds to the worst condition for the receiver, with an acceptable safety factor for purposes of this work. 4. Traffic flow analysis One of the most important and influential variable in traffic noise level modeling corresponds to the vehicular traffic flow. Based on the above, performing an adequate analysis of vehicular traffic flow is fundamental to determine whether the road classification employed is
445
Fig. 10. Comparison between measured and modeled noise levels.
adequate for this variable or not. In Fig. 7 the average values of traffic flow (number of vehicles per hour) are plotted separately by each type of road. The equivalent number of vehicles per hour was obtained from on-site measurements carried out in 10 min. For this, it was considered that the traffic flow of 10 min was equivalent to 16.6% of the traffic flow per hour. (See Fig. 8.) As seen in Fig. 7, the average traffic flow showed that 50% of the measurements were between 2000 and 3500 hourly equivalent vehicles. A decreasing dispersion in the traffic flow distribution was observed from the expressway to local road; however, no overlapping between roadway types was detected, indicating the suitability of the road classification. 5. Analysis of noise levels per type of road The results presented in the previous section could lead to conclude that the dispersion of the flow data, as for example in expressways, was too high. However, it is important to notice that the noise level is logarithmically related to traffic flow values and hence the effective dispersion is much lower. Concerning noise measurements, values showed a regular distribution and fluctuated around the central 50% between 73 and 74 dBA for the expressway road, and between 70 and 72 dBA for the trunk road. The collector or service roads showed an acceptable variation ranging between 66 and 70 dBA, and the local roads showed a greater irregular fluctuation from 55 to 61 dBA. However, noise on local roads does not mainly originate from vehicular traffic flow. Thus the scattering of data is not such an important issue since it is a given condition for the used methodology. The purpose of having this analysis is to compare the predicted noise levels in the noise map with real measurements in order to assess its reliability. The large differences in dispersion presented by the traffic flows showed a trend to reduce regarding levels and, as expected, higher dispersions occurred in the lowest category (local road). On the other hand, the dispersion in the trunk road category was very high possibly because of its heterogeneous vehicle type composition; most of the vehicular traffic flow consisted of public transportation (shared taxis, taxis, and buses) producing very high noise levels, which led to a disruption of the average in this category. Flows and noise levels showed a Table 2 Value and estimated error for each interval. Complexity
Accuracy
Cost
Error
Very simple Simple Average Moderately sophisticated Sophisticated Very sophisticated
Very inaccurate Inaccurate Average Fairly accurate Accurate Very accurate
Very Inexpensive Inexpensive Average Moderately expensive Expensive Very expensive
N5 dB 4 dB 3 dB 2 dB 1 dB b0.5 dB
446
N.A. Bastián-Monarca et al. / Science of the Total Environment 550 (2016) 439–448
Table 3 Analysis of the methodology employed. Available information
Recommendation
Complexity
Accuracy
Cost
No information on traffic flow
Select sample road and do traffic counts there; extrapolate to other roads of same type Select sample average speed as a function of experience on roads of same type Perform field visits and count number of floors; multiply each floor by average height
Very sophisticated
Fairly accurate
Moderately expensive
Very simple
Fairly accurate
Average
Very sophisticated
Accurate
Moderately expensive
No information on speed No information on height of buildings
downward trend when downgrading from express to local roads. In addition, the mean values measured in the express, trunk and collector roads exceeded 65 dBA, which has negative health effects as indicated in the recommendations by the Organization for Economic Cooperation and Development (OECD, 1991). Finally, the mean values measured on all roads were over 55 dBA, which is considered a major disturbance as established by the World Health Organization (WHO, 1999). 6. Analysis of simplifications employed
From the analysis of Table 3 it can be concluded that the proposed methodologies are rather sophisticated, moderately expensive and of average accuracy (error estimate of ± 2 dB). Thus, even though the use of simplification models based on the recommendations of the Good Practice Guide for Strategic Noise Mapping and the Production of Associated Data on Noise Exposure (WG-AEN, 2007) may be timeconsuming and relatively expensive, the accuracy obtained is quite good (±2 dB) and confirms the relevance of the process. 7. Noise mapping
The European Environment Agency Working Group on the Assessment of Exposure to Noise presented a paper in 2006 titled Good Practice Guide for Strategic Noise Mapping and the Production of Associated Data on Noise Exposure (WG-AEN, 2007). This paper aims to assist Member States in the creation of successful noise mapping solutions as required by Directive 2002/49/EC (EC, 2002). The main purpose of the European Commission's Working Group is the creation of healthy environments and to take action plans based upon the results obtained from noise maps. The document points out several recommendations, which depend on the type of information available when performing the acoustic study. Some relevant issues to consider are the daily traffic flow, area to be modeled, circulation speed of traveling vehicles, urban open spaces, among others. Each recommendation in the document indicates the degree of complexity, accuracy required and cost. Obviously, the information required to produce a noise map will have different costs and accuracy levels depending on the local characteristics and resources available to perform the acoustic study. Regarding the parameters of complexity, accuracy and cost, these are divided into six intervals following the recommendations in the document above to clearly express their fluctuations. Unfortunately, the document only mentions the extreme values for each parameter (the best and worst case scenarios), which could be imprecise when values are somewhere in between the target interval. For this reason, additional intervals for complexity, accuracy and cost have been proposed, based on the extreme values (minimum and maximum) given in the document and on the values considered most suitable by the authors in each case. Regarding the error of each recommendation, depending on the target interval, the values may vary from 5 to 0.5 dB. Table 2 shows each interval with its estimated error. It should be noted that only the intermediate values for each interval were added here by the authors; however, the error estimates were already indicated in the original document (WG-AEN, 2007). Table 3 shows the methodology employed after analyzing the above recommendations and performing a comparison with the simplifications implemented in this work.
The traffic noise map was produced with the Computer Aided Noise Abatement (CadnaA) software, which incorporated in-situ acoustic measurements to determine the reliability of the model. The average absorption coefficient value employed for buildings was α = 0.4 (WG-AEN, 2007) which significantly reduced the modeling time. The acoustical properties of the ground were taken into account through a ground factor G. Since the international standard ISO 96132 assigned a value of G = 0 for hard ground (concrete, water, etc.) and G = 1 for soft ground (porous), then the green areas in the project were considered to be G = 0.5 (semi-porous ground) (ISO 9613-2, 1996). As for noise mapping calculations, this work implemented a distance of 10 m between calculation grid points as set by Directive 2002/49/EC and a height of 1.5 m above ground level. Standard ISO 1996-2 (ISO 1996-2, 2007) describes the criteria for the determination of sound pressure levels and noise mapping; a recommendation of 5 dB intervals is given for sound pressure representation on noise maps. Hence, the map layout was represented following the above recommendations and those of Directive 2002/49/EC. Each of these sound level intervals was represented on the map by a different color. Furthermore, the recommendations given by the European Environment Agency Working Group on the Assessment of Exposure to Noise were also followed. Fig. 9 shows the day time sound levels, Ld, noise map generated for the city of Valdivia. The map layout displays a representation of the modeled noise levels produced by vehicular traffic. 8. Noise measurements An evaluation to determine any discrepancies between measured and modeled noise values through the noise prediction software was made. Thus, 80 points were displayed in the modeled area in the same positions as those set for traffic noise measurements to execute an
Table 4 Comparison between measured and modeled noise levels. Road category
Number of data
Average measured Leq (dBA)
Average modeled Leq (dBA)
Average absolute difference
Absolute difference standard deviation
Express Trunk Collector or service Local
10 24 36 10
73.7 70.4 68.2 58.5
72.9 69.8 67.3 59
1.9 4.6 3.0 4.9
1.7 3.0 2.7 2.4
N.A. Bastián-Monarca et al. / Science of the Total Environment 550 (2016) 439–448
analysis of all data contained in the model and evaluate any differences between measured and modeled noise values. The differences found were mainly attributed to the traffic flow assigned to each road category in the model and that actually measured on the street. Table 4 and Fig. 10 show a comparison exercise between measured and modeled noise level values with the average for the road category, and for this purpose 10-min LAeq and 60-min LAeq were assumed to be comparable, according to what was done by previous authors (Davies et al., 2009; Gan et al., 2012). Table 4 shows a direct relationship between noise levels versus traffic flow in each category, indicating a decreasing tendency in both measured and modeled traffic noise with lower traffic flows. Moreover, with decreasing traffic flows by category, larger differences and higher standard deviations can be observed. The absolute difference values obtained are consistent with the uncertainty given by Licitra and Memoli of 4.6 dBA (Licitra and Memoli, 2008). On the other hand, it can be seen that all categories show average differences of less than 1 dBA between measured and modeled noise levels, and acceptable deviations, which is in agreement with the recommendations proposed by the Good Practice Guide for Strategic Noise Mapping and the Production of Associated Data on Noise Exposure of ±2 dB (WG-AEN, 2007). Moreover, Fig. 10 shows that there is a big difference between some measured and modeled points, which are mostly measuring points that correspond to local roads (where the effects of traffic flow can be almost negligible). On the other hand, according to the results presented in Table 4, the overall analysis of the data shows that there is a good relationship between measured and modeled levels. Fig. 10 shows that there are some points where the differences are very high (up to 10 dBA), so it is clear that these results are useful to get an idea of the general behavior of the traffic noise in the city, but not for areas where there is a low traffic flow. In addition, the modeled values were closer to the values measured on roads with larger volumes of vehicle traffic, except for trunk roads. On roads with low vehicular flow rates it was possible to observe, as expected, a greater difference between modeled and measured data. In these categories, such as local roads, vehicle flows were considerably lower than the average for the category, which explains the greater differences between modeled and measured data. Concerning the behavior of trunk roads, the high dispersion observed and the remarkable differences between modeled and measured values can be attributed to the heterogeneous vehicle type composition. 9. Conclusions The noise map of the city of Valdivia was developed using a hybrid methodology based on road designs, predictive models and simplifications of cartographic and traffic flow information. The methodology developed in this study appears to be convenient in developing countries since it allows for the collection of reliable data to provide a perspective of the noise level distribution across the city at a very low cost. One of the greatest advantages of the present methodology is that it can be applied to both small and large cities (Suárez and Barros, 2014) to gather valid information on the noise levels. It is worth mentioning that the simplification of the road modeling environment has to be reviewed and adjusted in a small city like Valdivia, since there is a variation in traffic flow and sound pressure level between roads that share the same categorization, such as trunk and local roads. The simplification in small cities may consider the classification of trunk roads into those with high vehicular traffic flows and those with low vehicular traffic flows, and the same may be applied to local roads. Finally, it is important to note that these methodologies are consistent with the recommendations of the European Commission's Working Group — Assessment of Exposure to Noise (WG-AEN, 2007).
447
References Affenzeller, J., Rust, P., 2005. Road traffic noise — a topic for today and the future. VDA Technical Congress (Ingolstadt). ANAC, Asociación Nacional Automotriz de Chile, 2015. http://www.anac.cl. Ausejo, M., Recuero, M., Asensio, C., Pavón, I., López, J.M., 2010. Study of precision, deviations and uncertainty in the design of the strategic noise map of the macrocenter of the city of Buenos Aires, Argentina. Environ. Model. Assess. 15, 125–135. Barrigón Morillas, J.M., Gómez Escobar, V., Méndez Sierra, J.A., Vílchez-Gómez, R., Vaquero, J.M., Trujillo Carmona, J.A., 2005. Categorization method applied to the study of urban road traffic noise. J. Acoust. Soc. Am. 17, 2844–2852. Barrigón Morillas, J.M., Gómez Escobar, V., Méndez Sierra, J.A., Vílchez-Gómez, R., Carmona del Río, F.J., Trujillo Carmona, J., 2011. Analysis of the prediction capacity of a categorization method for urban noise assessment. Appl. Acoust. 72, 760–771. Belojevic, G., Jakovljevic, G., Stojanov, V., Paunovic, K., Illic, J., 2008. Urban road-traffic noise and blood pressure and heart rate in preschool children. Environ. Int. 34, 226–231. Bento Coelho, J.L., Vogiatzis, K., Licitra, G., 2011. The CNOSSOS-EU initiative: a framework for road, railway, aircraft and industrial noise modeling for strategic noise mapping in EU member states. 18th International Congress on Sound and Vibration, 10–14 July. International Institute of Acoustics and Vibration, Rio de Janeiro. Can, A., Dekoninck, L., Rademaker, M., Van Renterghem, T., De Baets, B., Botteldooren, D., 2011a. Noise measurements as proxies for traffic parameters in monitoring networks. Sci. Total Environ. 410–411, 198–204. Can, A., Rademaker, M., Van Renterghem, T., Mishra, V., Van Poppel, M., Touhafi, A., et al., 2011b. Correlation analysis of noise and ultrafine particle counts in a street canyon. Sci. Total Environ. 409, 564–572. CONAMA, Comisión Nacional del Medio Ambiente, 2009. Elaboración de Mapas de Ruido mediante Software de Modelación, para Caso Piloto (Comunas de Antofagasta y Providencia) (Contrato Nº 01-059/09). Proyecto Ejecutado por el Instituto de Acústica. Universidad Austral de Chile. Davies, H.W., Vlaanderen, J.J., Henderson, S.B., Brauer, M., 2009. Correlation between coexposures to noise and air pollution from traffic sources. Occup. Environ. Med. 66, 347–350. Di, G., Liu, X., Lin, Q., Zheng, Y., He, L., 2012. The relationship between urban combined traffic noise and annoyance: an investigation in Dalian, north of China. Sci. Total Environ. 432, 189–194. Dintrans, A., Préndez, M.A., 2013. Method of assessing measures to reduce road traffic noise: a case study in Santiago, Chile. Appl. Acoust. 74, 1486–1491. EC, 2002. Directive of The European Parliament and of the Council of 25 June 2002 Relating to the Assessment and Management of Environmental Noise; 2002/49/EC. Environment Protection Authority, 1999. Environmental criteria for Road Traffic Noise. European Union, 2011. Directive 2011/76/EU of the European parliament and of the council of 27 September 2011 amending directive 1999/62/EC on the charging of heavy goods vehicles for the use of certain infrastructures. Off. J. Eur. Union, EU. Fiedler, P.E.K., Zannin, P.H.T., 2015. Evaluation of noise pollution in urban traffic hubs—noise maps and measurements. Environ. Impact Assess. Rev. 51, 1–9. Filho, J.M.A., Lenzi, A., Zannin, P.H.T., 2014. Effects of traffic composition on road noise: a case study. Transp. Res. D-Transport Environ. 9, 75–80. Foraster, M., Deltell, A., Basagaña, X., Medina-Ramón, M., Aguilera, I., Bouso, L., et al., 2011. Local determinants of road traffic noise levels versus determinants of air pollution levels in a Mediterranean city. Environ. Res. 111, 177–183. Gan, W.Q., McLean, K., Brauer, M., Chiarello, S.A., Davies, H.W., 2012. Modeling population exposure to community noise and air pollution in a large metropolitan area. Environ. Res. 116, 11–16. Garg, N., Maji, S., 2014. A critical review of principal traffic noise models: strategies and implications. Environ. Impact Assess. Rev. 46, 68–81. Guedes, I.C.M., Bertoli, S.R., Zannin, P.H.T., 2011. Influence of urban shapes on environmental noise: a case study in Arcajú, Brazil. Sci. Total Environ. 412–413, 66–76. Halonen, J.L., Vahtera, J., Stansfeld, S., Yli-Toumi, T., Salo, P., Pentty, J., et al., 2012. Associations between nighttime traffic noise and sleep: the Finnish public sector study. Environ. Health Perspect. 120, 1391–1396. International Organization for Standardization, 1996. International Standard ISO 9613-2: 1996, acoustics — attenuation of sound during propagation outdoors — part 2: general method of calculation. Technical Committee ISO/TC 43, Acoustics. International Organization for Standardization, 2007. International Standard ISO 1996-2: 2007, Description, Measurement and Assessment of Environmental Noise. Part 1: Basic Quantities and Assessment Procedures. International Organization for Standardization, Switzerland. Kephalopoulos, S., Paviotti, M., Anfosso-Lèdèe, F., Van Maercke, D., Shilton, S., Jones, N., 2014. Advances in the development of common noise assessment methods in Europe: The CNOSSOS-EU framework for strategic environmental noise mapping. Sci. Total Environ. 482–483, 400–410. Klaeboe, R., Engelien, E., Steinnes, M., 2006. Context sensitive noise impact mapping. Appl. Acoust. 67, 620–642. Licitra, G., Memoli, G., 2008. Limits and Advantages of Good Practice Guide Noise Impact Mapping. Forum Acusticum — Paris (on CD). Maibach, M., Schreyer, C., Sutter, D., Van Essen, H.P., Boon, B.H., Smokers, R., et al., 2008. Handbook on Estimation of External Costs in the Transport Sector. Produced Within the Study Internalization Measures and Policies for all External Cost of Transport (IMPACT). CE Delft, Delft. MINVU, Ministerio de Vivienda y Urbanismo, 2009. Manual de Vialidad Urbana. Recomendaciones para el Diseño de Elementos de Infraestructura Vial Urbana (REDEVU) 2009 (http://www.minvu.cl/opensite_20070404110715.aspx). MMA, Ministerio del Medio Ambiente, 2010. Elaboración de Mapa de Ruido Comuna De Santiago Mediante Software de Modelación. Ficha de Licitación Nº 1588-67-LE10. Proyecto Ejecutado por el Instituto de Acústica. Universidad Austral de Chile.
448
N.A. Bastián-Monarca et al. / Science of the Total Environment 550 (2016) 439–448
MMA, Ministerio del Medio Ambiente, 2011. Elaboración de Mapa de Ruido del Gran Santiago Mediante Software de Modelación. Ficha de Licitación Nº 608897-12-LE11. Proyecto Ejecutado por el Instituto de Acústica. Universidad Austral de Chile. MMA, Ministerio del Medio Ambiente, 2015. Elaboración y Análisis de Mapas de Ruido de Tres Conurbaciones Mediante Software de Modelación. Ficha de Licitación Nº 608897-50-LP13. Proyecto Ejecutado por el Instituto de Acústica. Universidad Austral de Chile. Moliner, E., Vidal, R., Franco, V., 2013. A fair method for the calculation of the external costs of road traffic noise according to the Eurovignette Directive. Transp. Res. DTransport Environ. 24, 52–61. OECD, Organization for Economic Cooperation and Development, 1991t. Fighting Noise 1990s (Paris) . Pathak, V., Tripathi, B.D., Mishra, V.K., 2008. Evaluation of traffic noise pollution and attitudes of exposed individuals in working place. Atmos. Environ. 42, 3892–3898. Paunovic, K., Jakovljevic, B., Belojevic, G., 2009. Predictors of noise annoyance in noisy and quiet urban streets. Sci. Total Environ. 407, 3707–3711. Paviotti, M., Vogiatzis, K., 2012. On the outdoor annoyance from scooter and motorbike noise in the urban environment. Sci. Total Environ. 430, 223–230. Rey Gozalo, G., Barrigón Morillas, J.M., Gómez, Escobar V., 2012. Analysis of noise exposure in two small towns. Acta Acust. United Ac. 98, 884–893. Rey Gozalo, G., Barrigón Morillas, J.M., Gómez, Escobar V., 2013. Urban streets functionality as a tool for urban pollution management. Sci. Total Environ. 461–462, 453–461. Romeu, J., Genescá, M., Pámines, T., Jiménez, S., 2011. Street categorization for the estimation of the day levels using short-term measurements. Appl. Acoust. 72, 569–577. Ruis-Padillo, A., Torija, A., Ramos-Ridao, Á., Ruiz, D., 2014. A methodology for classification by priority for action: selecting road stretches for network noise action plans. Transp. Res. D-Transport Environ. 29, 66–78. Sorensen, M., Lühdorf, P., Ketzel, M., Andersen, Z., Tjonneland, A., Overvad, K., RaaschouNielsen, O., 2014. Combined effects of road traffic noise and ambient air pollution in relation to risk for stroke? Environ. Res. 133, 49–55. Steele, C., 2001. A critical review of some traffic noise prediction models. Appl. Acoust. 62, 271–287. Su, J.G., Brauer, M., Buzzelli, M., 2008. Estimating urban morphometry at the neighborhood scale for improvement in modeling long-term average air pollution concentrations. Atmos. Environ. 42, 7884–7893.
Suárez, E., Barros, J.L., 2014. Traffic noise mapping of the city of Santiago de Chile. Sci. Total Environ. 466–467, 539–546. Szeremeta, B., Zannin, P.H.T., 2009. Analysis and evaluation of soundscapes in public parks trough interviews and measurement of noise. Sci. Total Environ. 407, 6143–6149. Vogiatzis, K., 2011. Strategic environmental noise mapping & action plans in Athens ring road (Atiiki Odos) — Greece. WSEAS Trans. Environ. Dev. 7, 315–324. Vogiatzis, K., 2012. An assessment of airport environmental noise action plans with some financial aspects: the case of Athens international “Eleftherios Venizelos”. Int. J. Acoust. Vib. 17, 181–190. Vogiatzis, K., 2013. Environmental noise and vibration monitoring and assessment of major road transportation networks: the case of Elefsina (Athens) — Korinthos motorway (2008–2011). Int. J. Sustain. Dev. Plan. 8, 173–185. Vogiatzis, K., 2014. Assessment of environmental noise due to aircraft operation at the Athens International Airport according to the 2002/49/EC Directive and the new Greek national legislation. Appl. Acoust. 84, 37–46. Vogiatzis, K., Remy, N., 2014. From environmental noise abatement to soundscape creation through strategic noise mapping in medium urban agglomerations in South Europe. Sci. Total Environ. 482–483, 420–431. WG-AEN: Assessment of exposure to noise, 2007. Good practice guide for strategic noise mapping and the production of associated data on noise exposure, version 2. European Commission Working Group (August). World Health Organization WHO, 1999. Guidelines for Comunity Noise. Switzerland, Geneva. World Health Organization WHO, 2011. Burden of Disease From Environmental Noise Quantification of Healthy Life Years Lost in Europe. WHO Regional Office for Europe and JCR European Commission. Zannin, P.H.T., Sant'Ana, D.Q., 2011. Noise mapping at different stages of a freeway redevelopment project—a case study in Brazil. Appl. Acoust. 72, 479–486. Zannin, P.H.T., Engel, M.S., Fiedler, P.E.K., Bunn, F., 2013. Characterization of environmental noise based on noise measurements, noise mapping and interviews: a case study at a university campus in Brazil. Cities 31, 317–327.