Environ Sci Pollut Res DOI 10.1007/s11356-017-8813-z
RESEARCH ARTICLE
Assessment of the temporal and spatial distribution of atmospheric PCNs and their air–soil exchange using passive air samplers in Shanghai, East China Qingqi Die 1,2 & Zhiqiang Nie 2 & Bo Yue 2 & Xuemei Zhu 2 & Xingbao Gao 2 & Jianyuan Wang 2 & Yufei Yang 2 & Yanyan Fang 1,2 & Qifei Huang 1,2
Received: 30 November 2016 / Accepted: 13 March 2017 # Springer-Verlag Berlin Heidelberg 2017
Abstract A total of 47 passive air samples and 25 soil samples were collected to study the temporal trend, distribution, and air–soil exchange of polychlorinated naphthalenes (PCNs) in Shanghai, China. Atmospheric PCNs ranged from 3.44 to 44.1 pg/m3 (average of 21.9 pg/m3) in summer and 13.6 to 153 pg/m3 (average of 40.0 pg/m3) in winter. In the soil samples, PCN concentrations were 54.7–1382 pg/g dry weight (average of 319 pg/g). Tri-CNs and tetra-CNs were two dominant homolog groups in air samples, while di-CNs were also found at comparable proportions to tri-CNs and tetra-CNs in soil samples. Most air and soil samples from the industrial and urban areas showed higher PCN concentrations than those from suburban areas. However, some soil samples in urban centers presented higher PCN concentrations than industrial areas. Analysis of PCN sources indicated that both industrial thermal process and historical usage of commercial PCN mixtures contributed to the PCN burden in most areas. The fugacity fraction results indicated a strong tendency of volatilization for lighter PCNs (tri- to hexa-CNs) in both
Responsible editor: Constantini Samara Electronic supplementary material The online version of this article (doi:10.1007/s11356-017-8813-z) contains supplementary material, which is available to authorized users. * Zhiqiang Nie
[email protected] * Qifei Huang
[email protected] 1
College of Water Sciences, Beijing Normal University, Beijing 100875, China
2
State Key Laboratory of Environmental Criteria and Risk Assessment, Chinese Research Academy of Environmental Sciences, Beijing 100012, China
seasons, and air–soil deposition for octa-CNs. Moreover, air– soil exchange fluxes indicate that soil was an important source of atmospheric PCNs in some areas. The results of this study provide information for use in the evaluation of the potential impact and human health risk of PCNs around the study areas. Keywords Polychlorinated naphthalenes . Passive sampling . Source analysis . Air–soil exchange . Fugacity fraction
Introduction Polychlorinated naphthalenes (PCNs) were historically used in dielectric fluids and insulators for their thermal stability, and about 150,000 t of commercial PCN mixtures have been produced (Falandysz 1998). Production of PCNs was assumed to have ended in the 1980s; however, contaminated products were still found on the market in 2003, with cases of PCN-containing products or technical PCN formulations reported in Japan (Yamashita et al. 2003; Falandysz et al. 2008). In addition, recent research has shown that unintentional releases from industrial thermal process are playing a prior role (Helm et al. 2003; Wyrzykowska et al. 2007). Moreover, PCNs have recently been widely detected in the atmosphere, soil, sediment, and other environmental and biological samples (Nadal et al. 2007; Bidleman et al. 2010; Xu et al. 2014; Li et al. 2016). In addition, PCNs in sediments from some typical polluted areas contributed a higher proportion of the contamination than polychlorinated dibenzo-p-dioxins (PCDD/Fs) and polychlorinated biphenyls (PCBs) (Kannan et al. 2001). Given their persistence, toxicity, and bioaccumulation, PCNs were newly listed as persistent organic pollutants (POPs) in 2015. Atmospheric diffusion is an important pathway in the transportation and deposition of POPs. They can enter the environment through exchanges among atmosphere, water, soil, and
Environ Sci Pollut Res
plant by gas/particle distribution, adsorption/desorption, and dry/wet deposition and through the food chain by bioaccumulation and biomagnification because of their high log KOW values (Falandysz and Rappe 1996; Falandysz et al. 1997; Falandysz 2003; Puzyn and Falandysz 2005b). The PCNs present in the atmosphere have been reported in industrial, urban, rural, and remote areas (Helm and Bidleman 2005; Lee et al. 2007; Baek et al. 2008; Xu et al. 2014; Die et al. 2016). Moreover, the detected PCN concentrations were high in urban and industrial areas, especially in Eastern Europe and Asia (more than 30 pg/m3) (Lee et al. 2007). As an important sink and source of POPs, soils play an important role in environmental monitoring and risk assessment. Exchange of POPs between the air and soil interfaces is the key process governing their volatilization and transportation. Air–soil POP exchange data could also provide important information for evaluating the environmental pollution and exposure risk. Earlier research has focused on the air–soil exchange trends of polycyclic aromatic hydrocarbons (PAHs) (Kaya et al. 2012), organochlorine pesticides (Sultana et al. 2014), PCBs (Backe 2004; Li et al. 2009), and PCDD/Fs (Nie et al. 2014). Studies have also examined PCNs in soil in recent years (Hanari et al. 2004; Orlikowska et al. 2009; Wyrzykowska et al. 2007; Wyrzykowska et al. 2009; Pan et al. 2013); however, to our knowledge, there have been few related studies of air–soil exchange of PCNs (Meijer et al. 2001; Wang et al. 2012a). To date, no data on air–soil exchange of PCNs are available for East China. High PCN concentrations have been reported in environmental mediums and industrial exhaust gas from typical industrial areas in East China (Ba et al. 2010; Nie et al. 2011; Liu et al. 2014; Die et al. 2016). Furthermore, PCNs are easily spread from local regions to other areas through the monsoon air masses. Therefore, evaluating the air–soil exchange status of PCNs in typical areas of East China is valuable in assessing the possible impact of PCNs in adjacent regions. The aims of present research were as follows: (1) to elucidate the occurrence, seasonal variation, and spatial distribution of atmospheric PCNs using passive air samplers (PASs) for long-term monitoring, (2) to research spatial trends and the levels of PCNs in soils from Shanghai, and (3) to estimate the equilibrium status and exchange fluxes of PCNs in these areas. The results in this study are also expected to be beneficial for improving our understanding of the sources, transport, and fate of PCNs among the region.
Method Sampling A total of 25 PASs were placed to collect air samples in summer (June to August 2013) based on the grid method (Fig. 1),
and further sampling was also conducted in winter (November 2013 to January 2014) in Shanghai. The sampling sites were divided into industrial areas (B1–B13), urban areas (B14– B20), suburban areas (B21–B24), and a background site far from the city (B25). Two samplers (B18 and B21) were lost in summer and one sampler (B12) was lost in winter. Polyurethane foam (PUF) disks were preprocessed with acetone before use. When the PASs were first placed, topsoil (0– 5 cm, vegetation removed) was also collected around the PASs (5 km), and thus, the local sources are likely to have had little influence on B3, resulting in a lower PCN concentration. The PCN concentration in B3 was much lower than the other industrial sites in summer and similar to the suburban sites. Moreover, the wind in Shanghai was southeasterly in summer and thus air from the East Sea may have caused the low PCN concentration in B3. The results at B3 in winter, under the northerly wind, contrasted to those in summer.
Spatial distribution of PCN in soil Total PCN concentrations in soil samples were 54.7–1382 pg/g (average of 319 pg/g) (Fig. 2c). The average concentrations for industrial, urban, and suburban (rural) areas were 251, 447, and 105 pg/g (except S24), respectively. The PCN-corresponding TEQs of soil samples ranged from 8.79 to 375 fg-TEQ/g (average of 77.0 fg-TEQ/g) (Fig. 2d). The spatial trend of PCNs in soil samples was similar to the atmosphere; higher PCN concentrations and TEQs were found in industrial areas or urban areas, while lower levels were found in the suburban and rural areas (Fig. S1). This is consistent with the distribution of PCNs in soils found in the PRD (Wang et al. 2012b). A similar spatial distribution of PCDD/Fs, PCBs, and PAHs has been observed in other studies, which is typically ascribed to the proximity of
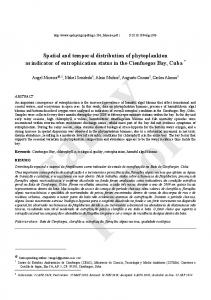
primary industrial sources (Bakoglu et al. 2005; Fu et al. 2009; Kaya et al. 2012). The highest PCN concentration was found at site S16 (located in the urban center), and the lowest was found at site S21 (located in suburban area). In particular, S15, S19, and S20 also had higher PCN concentrations than other industrial sites. Of these, S15 is located to the cross area of residential and industrial zones, which both increased the PCN pollution. The PCN concentrations and TEQs of samples from S16, S19, and S20 (lawn soils collected from the park in the urban center) were higher than from other sites. Moreover, there was no clear evidence that there were PCN sources in the park. Therefore, we speculated that these lawn soils may have originated from other sources outside the urban park. In the suburban and rural areas, the soil sample from S24 also had a much higher PCN concentration than those at other sites. When we collected the soil sample in this location, wheat had been harvested and straw is typically incinerated in the fields. Burning of vegetative material is an important PCN source (Helm et al. 2004; Harner et al. 2006) and is therefore likely to be the cause of the high observed concentration of PCNs. Comparison of the PCN concentrations in soil with those of other studies indicates that the results from Shanghai were higher than surface soils in the PRD (9.5–666 pg/g) (Wang et al. 2012a) but lower than upland soil (950–3550 pg/g) and paddy soil (610–6600 pg/g) from the Liaohe River Basin (Li et al. 2016). They were also higher than in soils from the UK (Meijer et al. 2001) and soils from Catalonia, Spain (32– 180 pg/g in 2002 (Schuhmacher et al. 2004) and 17–142 pg/ g in 2005 (Nadal et al. 2007)). Distribution patterns and source analysis The homolog profiles of atmospheric PCNs were similar among the three areas (Fig. 3). The dominant congener was CN-24/14 (26.2% in summer and 22.4% in winter), and triCNs and tetra-CNs were the two governing homolog groups in the majority of atmospheric samples (Fig. S2). The compositions of tri-, tetra-, penta-, and hexa-CNs were 49.8, 34.2, 10.2, and 4.89% in summer, and 58.3, 31.0, 4.38, and 4.79% in winter, respectively. Wang et al. (2012b) reported that triCNs were the dominant homologs in air, and the proportion of homologs decreased with the increase in the chlorine atomic number. The proportion of heavier PCNs increased during the colder winter months, possibly because of the reduced evaporation under cold temperatures (Helm et al. 2004; Die et al. 2016). In addition, the similarity of homolog profiles in atmospheric PCNs among the different areas indicates that atmospheric PCNs in Shanghai are widely distributed and may thus come from similar sources. The homolog profiles of PCNs in soil showed discrepancies among the urban, suburban, and rural areas (Fig. 3),
Environ Sci Pollut Res 0.8
industrial area
0.8
urban area
0.6
0.6
0.6
0.4
0.4
0.4
0.2
0.2
0.2
0.0
0.0
0.0
0.8
0.8
0.8
0.6
0.6
0.6
0.4
0.4
0.4
0.2
0.2
0.2
0.0
0.0
0.0
0.6
0.6
0.6
0.4
0.4
0.4
0.2
0.2
0.2
0.0
0.0
0.0
suburban area
OCN
HpCN
PeCN
HxCN
TiCN
TeCN
DiCN
MoCN
OCN
HxCN
HpCN
PeCN
TiCN
TeCN
DiCN
MoCN
OCN
HxCN
HpCN
PeCN
TiCN
TeCN
DiCN
MoCN
soil
winter air
summer air
0.8
Fig. 3 Homolog profiles in air samples and soil samples in the three main study regions (industrial, urban, and suburban areas) of Shanghai (MoCNs and DiCNs in air were not included; tri-CNs (TiCN), tetra-CNs (TeCN), penta-CNs (PeCN), hexa-CNs (HxCN), hepta-CNs (HpCN), octa-CNs (OCN))
indicating that PCNs in soil were more influenced by adjacent sources. The two dominant congeners remained CN-5/7 and CN-24/14, and di-, tri-, and tetra-CNs were the three predominant homologs in nearly all soil samples. Tri-CNs and tetraCNs were also found as dominant in soil by other researchers (Wang et al. 2012a; Xu et al. 2014). However, there has been no previous data reported for di-CNs in soil and we found that di-CNs accounted for a high proportion of total PCNs in our study, especially in some soil samples. Di-CNs accounted for 71.7 and 51.8% of total PCNs in S5 and S24, respectively (Fig. S2), and CN-5/7 was the major congener accounting for 53.4 and 26.9% of total PCNs, respectively. In addition, penta-CNs accounted for 30.3, 42.7, 40.6, and 24.6% of total PCNs in S13, S16, S19, and S20, respectively, which were much higher than those found in other soil samples (Fig. S2). The observed differences may reflect the variation of PCN sources in these soils. The results also supported our earlier speculation that PCNs present in these soils may originate from other sources outside the urban park. There are three major sources of PCNs in the environment: the technical formulations of PCNs (such as the Halowax series), industrial thermal processes, and impurities in technical formulations of PCBs. Congener profiles reported for PCNs in the Halowax series indicated that there were large variations among different Halowax series and batches
(Falandysz et al. 2006; Falandysz et al. 2008). Octa- and hepta-CN homolog groups were the main CN constituents of Halowax 1051; mono- and di-CNs were dominant in Halowax 1031 and 1000; tri- and tetra-CNs were dominant in Halowax 1001 and 1099; and tetra- and penta-CNs were the dominant homologs in Halowax 1013. The penta- and hexa-CNs were the dominant homologs in Halowax 1014 and the commercial PCB mixtures that were produced in the past, including Aroclor1248, Aroclor1232, Clophen-A40, KC-300, KC-400, and Phenoclor-DP4. Less-chlorinated PCN homologs (monothrough tetra-CNs) were the dominant homologs in gas emitted from industrial thermal sources. The characteristics of PCN profiles from differently cataloged sources have been applied to identify the specific source of PCNs in the environment (Schneider et al. 1998; Helm and Bidleman 2003; Pan et al. 2007). The latest research into PCNs using two-dimensional gas chromatography/quadrupole mass spectrometry resolved separation of closely eluting PCN congeners (such as CN-52 and CN-60, CN-66 and CN-67) and indicated that CN fingerprinting appears to become more reliable when using congenerspecific data for CN-52 and CN-60, and TEQs for CN-66 and CN-67 (Hanari et al. 2013). However, most previous research used HRGC/HRMS and other instruments. Moreover, some PCN co-eluting congeners (CNs - 45/36, CN - 54, CNs - 66/
Environ Sci Pollut Res
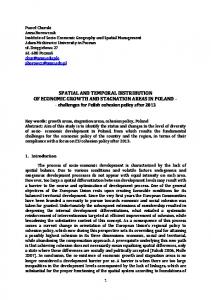
67, and CN - 73) from thermal processes have been identified that are absent or present in trace amounts in the technical formulations of PCNs and PCBs but are abundant in thermal-related processes (Lee et al. 2005; Baek et al. 2008; Gregoris et al. 2014). These congeners were recognized as combustion-related and have been used to analyze the sources of PCNs in air (Helm and Bidleman 2003; Helm et al. 2004; Wang et al. 2012b). In addition, ratios of some specific PCN congeners also were useful for PCN source analysis. For example, the ratios of CN-1 to CN-2 and CN-5/7 to CN-6/12 varied between fly ash samples from MSW incinerators and Halowax samples (Schneider et al. 1998; Hu et al. 2013). In addition, the ratio of CN-73 to CN-74 was less than 1 for Halowaxes, but greater than 1 in stack gas or fly ash samples from thermal-related sources (Noma et al. 2004; Takasuga et al. 2004; Liu et al. 2012). Some combustion-related PCN congeners (CN-17/25, CN36/45, CN-39, CN-35, CN-50, CN-52/60, CN-51, CN-54, and CN-66/67) have been shown to be small (below 11%) in technical PCN mixtures (Halowax mixtures) but rich (above 50%) in incineration fly ashes (Helm and Bidleman 2003). In the current study, the ratios of these PCN congeners to PCNs (sum of tri-CNs to octa-CNs) (Table S4) were 18–41% (average of 30%) in summer and 19–39% (average of 28%) in winter except for B4 (69%) in winter. Almost all values were higher than 11% and lower than 50%, indicating that wood combustion sources and technical PCN mixtures make a combined effect to the atmospheric PCNs. These results were in agreement with our previous study using AASs (Die et al. 2016). In particular, the value of B4 in winter was higher than 50%, indicating that the combustion process was the dominant source. The contribution of combustion-related PCNs to total PCNs (tri-CNs to octa-CNs) for soil samples (in Table S4) was 12–42% (average of 20%) except for S16 (7.0%). The values were also greater than 11% and lower than 50%, suggesting that industrial emissions and wood combustion also make a combined effect to the PCN load (Wang et al. 2012a). In particular, it was lower than 11% at S16, indicating that PCNs in S16 may come from emissions from the past use of commercial PCN mixtures. Ratios of some congeners (CN-1:CN-2, CN-5/7:CN-6/12, CN-45/36:CN-42, CN-54:CN-53/55, CN-66/67:CN-71/72, and CN-73:CN-74) at the current study sites are presented in Fig. 4 and Table S4. These values were similar to those from our previous study using AASs (Die et al. 2016). It is therefore likely that the passive air samples came from similar sources to the study using AAS samples. Ratios of CNs-45/36:CN-42, CN-54:CNs-53/55, CNs-66/67:CN-71/72, and CN-73:CN-74 were all in the same range with thermal-related processes and higher than technical PCN formulations and technical PCB formulations (Liu et al. 2014). These results suggest that PCNs in atmospheric and soil samples from Shanghai were strongly influenced by emissions from industrial thermal
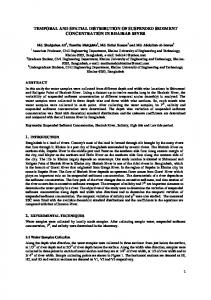
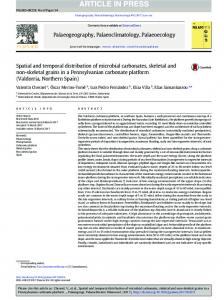
sources (such as the secondary metal smelting process and waste incineration). Air–soil exchange and estimated PCN fluxes The PCN concentrations in soils have been shown to be steady and negligible over short periods (Wang et al. 2012a). The air PCN concentrations and their corresponding soil concentrations were used to calculate the fugacity values at each site. Detailed fugacity and air–soil flux calculations were derived from previous studies (Puzyn and Falandysz 2007a, b; Puzyn et al. 2008; Puzyn et al. 2009; Wang et al. 2012a; Tian et al. 2015) and are presented in the supplementary material. Generally, ff was defined as ff = fs / (fs + fa), where fs and fa are the fugacity of chemicals in soil and air. The PCN homolog concentrations were used to calculate the ff values (Fig. 5). The ff values of different homolog groups increased with a decreasing degree of chlorination (from 0.01 to 0.99). The ff values of tri- through penta-CNs exceeded or approached 0.75 in summer and winter, suggesting a clear net transfer from soil to air in both periods. The statuses of hexa-CNs and octa-CNs were closer to equilibrium (taking the uncertainty of 0.25 into consideration) in summer except for some urban sites, while hepta- and octa-CNs all tended toward net deposition in winter. The seasonal variation of ff for the PCNs was consistent with previous research for other POPs (Backe 2004; Bidleman and Leone 2004). The seasonal change of air–soil exchange was notably affected by temperature and variation in atmospheric PCN concentrations. Furthermore, the volatilization of tri- through penta-CNs occurred in all areas, caused by their huge fugacity difference in soil and air. The quite low atmospheric concentrations of tri- to penta-CNs may have been related to the sampling methods and variations of atmospheric concentrations. Some ff values of hexa-CNs to octa-CNs in the urban center were higher than those in industrial and suburban areas in both summer and winter. We attributed this to the high PCN concentrations in these urban soils (S15, S16, S19, and S20). This also indicates that PCNs in these areas were more inclined toward volatilization from soil to air. In addition, detailed exchange flux data were also calculated, which could provide important information of PCN volatilization or deposition (Tian et al. 2015). The transfer of POPs between air and soil interfaces is driven by their difference in fugacity (Mackay and Paterson 1991). The exhaustive estimate method has been applied by other researchers (Harner et al. 2001; Backe 2004) and listed in the supplementary material. Detailed results of PCN air–soil exchange fluxes are presented in Fig. 6 and listed in Table S5. A negative flux value implies deposition from air, and a positive flux value implies that there was volatilization from soil. The ff values decreased in winter, and net volatilization fluxes also decreased, while the net deposition fluxes increased (Fig. 6). These results were similar to previous air–soil exchange studies of PCBs in
Environ Sci Pollut Res urban area
winter air
summer air
soil
industrial area
suburban area
100
100
100
10
10
10
1
1
1
0.1
0.1
0.1
0.01
0.01
0.01
100
100
100
10
10
10
1
1
1
0.1
0.1
0.1
0.01
0.01
0.01
100
100
100
10
10
10
1
1
1
0.1
0.1
0.1
0.01
0.01
0.01 B
C
D
E
F
G
B
C
D
E
F
G
B
C
D
E
F
G
Fig. 4 Ratios of characteristic congeners in air and soil samples in three regions (B, C, D, E, F, and G stand for ratios of CN-1 to CN-2, CNs-5/7 to CNs6/12, CNs-45/36 to CN-42, CN-54 to CNs-53/55, CNs-66/67 to CN-71/72, and CN-73 to CN-74, respectively)
Turkey (Backe 2004; Tasdemir et al. 2012). The highest flux of PCNs from soil to air was found at S24 (133 pg/m2/day for
industrial areas
Summer
Winter
1.0 0.8 0.6 0.4 0.2 0.0
urban areas ff
1.0 0.8 0.6 0.4 0.2 0.0
suburban areas
Fig. 5 Fugacity fractions for PCN homologs in summer and winter air samples and soil samples in the three main study regions (industrial, urban, and suburban areas) of Shanghai
tri-CNs) in summer, while the highest deposition flux occurred at S4 (−1.21 pg/m2/day for octa-CNs) in winter. The
1.0 0.8 0.6 0.4 0.2 0.0 TiCN
TeCN PeCN HxCN HpCN
OCN
TiCN
TeCN PeCN HxCN HpCN
OCN
Environ Sci Pollut Res
40
40
30
30
20
20
10
10
0
0
-10
-10
150
150
100
100
50
50
0
0
-50
-50
urban area
N (pg/m2/day)
winter 50
industrial area
N (pg/m2/day)
summer 50
suburban area
150 N (pg/m2/day)
150 100
100
50
50
0
0
-50
-50 TiCN
TeCN
PeCN
HxCN
HpCN
OCN
TiCN
TeCN
PeCN
HxCN
HpCN
OCN
Fig. 6 Estimated air–soil gas exchange flux of PCNs in summer and winter in the three main study regions (industrial, urban, and suburban areas) of Shanghai
net evaporation fluxes appeared to be much lower than the flux of dioxin-like PCBs in Shanghai in our previous study (Tian et al. 2015) and air–soil flux of PCBs but similar to fluxes in Uludag University in Turkey after 2009 (Tasdemir et al. 2012). This indicates that volatilization from soil was an important source for atmospheric PCNs in the study areas. Based on the net air–soil fluxes of PCNs, the results also indicate that the low molecular weight PCNs, including tri- through penta-CNs, were the most active PCNs in terms of exchange between air and soil interfaces. The heavier PCNs were less active because of the very low fugacity difference and low concentrations in the atmosphere and soil. The highest exchange fluxes recorded in our study were found in urban areas and at a particular suburban site (S24). This strong evaporation of PCNs revealed that the soils may be polluted by local PCN sources. In general, POPs in soils from rural and background areas are more likely to be derived from long-range transport (Backe 2004). Air–soil equilibrium is more likely to occur in regions without a recent POP source (Wang et al. 2011). Therefore, the relatively high flux at S24 suggests that S24 was polluted by some local PCN sources. The PCNs around these sites could lead to health risks to nearby residents. Furthermore, the high PCN concentrations and net evaporation flux in these areas should receive further observation and research attention.
Conclusion Overall, passive air samples and corresponding soil samples were collected and analyzed for PCNs at different regions in Shanghai and air–soil exchanges were calculated. Significant seasonal and spatial variations of atmospheric PCN concentrations and TEQs were observed, indicating that land use patterns and industrial sources affected PCN concentrations and subsequently their environmental distribution. Moreover, some high PCN concentrations in an urban park soil were also observed. Many factors were considered to be contributors to the observed spatial and temporal differences in PCN occurrence, such as PCN properties, wind directions, temperature, and land use patterns. The distribution characteristics of homologs and congeners showed that vegetation combustion sources and the historical usage of technical PCN mixtures make a combined effect to the PCN burden at most sites. Moreover, strong net soil–air transfers for lighter PCNs (tri- to hexa-CNs) were observed in both seasons, and their estimated fluxes were similar to PCB flux in other cities.
Acknowledgements We acknowledge financial support from the National Natural Science Foundation of China (Grant No. 21407137), State Key Laboratory of Environmental Criteria and Risk Assessment, CRAES (SKLECRA 201628), and National Science and Technology Support Program Project (No. 2014BAL02B01).
Environ Sci Pollut Res
References Ba T, Zheng M, Zhang B, Liu W, Su G, Liu G, Xiao K (2010) Estimation and congener-specific characterization of polychlorinated naphthalene emissions from secondary nonferrous metallurgical facilities in China. Environ Sci Technol 44:2441–2446 Backe C (2004) PCB in soils and estimated soil–air exchange fluxes of selected PCB congeners in the south of Sweden. Environ Pollut 128: 59–72 Baek S-Y, Choi S-D, Lee S-J, Chang Y-S (2008) Assessment of the spatial distribution of coplanar PCBs, PCNs, and PBDEs in a multi-industry region of South Korea using passive air samplers. Environ Sci Technol 42:7336–7340 Bakoglu M, Karademir A, Durmusoglu E (2005) Evaluation of PCDD/F levels in ambient air and soils and estimation of deposition rates in Kocaeli, Turkey. Chemosphere 59:1373–1385 Bidleman TF, Leone AD (2004) Soil–air exchange of organochlorine pesticides in the Southern United States. Environ Pollut 128:49–57 Bidleman TF, Helm PA, Braune BM, Gabrielsen GW (2010) Polychlorinated naphthalenes in polar environments—a review. Sci Total Environ 408:2919–2935 Die Q, Nie Z, Fang Y, Yang Y, Gao X, Tian Y, He J, Liu F, Huang Q, Tian S (2016) Seasonal and spatial distributions of atmospheric polychlorinated naphthalenes in Shanghai, China. Chemosphere 144:2134–2141 Falandysz J (1998) Polychlorinated naphthalenes: an environmental update. Environ Pollut 101:77–90 Falandysz J (2003) Chloronaphthalenes as food-chain contaminants: a review. Food Addit Contam 20:995–1014 Falandysz J, Rappe C (1996) Spatial distribution in plankton and bioaccumulation features of polychlorinated naphthalenes in a pelagic food chain in southern part of the Baltic proper. EnvironSciTechnol 30: 3362–3370 Falandysz J, Strandberg B, Strandberg L, Bergqvist PA, Rappe C (1997) Concentrations and biomagnification of polychlorinated naphthalenes in black cormorants Phalacrocorax carbo sinensis from the Gulf of Gdansk, Baltic Sea. Sci Total Environ 204:97–106 Falandysz J, Nose K, Ishikawa Y, Łukaszewicz E, Yamashita N, Noma Y (2006) HRGC/HRMS analysis of chloronaphthalenes in several batches of Halowax 1000, 1001, 1013, 1014 and 1099. J Environ Sci Health Part A 41:2237–2255 Falandysz J, Chudzyński K, Takekuma M, Yamamoto T, Noma Y, Hanari N, Yamashita N (2008) Multivariate analysis of identity of imported technical PCN formulation. J Environ Sci Health Part A Toxic Hazard Subst Environ Eng 43:1381–1390 Falandysz J, Fernandes A, Gregoraszczuk E, Rose M (2014) The toxicological effects of halogenated naphthalenes: a review of aryl hydrocarbon receptor-mediated (dioxin-like) relative potency factors. J Environ Sci Health Part C Environ Carcinogen Ecotoxicol Rev 32: 239–272 Fu S, Cheng HX, Liu YH, Yang ZZ, Xu XB (2009) Spatial character of polychlorinated biphenyls from soil and respirable particulate matter in Taiyuan, China. Chemosphere 74:1477–1484 Gregoris E, Argiriadis E, Vecchiato M, Zambon S, De Pieri S, Donateo A, Contini D, Piazza R, Barbante C, Gambaro A (2014) Gas-particle distributions, sources and health effects of polycyclic aromatic hydrocarbons (PAHs), polychlorinated biphenyls (PCBs) and polychlorinated naphthalenes (PCNs) in Venice aerosols. Sci Total Environ 476-477:393–405 Hanari N, Horii Y, Taniyasu S, Falandysz J, Bochentin I, Orlikowska A, Puzyn T, Yamashita N (2004) Isomer specific analysis of polychlorinated naphthalenes in pine trees (Pinus thunbergii Parl.) and (Pinus densiflora Sieb. et Zucc) needles around Tokyo Bay, Japan. Pol J Environ Stud 13:139–151
Hanari N, Falandysz J, Nakano T, Petrick G, Yamashita N (2013) Separation of closely eluting chloronaphthalene congeners by twodimensional gas chromatography/quadrupole mass spectrometry: an advanced tool in the study and risk analysis of dioxin-like chloronaphthalenes. J Chromatogr A 1301:209–214 Harner T, Bidleman TF, Jantunen LM, Mackay D (2001) Soil—air exchange model of persistent pesticides in the United States cotton belt. Environ Toxicol Chem 20:1612–1621 Harner T, Shoeib M, Gouin T, Blanchard P (2006) Polychlorinated naphthalenes in Great Lakes air: assessing spatial trends and combustion inputs using PUF disk passive air samplers. Environ Sci Technol 40: 5233–5243 Helm PA, Bidleman TF (2003) Current combustion-related sources contribute to polychlorinated naphthalene and dioxin-like polychlorinated biphenyl levels and profiles in air in Toronto, Canada. Environ Sci Technol 37:1075–1082 Helm PA, Bidleman TF (2005) Gas-particle partitioning of polychlorinated naphthalenes and non- and mono-ortho-substituted polychlorinated biphenyls in arctic air. Sci Total Environ 342:161–173 Helm PA, Jantunen LM, Ridal J, Bidleman TF (2003) Spatial distribution of polychlorinated naphthalenes in air over the Great Lakes and airwater gas exchange in Lake Ontario. Environ Toxicol Chem 22: 1937–1944 Helm PA, Bidleman TF, Li HH, Fellin P (2004) Seasonal and spatial variation of polychlorinated naphthalenes and non-mono-orthosubstituted polychlorinated biphenyls in Arctic air. Environ Sci Technol 38:5514–5521 Hogarh JN, Seike N, Kobara Y, Masunaga S (2013) Seasonal variation of atmospheric polychlorinated biphenyls and polychlorinated naphthalenes in Japan. Atmos Environ 80:275–280 Hu J, Zheng M, Liu W, Li C, Nie Z, Liu G, Zhang B, Xiao K, Gao L (2013) Characterization of polychlorinated naphthalenes in stack gas emissions from waste incinerators. Environ Sci Pollut Res Int 20:2905–2911 Kannan K, Kober JL, Kang Y-S, Masunaga S, Nakanishi J, Ostaszewski A, Giesy JP (2001) Polychlorinated naphthalenes, biphenyls, dibenzo-pdioxins, and dibenzofurans as well as polycyclic aromatic hydrocarbons and alkylphenols in sediment from the Detroit and Rouge Rivers, Michigan, USA. Environ Toxicol Chem 20:1878–1889 Kaya E, Dumanoglu Y, Kara M, Altiok H, Bayram A, Elbir T, Odabasi M (2012) Spatial and temporal variation and air–soil exchange of atmospheric PAHs and PCBs in an industrial region. Atmos Pollut Res 3:435–449 Kim SK, Park JE (2014) Comparison of two different passive air samplers (PUF-PAS versus SIP-PAS) to determine time-integrated average air concentration of volatile hydrophobic organic pollutants. Ocean Sci J 49:137–150 Lee RG, Coleman P, Jones JL, Jones KC, Lohmann R (2005) Emission factors and importance of PCDDFs, PCBs, PCNs, PAHs and PM10 from the domestic burning of coal and wood in the U.K. Environ Sci Technol 39:1436–1447 Lee SC, Harner T, Pozo K, Shoeib M, Wania F, Muir DCG, Barrie LA, Jones KC (2007) Polychlorinated naphthalenes in the global atmospheric passive sampling (GAPS) study. Environ Sci Technol 41: 2680–2687 Lee S-J, Ale D, Chang Y-S, Oh J-E, Shin SK (2008) Seasonal and particle size-dependent variations in gas/particle partitioning of PCDD/Fs. Environ Pollut 153:215–222 Li Y-F, Harner T, Liu L, Zhang Z, Ren N-Q, Jia H, Ma J, Sverko E (2009) Polychlorinated biphenyls in global air and surface soil: distributions, air−soil exchange, and fractionation effect†. Environ Sci Technol 44:2784–2790 Li Q, Xu Y, Li J, Pan X, Liu X, Zhang G (2012) Levels and spatial distribution of gaseous polychlorinated biphenyls and polychlorinated naphthalenes in the air over the northern South China Sea. Atmos Environ 56:228–235
Environ Sci Pollut Res Li F, Jin J, Gao Y, Geng N, Tan D, Zhang H, Ni Y, Chen J (2016) Occurrence, distribution and source apportionment of polychlorinated naphthalenes (PCNs) in sediments and soils from the Liaohe River Basin, China. Environ Pollut 211:226–232 Lin Y, Zhao Y, Qiu X, Ma J, Yang Q, Shao M, Zhu T (2013) Spatial distribution of polychlorinated naphthalenes in the atmosphere across North China based on gridded field observations. Environ Pollut 180:27–33 Liu G, Zheng M, Du B, Nie Z, Zhang B, Liu W, Li C, Hu J (2012) Atmospheric emission of polychlorinated naphthalenes from iron ore sintering processes. Chemosphere 89:467–472 Liu G, Cai Z, Zheng M (2014) Sources of unintentionally produced polychlorinated naphthalenes. Chemosphere 94:1–12 Mackay D, Paterson S (1991) Evaluating the multimedia fate of organic chemicals: a level III fugacity model. Environ Sci Technol 25:427–436 Manodori L, Gambaro A, Moret I, Capodaglio G, Cairns WR, Cescon P (2006) Seasonal evolution of gas-phase PCB concentrations in the Venice Lagoon area. Chemosphere 62:449–458 Meijer SN, Harner T, Helm PA, Halsall CJ, Johnston A, Jones KC (2001) Polychlorinated naphthalenes in UK soils: time trends, markers of source, and equilibrium status. Environ Sci Technol 35:4205–4213 Nadal M, Schuhmacher M, Domingo JL (2007) Levels of metals, PCBs, PCNs and PAHs in soils of a highly industrialized chemical/ petrochemical area: temporal trend. Chemosphere 66:267–276 Nie Z, Zheng M, Liu W, Zhang B, Liu G, Su G, Lv P, Xiao K (2011) Estimation and characterization of PCDD/Fs, dl-PCBs, PCNs, HxCBz and PeCBz emissions from magnesium metallurgy facilities in China. Chemosphere 85:1707–1712 Nie Z, Die Q, Yang Y, Tang Z, Wang Q, Huang Q (2014) Concentrations, atmospheric partitioning, and air–water/soil surface exchange of polychlorinated dibenzo-p-dioxin and dibenzofuran along the upper reaches of the Haihe River basin, North China. Environ Sci Pollut Res 1–13 Noma Y, Yamamoto T, Sakai S-I (2004) Congener-specific composition of polychlorinated naphthalenes, coplanar PCBs, dibenzo-p-dioxins, and dibenzofurans in the halowax series. Environ Sci Technol 38: 1675–1680 Orlikowska A, Hanari N, Wyrzykowska B, Bochentin I, Horii Y, Yamashita N, Falandysz J (2009) Airborne chloronaphthalenes in Scots pine needles of Poland. Chemosphere 75:1196 Pan J, Yang YL, Xu Q, Chen DZ, Xi DL (2007) PCBs, PCNs and PBDEs in sediments and mussels from Qingdao coastal sea in the frame of current circulations and influence of sewage sludge. Chemosphere 66:1971–1982 Pan J, Yang Y, Zhu X, Yeung LW, Taniyasu S, Miyake Y, Falandysz J, Yamashita N (2013) Altitudinal distributions of PCDD/Fs, dioxinlike PCBs and PCNs in soil and yak samples from Wolong high mountain area, eastern Tibet-Qinghai Plateau, China. Sci Total Environ 444:102–109 Puzyn T, Falandysz J (2005a) Computational estimation of logarithm of n-octanol/air partition coefficient and subcooled vapor pressures of 75 chloronaphthalene congeners. Atmos Environ 39:1439–1446 Puzyn T, Falandysz J (2005b) Octanol/water partition coefficients of chloronaphthalenes. J Environ Sci Health Part A Toxic Hazard Subst Environ Eng 40:1651–1663 Puzyn T, Falandysz J (2007a) Application and comparison of different chemometric approaches in QSPR modelling of supercooled liquid vapour pressures for chloronaphthalenes†. SAR QSAR Environ Res 18:299–313 Puzyn T, Falandysz J (2007b) QSPR modeling of partition coefficients and Henry’s law constants for 75 chloronaphthalene congeners by means of six chemometric approaches—a comparative study. J Phys Chem Ref Data 36:203–214
Puzyn T, Mostrąg A, Suzuki N, Falandysz J (2008) QSPR-based estimation of the atmospheric persistence for chloronaphthalene congeners. Atmos Environ 42:6627–6636 Puzyn T, Mostrag A, Falandysz J, Kholod Y, Leszczynski J (2009) Predicting water solubility of congeners: chloronaphthalenes—a case study. J Hazard Mater 170:1014–1022 Schneider M, Stieglitz L, Will R, Zwick G (1998) Formation of polychlorinated naphthalenes on fly ash. Chemosphere 37:2055– 2070 Schuhmacher M, Nadal M, Domingo JL (2004) Levels of PCDD/Fs, PCBs, and PCNs in soils and vegetation in an area with chemical and petrochemical industries. Environ Sci Technol 38:1960–1969 Sultana J, Syed JH, Mahmood A, Ali U, Rehman MYA, Malik RN, Li J, Zhang G (2014) Investigation of organochlorine pesticides from the Indus Basin, Pakistan: sources, air–soil exchange fluxes and risk assessment. Sci Total Environ 497:113–122 Takasuga T, Inoue T, Ohi E, Kumar KS (2004) Formation of polychlorinated naphthalenes, dibenzo-p-dioxins, dibenzofurans, biphenyls, and organochlorine pesticides in thermal processes and their occurrence in ambient air. Arch Environ Contam Toxicol 46:419–431 Tasdemir Y, Salihoglu G, Salihoglu NK, Birgul A (2012) Air-soil exchange of PCBs: seasonal variations in levels and fluxes with influence of equilibrium conditions. Environ Pollut 169:90–97 Tian Y, Nie Z, He J, Die Q, Fang Y, Liu F, Yang Y, Gao X, Huang Q (2015) Seasonal variations in concentrations, distributions, and air– soil exchange fluxes of dioxin-like polychlorinated biphenyls in Shanghai, China. Environ Sci Pollut Res 1–9 Tuduri L, Harner T, Hung H (2006) Polyurethane foam (PUF) disks passive air samplers: wind effect on sampling rates. Environ Pollut 144:377–383 Wang W, Simonich S, Giri B, Chang Y, Zhang Y, Jia Y, Tao S, Wang R, Wang B, Li W (2011) Atmospheric concentrations and air–soil gas exchange of polycyclic aromatic hydrocarbons (PAHs) in remote, rural village and urban areas of Beijing–Tianjin region, North China. Sci Total Environ 409:2942–2950 Wang Y, Cheng Z, Li J, Luo C, Xu Y, Li Q, Liu X, Zhang G (2012a) Polychlorinated naphthalenes (PCNs) in the surface soils of the Pearl River Delta, South China: distribution, sources, and air-soil exchange. Environ Pollut 170:1–7 Wang Y, Li Q, Xu Y, Luo C, Liu X, Li J, Zhang G (2012b) Improved correction method for using passive air samplers to assess the distribution of PCNs in the Dongjiang River basin of the Pearl River Delta, South China. Atmos Environ 54:700–705 Wyrzykowska B, Hanari N, Orlikowska A, Bochentin I, Rostkowski P, Falandysz J, Taniyasu S, Horii Y, Jiang Q, Yamashita N (2007) Polychlorinated biphenyls and -naphthalenes in pine needles andsoil from Poland—concentrations and patterns in view of long-term environmental monitoring. Chemosphere 67:1877–1886 Wyrzykowska B, Hanari N, Orlikowska A, Yamashita N, Falandysz J (2009) Dioxin-like compound compositional profiles of furnace bottom ashes from household combustion in Poland and their possible associations with contamination status of agricultural soil and pine needles. Chemosphere 76:255–263 Xu Y, Li J, Chakraborty P, Syed JH, Malik RN, Wang Y, Tian C, Luo C, Zhang G, Jones KC (2014) Atmospheric polychlorinated naphthalenes (PCNs) in India and Pakistan. Sci Total Environ 466-467: 1030–1036 Yamashita N, Taniyasu S, Hanari N, Horii Y, Falandysz J (2003) Polychlorinated naphthalene contamination of some recently manufactured industrial products and commercial goods in Japan. J Environ Sci Health Part A 38:1745–1759