African Journal of Agricultural Research
Vol. 9(1), pp. 119-124, 2 January, 2014 DOI: 10.5897/AJAR12.2163 ISSN 1991-637X ©2014 Academic Journals http://www.academicjournals.org/AJAR
Full Length Research Paper
Bhat: A new source of genetic divergence for soybean improvement Anupam Barh1*, Pushpendra2, R. K. Khulbe2 and Meenakshi Joshi1 1
Genetics and Plant Breeding, G.B. Pant University of Agriculture and Technology Pantnagar M/S Uttranchal Diseal and Services Adarsh Colony Rudrapur Uttrakhand -263145, India. 2 G.B. Pant University of Agriculture and Technology Pantnagar, College of Agriculture, Uttrakhand, India. Accepted 12 November, 2013
Black soybean, a treasure house of the medicinal properties; can it be used to break the yield and quality barrier? For this, study was conducted by in 2012 on genetic divergence for yield and different 2 yield contributing traits in 48 genotypes of black soybean collected from Uttarakhand hills, using D Mahalanobis cluster analysis with correlation between the 13 trait taken and variability studies was done. These genotypes were grouped in 12 clusters. The Cluster I comprised of five genotypes while the Cluster II comprised thirteen genotypes. Cluster III had four genotypes, Cluster IV consisted of nineteen genotypes and largest cluster whereas Cluster V, VI, VIII, IX, X, XI and XII were found to be monogenotypic each, while Cluster VII had two genotypes. Intra-cluster average D values ranged from 0.00 to 10.004. The inter-cluster average D2-value was maximum between Cluster IX and XI both with one genotype (90.85), followed by average D2-value between Cluster IX and XII with one genotype each (84.10). The divergence pattern shows that some of these genotypes are of real importance for hybridisation and for F1s and for obtaining trangressive segregants. These genotypes definitely having different yield and yield component with quality too, compared to normal soybean. Key words: Bhat, genetic divergence, clusters.
INTRODUCTION Black-seeded soybean, locally known as Bhat / Bhatmash, is grown in Kumaon region and in its bordering states and countries in the Himalayas (Shah, 2006). The black-seeded and other coloured varieties are grown from ancient time in the hills and occupied important place in staple diet. In Uttarakhand region of India, these soybean varieties are known as Bhat. It is believed that soybean was introduced via Burma by traders from Indonesia. As a result, it has been traditionally grown on a small scale in H.P., Kumaon hills of Uttarakhand, Eastern Bengal, Khasi hills and parts of central India.
Bhat is also considered as treasure house of medicinal properties. Black soybeans and its soy products are the richest sources of isoflavones in the human diet. The consumption of soy, and therefore these isoflavones, generally has been considered beneficial, with a potentially protective effect against a number of chronic diseases (Munro et al., 2003). Black soybeans also reduce cholesterol level, inhibit growth of cancerous cells and interesting one that people consuming black soybean in Japan was less effected by pollution and adverse effects of radiation. Bhat, in Uttarakhand it is grown in 5734 ha area and
*Corresponding author. E-mail:
[email protected].
120
Afr. J. Agric. Res.
productivity of 5636 t and 9.82 q/ha respectively (Anonymous, 2011). It is now occupying first place among all the oilseed crops in India followed by rapeseed-mustard and groundnut at second and third place, respectively. Traditionally cultivated black soybean (Bhat) is much low yielding than normal soybean varieties which can be improved by involving diverse germplasm of exotic as well as indigenous black and normal soybean in breeding programme. Therefore, this study was undertaken to identify suitable black soybean parents having diverse characters through genetic divergence analysis.
Hence the absorbance of light by the dye-protein complex at 595 nm is proportional to the amount of protein bound (over a limited range); that is, there is a linear relationship between absorbance and the total protein concentration of the sample over a narrow range. The spectrophotometer used for analysis was double beam UV-VIS spectrophotometer: 2202. Similarly, the oil was extracted by grounded seed sample through Soxhlet extraction apparatus and quantified using the formula:
Weight of fat soluble material Percent crude fat =
× 100 Weight of sample
RESULTS MATERIALS AND METHODS A set of 48 bhat genotypes with two check varieties was taken for evaluation in completely randomized block design in three replication during Kharif 2012 at, N. E. Borlaug Crop Research Centre, G. B. Pant University of Agriculture and Technology, Pantnagar, Uttarakhand. The experimental unit assigned for each genotype was 2 rows of 3 m length with spacing of 45 × 10 cm. The observations recorded on five competitive plants randomly selected for each replication separately, from two rows of each plot for plant height, number of primary branches per plant, number of pods per plant, number of seeds per pod, dry matter weight per plant and seed yield per plant, on the whole plot bases, 100-seed weight, protein content and oil content, the observation were also recorded for derived character like harvest index. Average data of these five plants were utilized for the statistical analysis for each replication. This all data were analysed for ANOVA, Divergence studies, group constellation, correlation coefficient, and variability parameters like heritability, genotypic coefficient of variation (GCV), phenotypic coefficient of variation (PCV) was also estimated. The significance of difference between the means of genotypes for various characters. The steps involved in the analysis of the randomized complete block design were as described by Panse and Sukhmate (1969). The genetic divergence was computed using Mahalanobis’s (1936), D2 statistics among all possible combinations of 50 genotypes. Based on D2 values, the constellation of genotypes into clusters was done following Tocher’s method (Rao, 1952). The relative contribution of different characters towards the expression of genetic divergence was calculated following standard method as suggested by Singh and Chaudhary and Singh (1977). The correlations between all the characters under study at genotypic levels were estimated according to the method given by Searle (1961). The protein and oil was also estimated by Bradford method and Soxhelt assembly respectively. The seed samples were collected from fully matured 10 random plants for each genotype separately from all replication. Extraction of protein was done by grinding the seeds of each genotype separately which were dried to 4 to 5% moisture level in oven set at 108°C for 6 to 8 h. dried powdered seeds were taken for analysis. The grounded product was centrifuged with extraction buffer at 10000 g at 4°C for 20 min and the supernatant was collected. Quantification of protein was done following the method of Bradfort method. We used Bovine Serum Albumin (BSA) as standard. The method relies on principle of the binding of the dye Coomassie Blue G250 to the protein molecule. The cationic form of the dye, which predominates in the acidic assay reagent solution, has a λmax of 470 nm. The dye binds to protein as the anionic form, which has a λmax of 595 nm. Thus the amount of dye bound to the protein can be quantified by measuring the absorbance of the solution at 595 nm. The dye appears to bind most readily to arginine residues (but not to the free amino acid) of the protein.
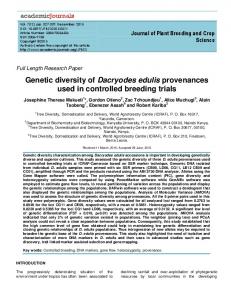
The analysis of variance revealed highly significant differences among the 50 genotypes for the thirteen characters studied (Table 1). All the fifty genotypes were grouped into twelve clusters. The clustering pattern of these genotypes is given in Table 2. The Cluster I comprised of five genotypes with three elite lines and two check varieties PS-1042 and VLS-65, while the Cluster II comprised thirteen genotypes. These elite lines exhibited similar genetic composition and were genetically close to each other and thus included in the same cluster. Cluster III had four genotypes, Cluster IV consisted of nineteen genotypes and largest cluster, whereas Cluster V, VI, VIII, IX, X, XI and XII had one genotype each, while cluster VII had two genotypes. The pattern of group constellation proved that geographical diversity need not necessarily be related to the genetic diversity since in the Cluster II, III, VI, V, VI, VII, VIII, IX, X, XI, and XII all elite lines, whereas, Cluster I, included elite lines as well as two (black seeded VLS65 and other yellow seeded PS1092) check varieties which make the sense of sharing some common genetic pattern. The inter-cluster average D2-value was maximum between Cluster IX and XI both with one genotype (90.85), followed by average D2-value between Cluster IX and XII with one genotype each (84.10) and average D2value between Cluster VI and cluster XII with one genotype (71.04). Thus, hybridization between genotypes from these clusters should result in maximum hybrid vigour and highest number of useful segregants (Shwe et al., 1972). The minimum inter-cluster average D2-value was found between Cluster II and IV (5.09) followed by between Cluster III and IV (5.61). This indicated indicating a close similarity in genotype composition (Table 3 and Figure 1). The thirteen characters were considered to be most important for the genetic diversity. Lowest contribution was made by days to maturity (1.29%) and maximum contribution was through number of pods per plant (14.703%). This also shows that we have maximum variation for yield contributing trait, and minimum for traits like days to maturity and flowering which can be exploited for yield improvement with synchronous maturity. The relative contribution of different characters towards the
Barh et al.
121
Table 1. Clustering pattern of 50 genotypes.
Cluster number I
Genotypes included PS1092, VLS-65, MOB-17, BCK BHATT BOLD 2, RS SOYBEAN 116 MOB-8, MOB-13, PSM BHATT 33, MOB-25, MOB-37, PCB BHATT 327, RCP BHATT 332, SOYBEAN 377, MOB-20, MOB-30, MOB-31, MRB BHATT 16, BHATT
II III
Number of genotypes 5 13
MOB-11, SOYBEAN 242, TM SOYBEAN 385, KP BHATT 98 MOB-43, VLS 47 DIFFUSED HILUM, MOB-4, MOB-16, MOB-22, KP BHATT 184, SD BHATT 45, NSP BHATT 230, MOB-32, VS BHATT 134, MOB-3, MOB-9, MOB-24, MOB-45, PCPGR 7618, PSM SOYBEAN 37, DSM 76, NSP SOYBEAN 232, LD BHATT 350
IV V VI VII VIII IX X XI XII
4 19
MOB-26 MOB-2 MOB-29, BHATT CHOCOLATE MRN SOYBEAN 24 MOB-6 MOB-21 MOB-36 MOB-41
1 1 2 1 1 1 1 1
Table 2. Intercluster and intracluster distance between clusters.
Clusters
I
II
III
IV
V
VI
VII
VIII
IX
X
XI
XII
I II III IV V VI VII VIII IX X XI XII
5.089
13.213 9.120
10.582 9.345 4.076
9.180 5.094 5.612 10.004
26.061 19.793 22.648 15.896 0.000
39.000 38.638 35.438 31.505 25.070 0.000
18.008 8.964 13.535 9.163 17.114 37.638 3.258
25.623 13.950 14.569 9.162 18.447 29.816 15.721 0.000
45.468 37.650 39.112 40.335 39.715 79.299 44.903 49.252 0.000
24.940 17.816 13.527 14.356 36.954 31.651 13.162 18.896 60.512 0.000
34.515 19.651 38.887 27.363 59.136 68.293 40.729 48.608 90.859 47.927 0.000
36.869 15.618 30.802 22.801 52.229 71.048 34.951 34.700 84.107 39.000 11.682 0.000
expression of genetic divergence was calculated and is given in Table 3. The character correlation also suggests that number of pods per plant, number of seed per pod, 100 – seed weight, number of primary branches and seed per plant are significantly correlated with yield which opens an area for selection of these traits to improve yield of bhat which is not at par to improved yellow soybean varieties (Table 4). This also indicate that there might be overlapping possible QTL for these traits in context of yield which can be studied further by mapping of QTLs for trait transfer. The variability studies suggests that trait like number of pods per plant consists of fair heritability and genetic advance which can be worked out for mass selection in future but yield governing traits like number of primary branches and number of seed per pod
are having very low (Table 5). In this table variation for standard error mean is maximum for dry yield per plant which indicates that high variation in sample mean and population mean. These results suggests that the Bhat genotypes taken under investigation having a most diverse range of pods followed by variable dry matter per plant, seed yield per plant, harvest plant height, 100seed weight which contribute most towards diversity and ultimately increase the allele diversity for favourable once. DISCUSSION In the light of
the
results
presented
here,
the
122
Afr. J. Agric. Res.
Table 3. Contribution of character towards divergence.
S/N 1 2 3 4 5 6 7 8 9 10 11 12 13
Character Days to 50% flowering Days to maturity Plant height (cm) Number of pods per plant Number of primary branches per plant Number of seeds per pod 100-Seed weight (g) Oil content (%) Protein content (%) Dry matter weight per plant (g) Seed yield per plant Harvest index (%) Yield per plot (kg)
Figure 1. Cluster diagram for different 12 clusters.
Contribution (%) 1.998 1.29 10.617 14.703 5.129 2.267 10.463 6.226 3.104 12.619 11.477 11.321 8.598
Barh et al.
123
Table 4. Inter character correlation coefficients between different character at genotypic level in Black Soybean (Bhat).
Character Days to 50% flowering Days to maturity Plant height (cm) No. of pods per plant No. of primary branches / plant No. of seeds per pod 100-Seed weight (g) Oil content (%) Protein content (%) Dry matter weight /plant (g) Seed yield per plant Harvest index (%) Yield per plot (Q)
Days to 50% flowering
Days to maturity
Plant height (cm)
No. of pods per plant
1.00
0.837** 1.00
0.766** 0.823** 1.00
0.057 0.208 0.171 1.00
potential parents were MRN SOYBEAN -24, BCK BHATT BOLD-2, MOB-17, MOB-29, BHATT CHOCHOLATE, MOB-36, MOB-43 and potential 2 parental combinations based on D statistic were MOB-36× MOB-6, MOB-41×MOB-6, MOB26×MOB-41, BCK BHATT BOLD-2 × BHATT CHOCOLATE, MOB-29×RS SOYBEAN, MOB17×MOB-6 These combinations would result in maximum hybrid vigour and highest number of useful segregants during the process of selection in the germplasm of soybean. It is suggested that seed yield per plant, number of primary branches, number of pods per plant, oil content and harvest index per plant should have prime consideration for yield improvement. Branching ability should be considered as an important trait when selecting varieties of high yield potential for tropical and sub-tropical environments. Poor plant stand is commonly observed in Bhat fields of sub-tropical areas and
No. of primary branches per plant -0.001 0.218 0.194 0.591** 1.00
No. of seeds per pod -0.092 -0.180 -0.023 0.252 0.473** 1.00
100-Seed weight (g) -0.240 -0.158 -0.172 0.116 0.494** 0.174 1.00
Oil content (%) -0.191 -0.066 0.047 -0.019 0.316* 0.240 0.280* 1.00
temperate areas, and, therefore, it may be desirable to breed soybean varieties for more branching ability. High branching varieties may have the ability to compensate for poor plant stand by producing more branches per plant under low plant competition. Current study suggest that the Bhat plants with intermediate height (75 to 105 cm), with 8-10 branches per plant (which is seen low in present investigation in germplasm of Bhat 4-6) having less vegetative biomass than usual, determinate growth and seed size in the range of 12 to 15 g per 100-seeds seem to be the ideal types for subtropical regions. The results also shows that 8 genotypes MOB26, MOB-2, MOB-29, MRN SOYBEAN-24, BHATT CHOCOLATE, MOB-6, MOB-21, MOB36, and MOB-41 present in Cluster 5, 6, 7, 8, 9, 10 and 11 are divergent and have show diverse character for pods and 100 seed weight. The
Protein content (%) 0.077 -0.023 -0.068 -0.184 -0.520** -0.192 -0.190 -0.111 1.00
Dry matter weight per plant (g) -0.036 0.137 -0.038 0.211 0.531** 0.191 0.389** -0.031 -0.018 1.00
Seed yield per plant -0.186 -0.012 -0.065 0.618** 0.665** 0.434** 0.514** 0.263 -0.218 0.266 1.00
Harvest index (%) -0.044 -0.073 0.040 0.207 0.053 0.138 0.118 0.279* -0.158 -0.682** 0.477** 1.00
Yield per plot (Q) -0.002 0.083 0.121 0.364** 0.650** 0.588** 0.392** 0.470** -0.315* 0.051 0.806** 0.573** 1.00
divergence pattern shows that some of these genotypes are of real importance for hybridisation and for more heterotic F1s and for obtaining trangressive segregants. Also in Cluster 1, 2, 3, and 4 genotypes included in the same cluster had different geographical region. This proved that geographical diversity need not necessarily be related to the genetic diversity. The reasons for this is genetic homeostatsis because it more favourable to associated characters so show indiscriminate free clustering this was supported with the results obtained earlier in the soybean by Shwe et al. (1972); Chauhan (1976); Ram et al. (1992); Kumar and Nadarajan (1994); Sihag et al. (2004) and Kayande and Patil (2009). If quality wise we see our data the protein found in black seeded (Bhat) soybean is more and oil is less than normal yellow soybean. The general mean of oil is 13% and protein found to be 35%. This was the reasons which give the answer for
124
Afr. J. Agric. Res.
Table 5. General mean (GM), standard error mean (SE m) and variability parameters in Bhat.
Character Days to 50 per cent flowering Days to maturity Plant height (cm) Number of pods per plant Number of primary branches/plant Number of seeds per pod 100-Seed weight (g) Oil content (%) Protein content (%) Dry matter weight per plant (g) Seed yield per plant Harvest index (%) Yield per plot (Q/ha)
GM
SEm±
PCV
GCV
ECV
h2
GA
54.72 111.90 98.11 138.07 5.57 2.08 10.46 13.86 33.75 56.37 16.73 32.35 14.98
0.593 1.99 1.689 9.19 0.447 0.081 0.226 0.334 0.858 3.733 1.214 2.649 1.09
7.82 5.73 34.38 31.79 18.10 8.79 23.56 18.73 15.00 30.44 25.24 40.40 35.5
7.59 4.82 34.25 29.62 11.59 5.58 23.26 18.26 14.34 28.19 21.88 37.83 33.21
1.87 3.09 2.983 11.53 13.90 6.79 3.747 4.18 4.403 11.47 12.57 14.18 12.67
94.2 70.8 99.2 86.8 40.9 40.3 97.4 95.0 91.3 85.8 75.1 87.6 87.2
8.31 9.36 68.96 78.53 0.852 0.152 4.95 5.084 9.53 30.33 6.544 23.61 9.58
PCV=Phenotypic Coefficient of Variation, GCV= Genotypic Coefficient of Variation, ECV= Environmental Coefficient of Variation, Heritability and G A= Genetic advance.
consumption of black soybean as pulse in Uttarakhand and hilly areas. It found to be alternative of pulses in the hilly areas. These genotypes definitely having different yield and yield component with quality too, compared to normal soybean. REFERENCES Chaudhary DN, Singh B (1977). Correlation and path coefficient analysis of yield components of soybean. Ind. J. Agric. Sci. 44:487. Chauhan VS (1976). Studies on heterosis, combining ability and genetic variability in relation to genetic divergence in soybean. Thesis, Ph.D. G. B. Pant University of Agriculture and Technology, Pantnagar. P. 176. Munro IC, Harwood M, Hlywka JJ Stephen AM (2003). Soy isoflavones: a safety review. Nutr. Rev. 61:1-33. Ram H, Singh K, Pushpendra (1992). Genetic divergence in the elite germplasm of soybean. Narendra Deva J. Agric. Res. 7(1):156-163. Rao CR (1952). Advance statistical methods in biometrical research. Edition. II. New York. John Willey and Sons. P. 390.
2
h=
Searle SR (1961). Phenotypic, genotypic and environmental correlation. Biometrics 17:475-480. Shah NC (2006). Black soybean: An ignored nutritious and medicinal food crop from the kumaon region of India. Asian Agri-History 10:3342. Shwe UH, Murty BR, Singh HB, Rao VMB (1972). Genetic divergence in recent advance strains of soybean and groundnut in India. Ind. J. Gene. Plant Breed. 32:285-299. Sihag R, Hooda JS, Vashistha RD, Malik BPS (2004). Genetic divergence in soybean {Glycine max (L.)Merill.}. Ann. Biol. 20(1):1721. Kumar M, Nandarajan N (1994). Genetic divergence studies in soybean {Glycine max (L.) Merill.}. Ind. J. Gene. Plant Breed. 54(3):242-24. Kayande NV, Patil SP (2009). Genetic divergence in soybean [Glycine max (L.) Merril]. Int. J. Plant Sci. Muzaffarnagar. 4(1):218-222.