sulfate was from Nutritional Biochemicals Corp (Cleve- land, OH); chondroitin ABC lyase (Proteus vulgaris) and chondroitin AC lyase (Arthrobacter aurescens) ...
American Journal of Pathology, Vol 140, No.
1,
January 1992
Copright American Association of Pathologists
Cell Surface Heparan Sulfate Proteoglycan and Chondroitin Sulfate Proteoglycan of Arterial Smooth Muscle Cells
Iris J. Edwards and William D. Wagner From the Department of Comparative Medicine, Bowman Gray School of Medicine of Wake Forest University, Winston-Salem, North Carolina
Cell surface proteoglycans of aortic smooth muscle cells of atherosclerosis-susceptible White Carneau (WC) and atherosclerosis-resistant Show Racer (SR) pigeons were compared to determine differences that may be involved in the greater proliferative properties of cultured WC cells. Using [35S] -sodium sulfate and [3H]-glucosamine as labeling precursors, chondroitin sulfate-proteoglycan (CS-PG) and heparan sulfate-proteoglycan (HS-PG) were identified as distinct molecules associated with the plasma membrane. Heparan sulfate-proteoglycan was reduced up to 50% in WC compared with SR cells, ana based on interaction with ion-exchange resin, had a lower charge density. These differences were not observed for the CS-PG from the two cell types. The mode of association of the cell surface PG with the plasma membrane was examined. Dissociation with I molIl (molar) sodium chloride indicated that 94% of applied 35S-sulfate. In some experiments, eg, the purification of PG from isolated plasma membranes, minicolumns of 1 ml DEAE-Sephacel were used. After column loading in 7 mol/l urea, 0.1% Triton X-100 0.05 mol/l TRIS, pH 7.2, DEAE-bound material was washed with 5 bed volumes of loading buffer and eluted with a sequential stepwise gradient of 3 ml 0.15 mol/l NaCI, 3 ml 0.25 mol/l NaCI, and 10 ml 1 -mol/l NaCI in urea buffer. Onemilliliter fractions were collected and analyzed for radioactivity.
Octyl Sepharose Hydrophobic Chromatography Using the procedure of Gallagher et al,24 minicolumns of 1 ml octyl sepharose (CL-4B) were washed and equilibrated with 50 mmol/l sodium phosphate, pH 5.0, containing bovine serum albumin (100 ,ug/ml). Samples in 50 mmol/l sodium phosphate, pH 5.0, 1% Triton X-100, were applied to the column, allowing Triton micelles containing intercalated hydrophobic proteoglycans to bind to the resin.25 The column then was eluted with sequential 5-ml aliquots of 1) 50 mmol/l sodium phosphate, pH 5.0, 2) same buffer containing 0.5 mol/l lithium chloride, 3) same buffer containing 1 mg/ml heparin and then followed by 4) 10 ml 1% (wt/vol) sodium dodecyl sulfate (SDS) in 0.5 mol/l lithium chloride, 50 mmolA sodium phosphate, pH 5.0. One-milliliter fractions were collected and analyzed for radioactivity. Total column recovery was 92% to 95% of applied dpm of 35S sulfate. Size Exclusion Chromatography Aliquots of PG were diluted in 0.25 mol/l TRIS phosphate, pH 7.6, and chromatographed on either a high-
196
Edwards and Wagner
AJPJanuary 1992, Vol. 140, No. 1
pressure liquid chromatography Altex Spherogel TSK 5000 PW or TSK 4000 SW column (300 x 7.5 mm) eluted with 0.25 mol/l TRIS phosphate, pH 7.6, at a flow rate of 0.5 ml/minute. Radioactivity was measured by either a Radiomatic flow through detector or in 0.25 ml collected fractions by scintillation counting.
GAG Identification by Electrophoresis on Cellulose Acetate GAG chains were prepared by papain treatment of purified PG as previously described17 and identified by electrophoresis on cellulose acetate,26 using a barium acetate buffer, pH 8.6, at 3 mA/strip for 2 hours at 40C. Autoradiograms of radiolabeled GAG were prepared by exposing the strips to Kodak K-Omat AR x-ray film for 10 days. Authentic GAG standards (4 ,ug) added to each sample before electrophoresis were used as described17 to identify radiolabeled GAG.
GAG Identification by Enzymatic and Chemical Degradation Chondroitinase ABC and chondroitin AC-Il lyase sensitivity27 was used to identify CS GAG. Aliquots of purified PG were incubated with 0.05 units of chondroitin ABC lyase in 0.03 mol/l sodium acetate, 0.1 mol/l TRIS, pH 8.0, containing protease inhibitors27 or with chondroitin AC 11 lyase (A. aurescens) in the same buffer at pH 7.4 for 16 hours at 370C. To identify HS GAG, aliquots of purified PG were subjected to nitrous acid degradation by incubation with an equal volume of 20% Butyl nitrite: 1 mol/l HCI for 2 hours at 250C with constant shaking, followed by neutralization with 1 mol/l sodium hydroxide.28 Products were chromatographed on a TSK 5000 PW or TSK 4000 SW column, and movement of 35S radioactivity to the column Vt was taken to represent degradation of the GAG chains.
Radioactivity Measurements 35S and 3H radioactivity measurements were made in a Packard 1500 Tri-Carb scintillation counter with Ready Safe" (Beckman Instruments) as the scintillation cocktail.
Results At saturation densities, cultures of aortic smooth muscle cells from WC pigeons have from 3 to 10 times more cells than SR cultures, although WC cells are only slightly smaller.17 Table 1 illustrates the saturation densities ob-
Table 1. Cell Densities at Confluence* of WC and SR
Smooth Muscle Cells from DifferentAortic Explants Cells/cm2 Experiment Cell number WC SR passage 1 3 1.0 x 10⁵+ 0.1t 1.0 x10⁴ 0.1 2 3 4.3 x 10⁴ 0.2 1.1 x 10⁴ 0.1 3 5 7.2 x 10⁴t 2.8 x 10⁴ Cells were determined to be confluent when no further increase in cell number was observed over a 48-hour period. t Counts are the mean of triplicate cultures ± SEM. t Counts are the mean of duplicate cultures.
served in three separate experiments using cells from different aortic explants.
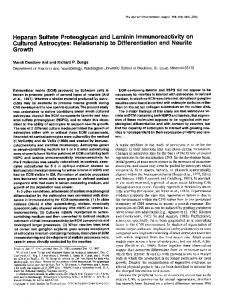
Isolation and Identification of Cell Surface/Pericellular PG The cell surface/pericellular PG from WC and SR artery smooth muscle cells were examined to determine if differences in the amount of HS-PG might be associated with the proliferative distinctions. After removal of the culture medium, PGs, radiolabeled with either [3H] glucosamine or 35S-sulfate, were isolated from the cell surface and pericellular environment of confluent WC and SR smooth muscle cells by treatment with 0.05% trypsin for 5 minutes. GAG were identified by cellulose acetate electrophoresis and autoradiography. Figure 1 illustrates that CS and HS were the only radiolabeled sulfated GAG detected in both SR and WC cell surface/pericellular PG. Because the PGs in this experiment were obtained by trypsin treatment of the cell sheet, the HS-PG and the CS-PG may be components of the cell membrane or the pericellular region.
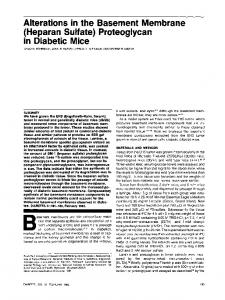
Demonstration of Charge Difference in HS-PG of WC and SR Smooth Muscle Cells The intact cell surface/pericellular PG, radiolabeled with [3H] glucosamine, were isolated by trypsin treatment as previously described and chromatographed on a DEAE ion exchange column. A linear gradient of 0 to 1 mol/l sodium chloride separated three distinct peaks of radioactivity (Figure 2). The first peak eluting at 0.23 mol/l NaCI was identified as hyaluronic acid (HA) (data not shown), and that at 0.5 mol/l as CS-PG. No difference in elution characteristics due to cell origin was observed for either HA or CS-PG. Different DEAE affinities were observed for the HS-PG from the two cell types. In purifications of three different samples, 0.41, 0.41, and 0.40 mol/l NaCI was required to remove the HS-PG in SR samples, compared with 0.38, 0.38, and 0.38 mol/l NaCI in WC. Although the
Cell Surface
Proteoglycans
197
AJPJanuary 1992, Vol. 140, No.
Figure 1. Cellulose acetate electrophoresis and autoradiography of sulfated GAG from pericellular PG. Cell surface proteoglycans radiolabeled 36 hours with 30 p.Ci 355sulfate/ml were released from the cells by trypsin treatment, precipitated with CPC, and treated with 0.025 mg ofpapain to release the GAG. GAG were electrophoresed on cellulose acetate in 0.3 M barium acetate buffer, pH 8.6, at 3 mA/stripfor 2 hours. Mixed standard GAG (4 pg) applied with each sample were stained, and the strips were scanned before
1
%..wi nd
t r
AM
.
os-NB
Origin
autoradiography.
ionic strength differences are small, they are reproducible and suggest structural variations in the HS-PG from the two cell types. The radiolabeled material from DEAE was identified by susceptibility or resistance to chondroitin AC 11 lyase, chondroitinase ABC, and nitrous acid. After treatment, products were separated on a TSK 4000 column, and movement of radiolabel from the column void to Vt indicated hydrolysis of the GAG chains. Radioactive material eluting at 0.5 mol/l NaCI (Figure 2) was totally susceptible to chondroitin AC 11 lyase and resistant to nitrous acid, identifying it as CS-PG (Figure 3). Chondroitinase ABC treatment resulted in the release of disaccharides that contained 34% ADi-6S, 66% ADi-4S in SR, and 65% ADi6S, 35% ADi-4S in WC. This isomer predominance of ADi-4S (with sulfate at position 4 on the hexosamine moiety) in SR and ADi-6S (with sulfate at position 6 on the hexosamine moiety) in WC is consistent with that of secreted CS-PG of these cells.17 Figure 4 illustrates the identification of the radioactive material eluting at 0.38 to 0.41 mol/A NaCI. Intact PG (Figure 4A, B) were treated
with papain to release the GAG chains. Movement of [3H] glucosamine into the column represents the free GAG chains (Figure 4C, D). The GAG chains were resistant to chondroitinase ABC (Figure 4E, F) but sensitive to nitrous acid treatment (Figure 4G, H). These results identify the radioactive peak eluting at 0.38 to 0.41 mol/l NaCI as HS-PG.
Demonstration of Reduced Amounts of HS-PG in WC Smooth Muscle Cells When cells were pulsed with radiolabeled precursers to the GAG chain (35S-sulfate) and core proteins (3Hserine), a reduction in the cell surface/pericellular PG in WC compared with SR cells was apparent (Table 2). Trypsin treatment removed 63% (3S-sulfate) and 61% (3H-serine) less radiolabeled PG from the cell surface/ pericellular environment of the WC compared with SR cells. The trypsin-released cells were treated for 18 hours at 4°C with 4 mol/l GdnHCI, 1% Triton X-1 00 in 0.05 mol/l
198
Edwards and Wagner
AJP January 1992, Vol. 140, No. 1
.
0
.8
C.) .6
ci
K.
E -a) Cu)
z
la)
0
o .4
0~ CY)
E .2
20
40
20
60
40
.0 60
fraction Figure 2. DEAE-Sephacel chromatography of 13H]glucosamine labeledpericellular PG. Cell surfaceproteoglycans radiolabeled with 30 pCi [3H]glucosamine/mlfor 36hours were dialyzed against 7 M urea in 0.05 M Tris, pH 7.2, and chromatographed on a DEAE-Sephacel column equilibrated with the same buffer. A 200-ml linear gradient of 0 to 1 M sodium chloride in urealTris buffer was used to elute the PG. Fractions (3 ml) were collected and analyzedfor radioactivity and conductivity. Peaks were identified by susceptibilities to specific GAG degrading enzymes. A SR PG; B, WC PG.
sodium acetate. The 3H-serine-labeled PG that remained cell associated after trypsin treatment (presumably an intracellular pool) was similar between WC and SR cells, indicating that the difference between cells involves specifically surface molecules. When two different radiolabeled GAG precursers (35S-sulfate and 3H glucosamine) were used, radioactivity associated with the cell surface/pericellular fraction was likewise reduced in WC compared with SR cells. Calculation of the radiolabel associated with DEAEseparated CS-PG and HS-PG per cell indicated a 42% (35S) and 43% (3H glucosamine) reduction in CS-PG and a 66% (35S) and 67% (3H glucosamine) reduction in HSPG. Because WC cells are slightly smaller than SR cells,17 these differences may be due in part to reduced membrane area. Calculation of the radiolabel associated with CS-PG and HS-PG per jig cell protein indicated a 48% (35S) and 50% (3H glucosamine) reduction in HSPG, whereas the CS-PG was only 11% to 12% lower (Table 3). These results demonstrate that HS-PG in par-
ticular cells.
was
greatly reduced in WC compared with SR
Membrane Association and Properties of Cell Surface PG The mode of association of PG with the cell surface was examined in confluent cultures of smooth muscle cells, after a 36-hour radiolabeling period with 35S-sulfate. After removal of the labeling media, cells were rinsed with cold PBS, and the PG from triplicate cultures were extracted by one of the following protocols: 1) 0.05% trypsin for 5 minutes at 37°C. The trypsin fluids were separated by centrifugation and the cell pellet was extracted for 18 hours at 40C with 4 mol/l GdnHCI in 0.05 mol/l sodium acetate, pH 5.8, containing 1% Triton X-100; 2) 1 mol/l NaCI for 30 minutes at 40C. After removal of the NaCIreleased PG, the cells were extracted for 18 hours at 40C with 1% Triton; 3) 4 mol/l GdnHCI in 0.05 moVI sodium
Cell Surface Proteoglycans
199
AJP January 1992, Vol. 140, No. 1
C,,)
0
x 0
c)
E
CZ I
Q
VO
Vt
fraction
Figure 3. TSK 4000 HPLC chromatography of the 0.5 MDEAE Sephacelpeak, Figure 2 after digestion with chondroitin ACII lyase or nitrous acid treatment. Fractions comprising the peak werepooled and aliquots were treated with 0.05 u chondroitin AC II lyasefor 16hours at 37°C or with nitrous acidfor 2 hours at 28C. Products were separated on a TSK 4000 SW column eluted with 0.25 M Tris phosphate, pH 7.6, at 0.5 ml/minute. ___untreated, --- chondroitin AC H Ivase treated, nitrous acid-treated. A, SR; B, WC.
acetate, pH 5.8, containing 1% Triton X-1 00 for 18 hours at 40C. Only 8% and 9% of the 35S-Iabeled cellassociated/pericellular PG of WC and SR cells, respectively, was removed by 1 mol/I NaCI, indicating that only a small proportion of the PG are involved in an ionic interaction with plasma membrane components (Table 4). The remaining 35S-labeled PG (>90%) required detergent extraction, suggesting a possible intercalation into
the plasma membrane. The hydrophobic properties of the PG core proteins were examined based on an affinity for octyl sepharose. The PG in 1% Triton X-1 00 50 mmol/l sodium phosphate, pH 5.0, was applied to a 1 -ml column of octyl sepharose, and eluted under conditions in which SDS is required to separate hydrophobic molecules. These conditions have been used to identify plasma membrane intercalated proteins.25 Approximately 85% of the detergentextracted PG from WC and SR cells required SDS for elution from the octyl Sepharose column (Figure 5). By contrast, the trypsin-released PG, which were cleaved from any possible membrane spanning hydrophobic anchor, required only LiCI for elution. Similar profiles were obtained for the PG from both cell types. The identity of octyl sepharose-bound cell surface PG was determined after treatment with chondroitinase ABC and nitrous acid. Figure 6 shows the intact, chondroitinase ABC and nitrous acid-treated octyl sepharosebound PG separated on a TSK PW 5000 column eluted with 0.25 mol/l TRIS phosphate, pH 7.6. Based on move-
ment of radiolabel to the column Vt after chondroitinase ABC treatment, the data indicate that octyl sepharosebound PG from SR cells consisted of 67% HS-PG and 33% CS-PG. In WC cells, the PG was composed of 48% HS-PG and 52% CS-PG. These data demonstrate the existence of a cell-associated CS-PG with a hydrophobic core consistent with a plasma membrane-associated
protein.
Identification of Proteoglycans in Isolated Cell Membranes For these studies, confluent cultures were radiolabeled for 24 hours with 50 ,uCi/ml of 35S-sulfate, and the ionically bound PG were removed from the cell layers by incubation with 1 mol/l NaCI in PBS for 30 minutes at 40C. The cells were scraped into 0.25 mol/l sucrose and homogenized, and a plasma membrane fraction was prepared on a Percoll gradient. Membranes were solubilized in 4 mol/l GdnHCI, 0.05 mol/l sodium acetate, pH 5.8, containing 1% Triton X-1 00 and protease inhibitors. To determine the identity of the 35S-labeled PG isolated from the membrane fractions, aliquots were treated with chondroitinase ABC or nitrous acid and chromatographed on a TSK SW 4000 column. Susceptibility to chondroitinase ABC and nitrous acid treatment indicated that both HS-PG and CS-PG were present in the isolated membrane fractions (Figure 7). Sequential chondroiti-
200
Edwards and Wagner
AJP January 1992, Vol. 140, No. 1
0 x CU
0 C)
E
01)
o
cm I0~
E Figure 4. Size exclusion chromatography demonstrating identification of the HS-PG peak shouw in Figure 2. Fractions comprising the second peakfrom DEAE were pooled and aliquots, treated as described below, were separated on a TSK 4000 SW column eluted with Tris phosphate, pH 7.6, at 0.5 ml/minute. AB, intact PG; C,D, GAG chains liberated by treatment with 0.025 mg ofpapain for 2 hours at 60 C; EF, GAG chains treated with 0.05 u chondroitinase ABC for 16 hours at 37 C; G,H, GAG chains treated with nitrous acidfor 2 hours at 25 C A,C,E,G, SR; B,D,F,H, WC. Vo = 9 minutes, V, = 24 minutes.
Minutes nase ABC and
nitrous acid treatment resulted in all of the
5S-sulfate eluting at the column Vt (not shown). As was the total cell-associated PG (Figure 6), a lower percentage of the total membrane PG in WC was HS-PG: 34% in WC versus 44% in SR (Figure 7). seen with
Discussion Smooth muscle cell proliferation is critical to atherosclerosis progression, and the ability to control this proliferaTable 2. Total PG in Cell-associated Fractions Radiolabeled with Precursors for Both GAG Chain and Core Protein
Treatment
(35S Sulfate) SR
Trypsin
5.2* + 0.16
Gdn and triton extracted cells
WC
(3H Serine)
WC
SR
1.9
2.3
0.9
+ 0.21
+ 0.48
+ 0.24
0.4
0.2
4.3
+ 0.04
+ 0.01
+ 0.25
±
4.4 0.57
Counts are dpm x 10-' X SEM of triplicate cultures. In this experiment both core protein and GAG of PG were radiolabeled to estimate production of intact molecules. The PG in the cell extract and in the trypsin fluids were purified on a DEAESephacel ion exchange column loaded at 0.15 M NaCI and eluted at 1 M NaCi. *
tion may be of key importance in determining an individual's susceptibility to advanced lesion formation. In examining the cultured aortic smooth muscle cells of atherosclerosis-susceptible and atherosclerosis-resistant pigeons, we have determined a greater proliferative potential in the cells from WC, the atherosclerosissusceptible breed. The increased proliferation was associated with alterations in cell surface HS-PG, which were quantitatively reduced and structurally distinct in WC compared with SR cells. Significant quantitative differences were not observed in the cell surface CS-PG from the two cell types, suggesting that there is not a generalized metabolic difference in PG of the two cells types. Studies mainly in hepatocytes have described three modes of association of HS-PG with the plasma membrane: the binding of HS to specific membrane receptors; the intercalation of HS-PG core protein into the plasma membrane through a hydrophobic peptide segment; and covalent linkage of HS-PG to an inositol containing phospholipid of the plasma membrane.29 The modes of association of HS-PG with the plasma membrane of artery smooth muscle cells have not previously been well characterized. In the pigeon aortic smooth muscle cells described in this report, only 9% of the 35Ssulfate-labeled pericellular PG appeared to be ionically
Cell Surface Proteoglycans
201
AJP January 1992, Vol. 140, No. 1
Table 3. Comparison of Pericellular* Proteoglycans in WC- and SR-cultured Artery Smooth Muscle Cells HS-PG CS-PG
Cell
source
SR WC WC vs. SR % change
dpm 35S/p.g cell protein
dpm[3H]Glucosamine/ jig cell protein 8112 4068
115 60
48% 1
Ratio 35S/3H
dpm 35S/Lg cell protein 342 306
1.42 1.47
50% l
dpm[3H]Glucosamine/ ,ug cell protein 1 7,496 15,384
Ratio 35S/3H 1.95 1.99
12% l
11%
Pericellular PG were prepared by trypsin treatment of the cells and were separated as described in Figure 2. In this experiment GAG chains were radiolabeled and both 3H glucosamine and 35S to estimate the production of GAG chains and degree of sulfation. *
associated with the cell surface and removable with 1 mol/l NaCI. Similar results have been obtained with heparin displacement (data not shown). By contrast, ionically associated PG constituted -45% of the pericellular PG of hepatocytes.30
When the detergent-extracted cell layer PG were chromatographed on the hydrophobic resin octyl sepharose under conditions previously used to identify membrane-intercalated proteins,25 85% required SDS for elution. This was similar in both SR and WC cells. The decreased HS-PG observed in the trypsin-releasable PG from WC cells (Table 3) was also evident by the reduced HS-PG/CS-PG ratio in the octyl sepharose-bound PG (Fig. 6) and in the PG extracted from WC cell membranes (Figure 7). These data demonstrate that the species of HS-PG reduced in WC compared with SR cells is a membrane-intercalated PG. Cell surface HS-PG have been isolated and characterized from a variety of tissues and cultured cells and demonstrate considerable heterogeneity in molecular size and structure. In addition, some cell types appear to express only one HS-PG type, whereas others express several distinct HS-PG molecules. Rat hepatocytes synthesize a single HS-PG species of -75 kd composed of a core protein of 17 to 30 kd and three or four GAG chains of 14 kd each.31 The production of three HS-PG species has been described for bovine aortic endothelial cells; a 600- to 800-kd monomer with a 100- to 300-kd core protein and GAG chains of 38 kd; a 150- to 200-kd monomer with a 50-kd core protein and 22-kd GAG
chains, and a smaller monomer with a core protein of