B IO D IV E RS IT A S Volume 19, Number 3, May 2018 Pages: 899-905
ISSN: 1412-033X E-ISSN: 2085-4722 DOI: 10.13057/biodiv/d190319
Characterization of abundance and diversity of lactic acid bacteria from Apis dorsata hives and flowers in East Nusa Tenggara, Indonesia 1
AMOR TRESNA KARYAWATI1,, LILIS NURAIDA2, YULIN LESTARI3, ANJA MERYANDINI3, Microbiology Program, Department of Biology, Faculty of Mathematics and Natural Sciences, Institut Pertanian Bogor. Dramaga, Bogor 16680, West Java, Indonesia. Tel.: +62-251-8622833, email:
[email protected] 2 Department of Food Science and Technology, Faculty of Agricultural Technology and SEAFAST Center, Institut Pertanian Bogor. Dramaga, Bogor 16680, West Java, Indonesia 3 Department of Biology, Faculty of Mathematics and Natural Sciences, Institut Pertanian Bogor. Dramaga, Bogor 16680, West Java, Indonesia. Tel.: +62-251-8622833, email:
[email protected] Manuscript received: 21 February 2018. Revision accepted: 23 April 2018.
Abstract. Karyawati AT, Nuraida L, Lestari Y, Meryandini A. 2018. Characterization of abundance and diversity of lactic acid bacteria from Apis dorsata hives and flowers in East Nusa Tenggara, Indonesia. Biodiversitas 19: 899-905. Previous research on lactic acid bacteria associated with honey bees has been conducted in temperate arid regions and wet tropical regions. We isolated lactic acid bacteria from giant honey bee (Apis dorsata) hives and flowers in East Nusa Tenggara, Indonesia, an area with a tropical savanna climate. Diversity of lactic acid bacteria was studied using Denaturing Gradient Gel Electrophoresis method. The purpose of this study was to obtain information about the diversity of lactic acid bacteria contained in Apis dorsata hives and flowers from tropical savanna climate. We identified seven Operational Taxonomy Units (OTU) within the hives and flowers. Two OTUs were closely related to LactoBacillus kunkeei strain YH-15 (T), while three others were closely related to Lactococcus lactis subsp. tructae strain L105 (T). This information is important to explore the potential utilization of lactic acid bacteria in maintaining human health. Keywords: Apis dorsata hives, denaturing gradient gel electrophoresis, East Nusa Tenggara, flowers, lactic acid bacteria
INTRODUCTION Lactic acid bacteria can be found in milk and dairy products, animal digestive tracts and plants. Generally, lactic acid bacteria are known as Gram-positive bacteria that produce lactic acid as the final product of carbohydrate fermentation. Lactic acid bacteria are widespread on the surface of various flowers and may be carried by honey bee in the hives (Daeschel et al. 1987). Flowers containing nectar and pollen are a food source for giant honey bee (Apis dorsata Fabricius, 1793). Nectar and pollen are collected by giant honey bee from flowers, which are then deposited in the hives. When the giant honey bee collects nectar and pollen from flowers, lactic acid bacteria on the surface of flowers are carried over and deposited in the hives (Olofsson & Vásquez 2008). Therefore, many kinds of lactic acid bacteria from flowers exist in the hives. Indonesia has been known as the most diverse honey bee species in the word. Five of nine species of honey bees are native to Indonesia, i.e., Apis andreniformis, A. dorsata, A. cerana, A. koschevnikovi, and A. nigrocincta (Hadisoesilo 2001). Apis dorsata is indigenous honey bee species that has the biggest body size of all honey bees in Indonesia. Apis dorsata (giant honey bee) is a wild honey bee building the hive on the tree in the jungle. Hives of Apis dorsata consist of a big honeycomb whose the width reaching until one-meter square (Hadisoesilo 2001). A Giant honey bee is an aggressive honey bee with the wide range area of feeding.
Some researchers had found lactic acid bacteria in the hives of honey bees and flowers. Lactic acid bacteria had been isolated from hives of Apis mellifera in Tucson (arid regions in Arizona, USA) and hives of Apis dorsata in Kedah, located in the tropical region of Malaysia (Anderson et al. 2013; Tajabadi et al. 2013). The lactic acid bacteria from flowers in Jonstorp (the cold temperate region in Sweden) were LactoBacillus kunkeei, LactoBacillus spp., and Bifidobacterium spp. while lactic acid bacteria from flowers in Tucson (arid regions in Arizona, USA) were LactoBacillus Firm5, L. kunkeei, Enterococcus sp., and Weissella sp. (Olofsson & Vásques 2008; Anderson et al. 2013). Based on these results lactic acid bacteria on flowers from different climates (cold and arid climates) had different diversity. Previous research on lactic acid bacteria associated with honey bees has been conducted in temperate arid regions and wet tropical regions. However, diversity of lactic acid bacteria in bee hives has not been previously studied in tropical savanna climates. Therefore, the objectives of our study were to: (i) quantify diversity of lactic acid bacteria from giant honey bee hives and flowers in East Nusa Tenggara, Indonesia, a region with a tropical savanna climate; and (ii) predict the benefits of lactic acid bacteria from bee hives for human health based on diversity of lactic acid bacteria.
900
B I O DI VE RS I T A S 19 (3): 899-905, May 2018
MATERIALS AND METHODS Study area Hives of Apis dorsata and flowers were collected from the sub-districts of Central Amfoang, South Amfoang and Central Fatuleu in Kupang District, East Nusa Tenggara Province, Indonesia. These three sub-districts represented areas of high honey production from hives of Apis dorsata. East Nusa Tenggara has a tropical savanna climate with a dry season is longer than the wet season. Grasslands represented the dominant vegetation. Procedures Sample collection The hives were collected randomly from three different trees in each location and were subsequently mixed. 25 g of hives were weight and used as samples. Similarly, flowers from 9-12 plants in each location were randomly collected and were subsequently mixed as well as weighted around 25 g for samples. There were a total of six samples from three different areas for three replications. Isolation of Lactic Acid Bacteria The sample (25 g) was suspended in 100 mL of 0.85% (w/v) NaCl (Merck, USA). a 100 μL aliquot of suspension was spread on Mann, Rogosa and Sharpe agar (Merck, USA) supplemented with 1% of CaCO3, which were then incubated for 24 hours at 37°C under anaerobic conditions using Anaerobic Jars with Anaerocult A gas packs (Merck, Darmstadt, Germany). All grown colonies were scraped and dissolved in 500 μL nuclease-free water and centrifuged at 12,000 g for 2 min. The supernatant was discarded and bacterial cells were collected for DNA extraction. DNA extraction Bacterial DNA was extracted with PrestoTM Mini gDNA Bacteria Kit (Geneaid, Taiwan). The DNA extraction procedure was carried out following the manual provided by the manufacturer. Extracted DNA was tested for purity by Nanodrop 2000 spectrophotometer (Thermo Scientific, Wilmington, DE, USA). Amplified 16S rRNA gene Bacterial DNA was amplified by PCR Applied Biosystem 2720 Thermal Cycler (Thermo Fisher Scientific, Massachusetts, USA). Amplification was performed with a universal primer for 16S rRNA gene that was hybridized with GC clamps (Ovreas 1997). DNA was amplified with primer 338 Forward (ACTCCTACGGGAGGCAGCAG), 518 Reverse (ATTACCGCGGCTGCTGG) and 338 Forward-GC (CGCCCGCCGCGCGCGGGGGGGGG GGGGGGGGGGGGACGGGGGCGGGGGAGGCAGCA. The PCR reaction contained 25 μL of final solution consisting of: 1.25 μL of 10 pmol of each primer, 12.5 μL Go Taq Green Mastermix 2x (Promega, Madison, USA), 2.5 μL DNA template and 7.5 μl nuclease free water
(NFW). Amplification by PCR comprised 35 cycles of predenaturation at 94°C for 5 minutes, denaturation at 92°C for 30 seconds, annealing at 58°C for 30 seconds, elongation at 72°C for 45 seconds, and post-elongation at 72°C for 3 minutes. The PCR products were migrated on 1% agarose gel and stained with ethidium bromide 0.1% for visualized in G: BOX Gel Documentation (Syngene, Frederick, USA). Denaturing Gradient Gel Electrophoresis The electrophoresis process was performed on D Universal Mutation Detection System (Bio-Rad, California, USA) at 60°C, 150 volts for 5 hours. A total of 20 μl of DNA and 5 μl of loading dye were migrated on 8 % polyacrylamide gel containing a denaturing gradient from 30-70% (Muyzer 1993; Muyzer & Smalla 1998). The polyacrylamide gel was stained with ethidium bromide 0.1% for 15 minutes, then visualized in G: BOX Gel Documentation (Syngene, Frederick, USA). DNA bands on polyacrylamide gel were cut and eluted with 100 μl nuclease free water, which were then amplified with PCR TI-Thermocycler (Biometra, Goettingen, DE) using the same primers (338F and 518R) but without GC clamps. Results of amplified DNA were sent to the provider of sequencing services for DNA sequencing. Data analysis The DGGE profile had been interpreted with Lab Image Plat Form software to determine volume of DNA bands or OTU (Operational Taxonomy Unit). This volume was used to calculate diversity index and evenness index of microbial community. The OTU value represents abundance of lactic acid bacteria in DNA bands. The Shannon-Wiener diversity index was calculated based on the OTU value using the formula: H' = - Σ pi ln pi, where Hʹ is Shannon-Wiener diversity index and pi is the relative abundance of OTU. Evenness index (E) was calculated by the following equation: E = Hʹ/ln S, where Hʹ is ShannonWiener diversity index and S is bacterial richness that expressed total number of OTU in sample (Hill et al. 2003; Pangastuti et al. 2010; Radita et al. 2017). Criteria of Shannon’s diversity (Hʹ): Hʹ < 1 the diversity is low, 1 < Hʹ < 3 the diversity is medium, Hʹ > 3 the diversity is high. Evenness index (E) value is between 0 to 1, E < 0.4 the evenness of population is low, 0.4 < E < 0.6 the evenness of population is medium, E > 0.6 the evenness of population is high. DNA sequences were analyzed by MEGA (Molecular Evolutionary Genetics Analysis) software version 7.0 for assembly and trimming process. The DNA sequences were compared to database of 16S rRNA gene of type strain in EzTaxon Bio Cloud (http: //eztaxon-e.ezbiocloud.net) software (Yoon et al. 2017; Park et al. 2012). The homologous sequences were aligned with MEGA 7.0 by the bootstrap method (Kumar et al. 2016). Phylogenetic tree was constructed by Neighbour-Joining method.
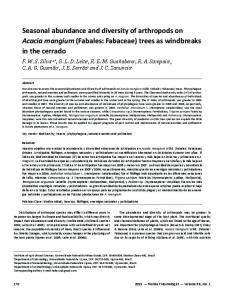
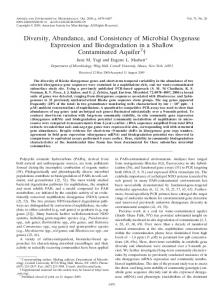
KARYAWATI et al. – Diversity of lactic acid bacteria from Apis dorsata RESULTS AND DISCUSSION Denaturing Gradient Gel Electrophoresis profile of lactic acid bacteria in flowers and Apis dorsata hives Number of DNA bands varies among locations and between flowers and hives. Sample E (honeybee hives from South Amfoang) had the largest number of DNA bands, while sample A (flowers of Central Amfoang) had the smallest number of DNA bands (Figure 1). The most dominant DNA bands were found in line 5 and line 6, and both lines had bands presented in all samples. The pattern of bands in line 1, line 3, and line 4 were found only in hives of the giant honey bee (samples D, E, F). Flowers collected from Central Amfoang (A) contained only 2 bands in line 5 and line 6. Flowers collected from South Amfoang (B) contained 3 bands, which were presented in line 5, line 6, and line 7, while flowers collected from Central Fatuleu (C) contained 4 bands, which could be observed in line 2, line 5, line 6, and line 7. Hives of the giant honey bee collected from Central Amfoang (D) contained all bands in all line numbers except for line 2 with six bands. Hives of Apis dorsata (E) from South Amfoang contained all bands with total of seven bands. Hives of Apis dorsata from Central Fatuleu (F) did not have bands in line 1 and line 7 with five bands. The flowers contained fewer DNA bands than the hives of the giant honey bee, showing that the type of lactic acid bacteria (LAB) found in the hives was more diverse than the type of lactic acid bacteria found in the flowers. The abundance and diversity of lactic acid bacteria We also found that diversity in LAB differed among locations and between flowers and hives. The hives of Apis dorsata from South Amfoang (E) had highest rank abundance of operational taxonomy unit (OTU) (Figure 2). Flowers from Central Amfoang (A) had lowest rank abundance of OTU. There were seven OTU in sample E, while sample A only contained two OTU. Flowers from Central Fatuleu (C) had more OTU than other flowers (A and B). Some OTUs were not uniformly distributed between flowers and hives. OTU1, OTU3, and OTU4 were found only in the hives of Apis dorsata. It is likely that three types of bacteria did not originate from flowers, but they were released from the honey bee stomachs to the hives. This interpretation is supported by the fact that OTU4 (LactoBacillus kunkeei YH-15) has previously been found in stomachs of honey bees (Olofsson and Vásquez 2008). Honey bee stomachs are filled with nectar and nutrients in a micro-aerobic state, potentially representing an optimal niche for LAB. Samples from flowers and hives contained OTU5 and OTU6. Results of this study indicate that types of lactic acid bacteria contained in flowers are also found in the hives. OTU2 found in flowers from Central Fatuleu were also found in the hives of Apis dorsata from Central Fatuleu. This suggests that lactic acid bacteria from flowers were transferred to the hives of Apis dorsata. This suggestion is supported by Anderson et al. (2013) which showed many bacteria from bee bread (in the hives) and
901
crops were also found in floral nectar, suggesting frequent horizontal transmission. Based on all flower environments, 38 of 215 (17.7%) samples of sequenced isolates had identical similarity with honey bee gut, crop, or hive samples (Anderson et al. 2013). Although we found the same dominant OTU (Operational Taxonomy Unit) in each sample (Table 1), the composition of OTU in each sample was different. OTU5 and OTU6 were the dominant OTU in all samples. Sample E (the hives of Apis dorsata from South Amfoang) had three-dominant OTU. Hives and flowers exhibited different levels of diversity in LAB. The hives of Apis dorsata collected from South Amfoang (E) had the highest diversity index (Hʹ), while flowers collected from Central Amfoang (A) had the lowest diversity index (Table 2). Evenness index of sample A was higher than other samples, and sample E had the lowest evenness index. The Hʹ values of samples C, D, E, and F were >1, which exhibit moderate levels of diversity. Sample A and B had Hʹ < 1, which indicated the low diversity of bacteria. Evenness index of six samples was > 0.6, indicating high evenness of all samples from population and suggesting that the number of OTU in each sample was the same or similar.
A B
C D E
F
Lines 1 2 3 4 5
6 7 A
B
C
D
E
F
Figure 1. Denaturing Gradient Gel Electrophoresis profile of flowers (A, B, C) and the hives of Apis dorsata (D, E, F) from Kupang District, East Nusa Tenggara, Indonesia. Description: A = Flowers from Central Amfoang; B = Flowers from South Amfoang; C = Flowers from Central Fatuleu; D = Hives of Apis dorsata from Central Amfoang; E = Hives of Apis dorsata from South Amfoang; F = Hives of Apis dorsata from Central Fatuleu
B I O DI VE RS I T A S 19 (3): 899-905, May 2018
902
A
B
C
D
E
F
Figure 2. Rank abundance of OTU (Operational Taxonomy Unit) from six samples from Kupang District, East Nusa Tenggara, Indonesia. A = Flowers from Central Amfoang; B = Flowers from South Amfoang; C = Flowers from Central Fatuleu; D = Hives of Apis dorsata from Central Amfoang; E = Hives of Apis dorsata from South Amfoang; F = Hives of Apis dorsata from Central Fatuleu
Table 1. The dominant OTU of LAB from flowers and the hives of Apis dorsata in Kupang, East Nusa Tenggara, Indonesia The same OTU in every sample A 2 5 (62.5%), 6 (37.5%) 5. 6 B 3 5 (51.2%), 6 (38.5%) 5. 6 C 4 5 (54.4%), 6 (25.7%) 5. 6 D 6 5 (39.3%), 6 (23.3%) 5. 6 E 7 2 (11.73%), 5 (43.2%), 6 (18.2%) 5. 6 F 5 5 (49.1%), 6 (19.9%) 5. 6 Notes: A = Flowers from Central Amfoang; B = Flowers from South Amfoang; C = Flowers from Central Fatuleu; D = Hives of Apis dorsata from Central Amfoang; E = Hives of Apis dorsata from South Amfoang; F = Hives of Apis dorsata from Central Fatuleu Sample
Σ OTU
Dominant OTU (%)
Table 2. Shannon-Wiener Diversity and Evenness index of LAB from flowers and the hives of Apis dorsata in Kupang, East Nusa Tenggara, Indonesia Sample
Shannon-Wiener diversity Evenness index index A 0.66 ± 0.01 0.97 ± 0.01 B 0.95 ± 0.02 0.86 ± 0.02 C 1.13 ± 0.03 0.77 ± 0.02 D 1.59 ± 0.03 0.81 ± 0.02 E 1.65 ± 0.03 0.74 ± 0.02 F 1.34 ± 0.03 0.77 ± 0.03 Notes: A = Flowers from Central Amfoang; B = Flowers from South Amfoang; C = Flowers from Central Fatuleu; D = Hives of Apis dorsata from Central Amfoang; E = Hives of Apis dorsata from South Amfoang; F = Hives of Apis dorsata from Central Fatuleu
The level of diversity was related to dominance of bacteria. The highest diversity of LAB in the hives of Apis dorsata that were collected from South Amfoang indicated that honey bees in South Amfoang had more sources of LAB than the honey bees in Central Amfoang and Central Fatuleu. Flowers from Central Amfoang exhibited lowest diversity of LAB but highest dominance. Flowers contained few LAB, so that bacteria can live on flower surfaces because there were exudates of flowers (nectar) and pollen as food sources for LAB (Daeschel 1987). There were only a few LAB on surfaces of flowers because of extreme conditions including direct sunlight, wind, heavy rain, and human disturbance. The sequence homology of bacteria based on 16S rRNA gene sequencing analysis The nucleotide sequences of LAB were compared with the database in gene bank using Ez Taxon Bio Cloud web software (Table 3). The results confirmed that OTU2 and OTU4 were closely related to LactoBacillus kunkeei strain YH-15 (T)1 with pairwise similarity of 98.5% and 99.5%. OTU5 was closely related to Lactococcus lactis subsp. tructae strain L105 (T)2, Lactococcus lactis subsp. hordniae NBRC100931 (T)3, Lactococcus lactis subsp. lactis JCM5805 (T)4, and Lactococcus lactis subsp. cremoris NCD0607 (T)5 with pairwise similarity of 99.0%. OTU6 and OTU7 were closely related to Lactococcus lactis subsp. tructae strain L105 (T)2, Lactococcus lactis subsp. hordniae NBRC100931 (T)3, Lactococcus lactis subsp. lactis JCM5805 (T)4, and Lactococcus lactis subsp. cremoris NCD0607 (T)5 with pairwise similarity of 99.5%.
KARYAWATI et al. – Diversity of lactic acid bacteria from Apis dorsata
903
Table 3. Ez Taxon Bio Cloud results of 16S rRNA gene of LAB from flowers and the hives of Apis dorsata in Kupang District, East Nusa Tenggara, Indonesia Mismatch/ Completeness Pair wise Accession Total nt (%) Similarity number OTU2 LactoBacillus kunkeei YH-15 (T)1 3/202 100 98.5% JXDB01000004 OTU4 LactoBacillus kunkeei YH-15 (T)1 1/198 100 99.5% JXDB01000004 OTU5 Lactococcus lactis subsp. tructae L105 (T)2 2/201 100 99.0% EU770697 Lactococcus lactis subsp. hordniae NBRC100931 (T)3 2/201 100 99.0% BCVL01000058 Lactococcus lactis subsp. lactis JCM5805 (T)4 2/201 100 99.0% BALX01000047 Lactococcus lactis subsp. cremoris NCD0607 (T)5 2/201 100 99.0% AB100802 OTU6 Lactococcus lactis subsp. tructae L105 (T)2 1/200 100 99.5% EU770697 Lactococcus lactis subsp. hordniae NBRC100931 (T)3 1/200 100 99.5% BCVL01000058 Lactococcus lactis subsp. lactis JCM5805 (T)4 1/200 100 99.5% BALX01000047 Lactococcus lactis subsp. cremoris NCD0607 (T)5 1/200 100 99.5% AB100802 OTU7 Lactococcus lactis subsp. tructae L105 (T)2 1/200 100 99.5% EU770697 Lactococcus lactis subsp. hordniae NBRC100931 (T)3 1/200 100 99.5% BCVL01000058 Lactococcus lactis subsp. lactis JCM5805 (T)4 1/200 100 99.5% BALX01000047 Lactococcus lactis subsp. cremoris NCD0607 (T)5 1/200 100 99.5% AB100802 Notes: 1Edwards et al. (1998); 2Pérez et al. (2011); 3ex. Latorre-Guzman et al. (1977), Schleifer et al. (1986); 4Lister (1873), Schleifer et el. (1986); 5Orla-Jensen (1919), Schleifer et al. (1986); OTU = Operational Taxonomy Unit Code
Closest species
OTU2 and OTU4 were closely related to LactoBacillus kunkeei. This type of bacteria is known as a fructophilic LAB (Endo et al. 2012). L. kunkeei belongs to the heterofermentative LAB producing lactic acid, acetic acid, and ethanol as a result of glucose fermentation. These bacteria grow very weakly on glucose-containing media, but they can grow well if external electron acceptor such as oxygen, pyruvate, and fructose exist on the media. LactoBacillus kunkeei performs fructose fermentation faster than glucose and produced acid from fructose within 1-2 days, while the acid from glucose was formed on the 3rd day until the 4th day. Based on this information, the type of LAB from OTU2 and OTU4 identified as LactoBacillus kunkeei was a fructophilic LAB. This bacterium was able to live in the hive environment because the hives contain large quantities of honey consisting of high levels of fructose. L. kunkeei was also found in crop (honey in stomach), midgut and hindgut of Apis mellifera, the bacteria were dominant in the crop (Anderson et al. 2013). Isolates of Mesquite flower and honey contained L.kunkeei (Anderson et al. 2013). OTU5, OTU6, and OTU7 were closely related to Lactococcus lactis. The L. lactis bacteria known to be safe for humans (Laroute et al. 2017; Nuryshev et al. 2016). L. lactis isolated from milk in Russia has antimicrobial activity against Gram positive and Gram-negative bacteria and antifungal to the fungi of the genus Aspergillus, Fusarium, and Candida (Nuryshev et al., 2016). These bacteria are resistant to acidic environments and bile salts, are sensitive to antibiotics, and exhibit treatment effects in mice suffering from chronic ileum-dermatitis (Nuryshev et al. 2016). Based on this information, OTU5, OTU6, and OTU7 were predicted to have potential candidates for probiotics with functional properties as antibacterial and antifungal, which may play an important role in the treatment of chronic ileum dermatitis. According to
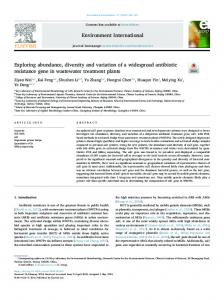
Laroute et al. (2017), L. lactis is divided into four subspecies: lactis, cremoris, hordniae, and tructae, but only subspecies lactis and cremoris are of industrial interest. L. lactis is involved in the manufacture of dairy products, such as cheese, buttermilk and sour cream. The role of L. lactis is acidification step and contributes to the flavor of dairy products, notably due to its capacity to produce diacetyl and acetoin. Diacetyl is an aroma wellknown for its buttery taste. The phenotype investigation of L. lactis strains reported here revealed highly diverse carbohydrate metabolism, especially in plant- and gutderived carbohydrates, diacetyl production and stress survival (Laroute et al. 2017). L. lactis aids in food safety because of high production of lactic acid and antimicrobial agents such as bacteriocin. Phylogenetic tree analysis Phylogenetic analysis using MEGA 7.0 by neighborjoining method (with bootstrap 2000x) showed that OTU2 and OTU4 had 99% bootstrap value and were closely related to LactoBacillus kunkeei YH-15 (T) (Figure 3). OTU5 and OTU6 and OTU7 had 99% bootstrap value and were closely related to Lactococcus lactis subsp. tructae strain L105 (T), Lactococcus lactis subsp. hordniae NBRC100931 (T), Lactococcus lactis subsp. lactis JCM5805 (T), and Lactococcus lactis subsp. cremoris NCD0607 (T). Results of this phylogenetic tree analysis were the same as results of Ez Taxon Bio Cloud web. Taxonomy of LactoBacillus kunkeei: Kingdom of Bacteria, Phylum Firmicutes, Class Bacilli, Order Bacillales, Family Bacillaceae, Genus Bacillus. Taxonomy of Lactococcus lactis: Kingdom of Bacteria, Phylum Firmicutes, Class Bacilli, Order Bacillales, Family Streptococcaceae, Genus Lactococcus.
B I O DI VE RS I T A S 19 (3): 899-905, May 2018
904
KJ394457 Lactococcus laudensis 4195 (T)
87
EF694028 Lactococcus chungangensis CAU 28 (T)
85
DQ343754 Lactococcus piscium CCUG 32732 (T) 29
96
BCVN01000061 Lactococcus raffinolactis NBRC 100932 (T) AEQQ01000116 Streptococcus agalactiae ATCC 13813 (T) HQ335006 Streptococcus hongkongensis HKU30 (T)
86
35
LHQM01000004 Streptococcus phocae subsp. phocae ATCC 51973 (T)
55
97 JSAP01000001 Streptococcus phocae subsp. salmonis C (T)
AB828327 Streptococcus saliviloxodontae NUM 6306 (T) 99 AB828326 Streptococcus loxodontisalivarius NUM 6304 (T)
55
OTU5 OTU6 OTU7 30 99
EU770697 Lactococcus lactis subsp. tructae L105 (T) BCVL01000058 Lactococcus lactis subsp. hordniae NBRC 100931 (T) BALX01000047 Lactococcus lactis subsp. lactis JCM 5805 (T)
52
AB100802 Lactococcus lactis subsp. cremoris NCDO 607 (T) AB699722 Lactococcus taiwanensis 0905C15 (T) BCVM01000025 Lactococcus plantarum NBRC 100936 (T) AY533171 Pilibacter termitis TI-1 (T) ACKZ01000002 Granulicatella adiacens ATCC 49175 (T)
86 67
HQ433455 Oceanobacillus limi H9B (T) KX881420 Vagococcus martis D7T301 (T) 99 BBEQ01000098 Lactobacillus collinoides JCM 1123 (T) 57
99
AZFD01000165 Lactobacillus paracollinoides DSM 15502 (T) KP677494 Lactobacillus insicii TMW 1.2011 (T) OTU4 99
77
JXDB01000004 Lactobacillus kunkeei YH-5 (T) OTU2
48
JX099541 Lactobacillus apinorum Fhon13N (T) AYYQ01000014 Lactobacillus ozensis DSM 23829 (T)
41 62
CP018906 Lactobacillus curieae CCTCC M2011381 (T)
0.02
Figure 3. Phylogenetic tree of 16S rRNA gene of lactic acid bacteria from flowers and the hives of Apis dorsata in Kupang District, East Nusa Tenggara, Indonesia with MEGA 7 (bootstrap analysis with 2000 replication) software. Note: OTU code refers to Table 5.
Diversity of lactic acid bacteria from Apis dorsata hives was higher than diversity of lactic acid bacteria from flowers. Lactic acid bacteria from Apis dorsata hives and flowers were closely related to LactoBacillus kunkeei and Lactococcus lactis. Based on results of bacterial diversity analysis, lactic acid bacteria from flowers and Apis dorsata hives in East Nusa Tenggara (Indonesia) can be predicted as potential candidates for probiotics with functional properties as antibacterial and antifungal. We note that the diversity analysis using DGGE method has limitations, because it is not compatible to analyze the long DNA fragments. We recommended for further research to quantify the diversity of lactic acid bacteria by advanced methods such as metagenomic with next-generation sequencing methods to examine culturable and unculturable lactic acid bacteria from hives and flowers of native honeybees.
ACKNOWLEDGEMENTS We would like to thank to Directorate General of Higher Education for funding of Postgraduate Team Research to Anja Meryandini with contract number 011/SP2H/LT/DRPM/VIII/2017. REFERENCES Anderson KE, Sheehan TH, Mott BM, Maes P, Snyder L, Schwan MR, Walton A, Jones BM, Corby-Harris V. 2013. Microbial ecology of the hive and pollination landscape: bacterial associates from floral nectar, the alimentary tract and stored food of honey bees (Apis mellifera). PlosOne 8 (12): e83125. Daeschel MA, Anderson RE, Fleming HP. 1987. Microbial ecology of fermenting plant materials. FEMS Microbiol Reviews 46: 357-367. Endo A, Irisawa T, Futagawa-Endo Y, Takano K, du Toit M, Okada S, Dicks LMT. 2012. Characterization and emended description of
KARYAWATI et al. – Diversity of lactic acid bacteria from Apis dorsata LactoBacillus kunkeei as a fructophilic lactic acid bacterium. Int J Syst Evol Microbiol 62: 500-504. Hadisoesilo S. 2001. Review: The diversity of indigenous honey bee species of Indonesia. Biodiversitas 2 (1): 123-128. DOI: 10.13057/biodiv/d020107. Hill TCJ, Kerry A, Harris JA, Moffett BF. 2003. Using ecological diversity measures with bacterial communities. FEMS Microbiol Ecol 43: 1-11. Kumar S, Stecher G, Tamura K. 2016. MEGA7: Molecular Evolutionary Genetics Analysis Version 7.0 for Bigger Datasets. Molecular Biol and Evol 33 (7): 1870-1874. DOI: 10.1093/molbev/msw054. Laroute V, Tormo H, Couderc C, Mercier-Bonin M, Le Bourgeois P, Cocaign-Bousquet M, Daveran-Mingot ML. 2017. From genome to phenotype: an integrative approach to evaluate the biodiversity of Lactococcus lactis. Microorganisms 5 (27): 1-17. DOI: 10.3390/microorganisms5020027. Latorre-Guzman BA, Kado CI, Kunkee RE. 1977. LactoBacillus hordniae, a new species from the leafhopper (Hordnia circellata). Int J Syst Bacteriol 27: 362-370. Muyzer G, De Waal EC, Uitterlinden AG. 1993. Profiling of complex microbial populations by denaturing gradient gel electrophoresis analysis of polymerase chain reaction-amplified genes coding for 16S rRNA. Appl Environ Microbiol 59 (3): 695-700. Muyzer G, Smalla K. 1998. Application of denaturing gradient gel electrophoresis (DGGE) and temperature gradient gel electrophoresis (TGGE) in microbial ecology. Antonie van Leeuwenhoek 73: 127141. Nuryshev MZ, Stoyanova LG, Netrusov AI. 2016. New Probiotic Culture of Lactococcus lactis spp. lactis: Effective Opportunities and Prospects. J Microb Biochem Tech 8 (4): 290-295. Olofsson TC, Vasquez A. 2008. Detection and identification of a novel lactic acid bacterial flora within the honey stomach of the honeybee Apis mellifera. Curr Microbiol 57: 356-363. Orla-Jensen S. 1919. The lactic acid bacteria. AF Host and Sons Forlag, Copenhagen.
905
Ovreas L, Forney L, Daae FL, Torsvik V. 1997. Distribution of bacterioplankton in meromictic lake saelenvannet, as determined by denaturing gradient gel electrophoresis of PCR-amplified gene fragments coding for 16S rRNA. Appl Environ Microbiol 63 (9): 3367. Pangastuti A, Suwanto A, Lestari Y, Suhartono MT. 2010. Bacterial communities associated with white shrimp (Litopenaeus vannamei) larvae at early developmental stages. Biodiversitas 11 (2): 65-68. DOI: 10.13057/biodiv/ d110203. Park KS, Ki CS, Kang CI, Kim YJ, Chung DR, Peck KR, Song JH, Lee NY. 2012. Evaluation of the Gen Bank, Ez Taxon, and BIBI services for molecular identification of clinical blood culture isolates that were unidentifiable or misidentified by conventional methods. J Clinic Microbiol 50 (5): 1792-1795. Pérez T, Balcázar JL, Peix A, Valverde A, Velázquez E, de Blas I, RuizZarzuela I. 2011. Lactococcus lactis subsp. tructae subsp. nov. isolated from the intestinal mucus of brown trout (Salmo trutta) and rainbow trout (Oncorhynchus mykiss). Int J Syst Evol Microbiol 61 (8): 1894-1898. DOI: 10.1099/ijs.0.023945-0. Radita R, Suwanto A, Kurosawa N, Wahyudi AT, Rusmana I. 2017. Metagenome analysis of tempeh production: Where did the bacterial community in tempeh come from? Malay J Microbiol 13 (4): 280288. Schleifer KH, Krans J, Dvorak C, Kilpper-bälz R, Collins MD. 1985. Transfer of Streptococcus lactis and related Streptococci to the genus Lactococcus gen.nov. Syst Appl Microbiol 6: 183-195. Tajabadi N, Mardan M, Manap MYA, Mustafa S. 2013. Molecular identification of LactoBacillus spp. isolated from the honey comb of the honey bee (Apis dorsata) by 16S rRNA gene sequencing. J Apicultur Res 52 (5): 235-241. Yoon SH, Ha SM, Kwon S, Lim J, Kim Y, Seo H, Chun J. 2017. Introducing EzBioCloud: a taxonomically united database of 16S rRNA gene sequences and whole-genome assemblies. Int J Syst Evol Microbiol 67: 1613-1617. DOI:10.1099/ijsem.0.001755.