Chemical Evolution vs Biological Evolution: Coupling Effect and Consequences Author Author Alexander A. A. Ivlev Ivlev Alexander
Chemical Evolution vs Biological Evolution: Coupling Effect and Consequences Author
Alexander A. Ivlev Russian State Agrarian University - MSKhA of K.A.Timiryazev Dept. Inorganic & Analytical Chemistry, Timiryazevskaya str., 49 127550, Moscow
Transworld Research Network, T.C. 37/661 (2), Fort P.O., Trivandrum-695 023 Kerala, India
Published by Transworld Research Network 2013; Rights Reserved Transworld Research Network T.C. 37/661(2), Fort P.O., Trivandrum-695 023, Kerala, India E-mail IDs:
[email protected] [email protected];
[email protected] Websites: http://www.ressign.com http://www.trnres.com http://www.signpostejournals.com http://www.signpostebooks.com Author Alexander A. Ivlev Managing Editor S.G. Pandalai Publication Manager A. Gayathri Transworld Research Network assumes no responsibility for the opinions and statements advanced by the Author ISBN: 978-81-7895-604-6
Contents
Preface § 1. The hypothesis on cyclic character of the evolution
1
§ 2. Carbon dioxide is an environmental factor limiting evolution of photosynthesis
3
§ 3. “Carbon dioxide – bicarbonate – carbonate” system of atmosphere and hydrosphere
4
§ 4. The irregularity of lithospheric plate’s movement is a possible cause for irregular and jump-like character of CO2 content changes in the atmosphere
5
§ 5. Jump-like evolution of atmosphere and hydrosphere system interacting with biosphere within the framework of mobilism concept
9
§ 6. The facts confirming the validity of the suggested model of evolution
13
§ 7. Timing of photosynthesis origin according to carbon isotopic data
19
§ 8. The origin of photorespiration – new aromorphosis in biological evolution. Its consequences. Ecological compensation point
23
§ 9. Data on carbon isotope composition of carbonates and sedimentary organic matter evidencing in favor of jump-like character of photosynthesis evolution in Precambrian
27
§ 10. Stratigraphic distribution of organic matter in source rocks and genetically related oils are in conformity with the evolution model predictions made on the basis of carbon isotope composition
28
§ 11. The correlations caused by interaction of the processes in the Earth’s crust and in the “atmosphere – hydrosphere – biosphere” system during geological time
35
§ 12. Reconstruction of some stages of biological evolution using the suggested model and available experimental data
41
Conclusions
53
Literature
57
Preface About evolution. Evolution arsenal: Means and instruments. Despite the evolution problem has been treated many times by a number of scientific journals and books an inextinguishable interest of researchers doesn’t disappear. The scientists take up with it again and again. What is the reason for that? The reply is simple. By examining the factors governing biosphere evolution in the past and trying to understand the laws controlling interaction of chemical and biological evolutions the scientists strive to realize what problems the mankind meets today and how it is possible to predict the nearest and remote future of the mankind with the use of our knowledge of the evolution trajectory. In study of evolution problems a researcher faces a striking unity of the processes occurring on the Earth quite different by nature. Here some examples of them are: lithospheric plates movement and photosynthesis development, atmosphere evolution and organic matter accumulation in sedimentary rocks, source rocks formation and climate changes on the Earth. This is only a short list of the links that one encounters in evolution studies. The evolution of photosynthesis is the essential part of the evolution problem. My interest to it has been evoked since during two last decades a number of important findings have been made in this field. Above all it is discovery of a new carbon isotope effect associated with photorespiration (Ivlev, 1993; Igamberdiev et al., 2001). The sign of the effect turned to be opposite to that in CO2 assimilation. Till now it was commonly adopted that the observed 12C-enrichment of “living” matter (the total biomass of all photosynthesizing and heterotrophic organisms living on the Earth) was a result of carbon isotope fractionation in photosynthesis. It was proved that, in fact, carbon isotope effect in photosynthesis is complex one and includes both: carbon isotope effect of CO2 assimilation and that of photorespiration. We have learned a lot about mechanism of photosynthesis. In particular, it was shown that photosynthesis is an oscillating process consisting of two phases – CO2 assimilation and photorespiration. The processes are reciprocal and provide strict temporal organization of photosynthesis. It was also found that because of opposite signs of carbon isotope effects CO2 assimilation brings about 12C-enrichment of biomass relative to CO2 assimilated whereas photorespiration results in 13C accumulation in biomass. Since carbon isotope effect of photorespiration is
smaller than that of CO2 assimilation, photorespiration leads to a reduction of 12 C abundance in “living” matter (Ivlev et al., 2004; Ivlev, 2008). Rubisco, the main photosynthetic enzyme, plays the key role in the oscillation mechanism due to its ability to work as carboxylase as well as oxygenase depending on CO2/O2 ratio at carboxylation sites. The ratio periodically varies in a cell making Rubisco to work as oscillation regulator and switching the cell from CO2 assimilation to photorespiration and back. The role of CO2/O2 ratio in regulation of oscillating mechanism was experimentally confirmed (Tcherkez et al., 2008) and later was proved by theoretical calculations (Dubinsky, Ivlev, 2011). The principal findings made in carbon isotope fractionation in photosynthesis made it necessary to introduce the new ideas into interpretations of carbon isotope data used in evolution studies. First of all it was interesting to investigate how oscillating mechanism of photosynthesis might appear in the course of evolution. It was evident that CO2 assimilation and photorespiration failed to emerge simultaneously since photosynthesis has originated in anoxic environment. The oxygen, substrate for photorespiration, has appeared later as a result of ongoing CO2 photoassimilation. It took some time to accumulate oxygen in the atmosphere before photorespiration could appear. Opposite signs of carbon isotope fractionation of photoassimilation and photorespiration gave a hope by using these differences to find new imprints in geological chronicle and to get new information. The above explains our intention to make new insight to the problem. Isotopic techniques are used in evolution studies long ago, but only now they became an effective instrument of researches. It became possible to substitute qualitative estimates, based on simple comparison of isotope differences of the objects, by interpretation of isotopic data with the use of physico-chemical models of the processes. Such approach makes isotopic technique really effective. In the analysis of isotopic shifts it must be taken into consideration that isotope effects in the most of natural processes arise as a result of different rates of isotopic molecules (kinetic isotope effect) in chemical reaction either as a result of nonequivalence of energy levels in the molecules (thermodynamic isotope effect). Besides of great advantages of molecular approach in interpretation of isotopic data one meets considerable difficulties bound to the fact that isotopic shifts appearing on molecular level should be found in global macroeffects. In other words, one should find the manifestation of molecular effects occurring in a cell in the properties and in the characteristics of the whole organism and even in the “living” matter as a whole, i.e. on the biosphere level. The researcher must reveal and prove this links.
Another question which is to be considered, how it is possible to reconstruct the events that had taken place hundreds millions years ago basing only on physico-chemical laws true for present processes. The basic instrument to solve this task is the actualism principle. In common sense it may be formulated as follows: the physical and chemical laws do not depend on time. Bearing this in mind it is possible to create a tentative scenario of what could occur in the past if substantiation of environmental parameters for that time may be done. The validity of the accepted assumptions may be proved by comparison of the observed facts with those expected from the processes in accordance with the tentative scenario. The facts may be different. Some may be presented as paleontological remnants, or as carbon isotope composition of carbonates and organic matter, the other as definite discrepancies of compared objects, etc. The main idea of this manuscript to acquaint the readers with a cyclic and uneven character of chemical and biological evolutions and their interaction during geological time. The author is very grateful to Prof. S. E. Snoll from Moscow State University whose bright lectures on biophysics and evolution author has attended for some years. He also highly appreciates his long-term help and support. The author is much obliged to his colleagues in Russian State Agrarian University and in All-Russian Scientific Research Oil Institute for fruitful discussion of some aspects of the problem.
Name?
Transworld Research Network 37/661 (2), Fort P.O. Trivandrum-695 023 Kerala, India
Chemical Evolution vs Biological Evolution: Coupling Effect and Consequences, 2013: 1-65 ISBN: 978-81-7895-604-6 Author: Alexander A. Ivlev
Chemical evolution vs biological evolution: Coupling effect and consequences A.A. Ivlev Russian State Agrarian University - MSKhA of K.A.Timiryazev Dept. Inorganic & Analytical Chemistry, Timiryazevskaya str., 49 127550 Moscow
§ 1. The hypothesis on cyclic character of the evolution The idea on the existence of irregular and cyclic (jump-like) character of the Earth evolution was repeatedly stated by many scientists (Rutten 1971; Flint, 1973; Mackenzie & Piggot,1981). The cyclic character was also noted for biosphere development (Meyen, 1987; Malinovsky 1990). The cycles in oil genesisis and in non-uniform stratigraphic distribution as a reflection of cyclic character of biological evolution were considered by some geologists (Maximov et al., 1977; Vishemirsky & Kontorovich, 1997; Neruchev, 1999). However some important and difficult problems remain unexplored at present, such as: what’s the reason for cyclicity, how do the chemical and biological evolutions cooperate and impact on each other. Rutten (1971) formulated the cyclicity idea more precisely than others. He suggested that both evolutions interact via conjugate changes of CO2 and O2 concentrations Correspondence/Reprint request: Dr. A.A. Ivlev, Russian State Agrarian University - MSKhA of K.A. Timiryazev, Dept. Inorganic & Analytical Chemistry, Timiryazevskaya str., 49 127550 Moscow. E-mail:
[email protected]
2
A.A.Ivlev
in “atmosphere–hydrosphere” system. He suggested the concept on orogenic cycles. According to Rutten (1971), the geological history of the Earth consists of alternating orogenic cycles. Each cycle includes a rather short orogenic period, characterized by intensive movement of lithospheric plates, by mountain building and active volcanism, and rather extended geosynclynal period, which is the time of quiet development of an earth's crust, of slow plate movement and reduction of volcanic activity and mountain building. The periodicity of geological processes has determined the conjugate changes in the Earth’s atmosphere and via atmospheric changes has exerted an impact on biosphere development. Mobilism concept has appeared approximately at the same time (Monin, 1977; Flint, 1973; Khain, 2001). The supporters of the concept claimed that the lithospheric plates forming the Earth’s crust are in permanent movement and a number of geological events depend on their motion and collisions. Different intensity of plate movement in the orogenic and geosynclynal period allows concluding that the rate of plates is uneven. In the orogenic period rate of plates is higher and collisions of them occur more frequently. Due to the processes following the plate collisions in the orogenic period carbon dioxide entering the atmosphere from the Earth’s crust is greater as compared with the geosynclynal period. It repeats in each orogenic cycle. Thus uneven plate movement results in jump-like CO2 entry into the atmosphere. The CO2 being a substrate and limiting factor in photosynthesis determine irregular character of the development process in biosphere. Bearing in mind that the lifetime of organisms is a negligible value as compared with duration of geological processes and considering “atmosphere-hydrosphere” system in time-scale of orogenic cycle one can treat CO2 concentration in the atmosphere and organic matter in sediments as substrate and product of the same global photosynthesis reaction proceeding in the system. If so, it can be concluded that in orogenic period and at the beginning of geosynclynal period when CO2 concentration in the system is high the organic matter accumulation in sediments is minimal. On contrary, when CO2 concentration falls to minimum by the end of geosynclynal period at the expense of photosynthesis, the organic matter in sediments grows up to maximum. Thus CO2 concentration in the atmosphere and organic matter in sediments are coupled and vary in anti-phase regime. In the manuscript the author made an attempt to connect the Rutten’s idea on orogenic cycles and lithospheric plate movement idea from the mobilism concept. It allowed him tracing the impact of plate movement on the CO2 and O2 variations in the atmosphere. From the other side taking into account the impact of CO2 and O2 on photosynthesis, it became possible to unite all the processes in the Earth’s crust, in atmosphere and in biosphere to investigate their interaction and coherence. In this connection considerable
Interaction of chemical and biological evolutions
3
attention in the manuscript was devoted to the following problems: 1) how evolution of photosynthesis took place at the background of orogenic cycles and 2) how the organic matter accumulated in the sedimentary rocks reflected the photosynthesis evolution. The results are presented in the following sections.
§ 2. Carbon dioxide is an environmental factor limiting evolution of photosynthesis Evolution is the process that occurs along the pathway of overcoming the factors limiting its rate. Striving for kinetic perfection is one of the main stimuli of evolution (Snoll’, 1981). The photosynthesis rate, like a rate of any chemical reaction, is determined by the Law of active masses. The changes, occurring in a photosynthesizing cell in the course of evolution, allow suggesting that the limiting factor of photosynthesis evolution was the CO2 content in the environment. In fact, since the photosynthesizing life has originated in the ocean, from two photosynthesis substrates − CO2 and H2O, only the first might be the factor limiting the rate of photosynthesis exerting influence on the CO2 concentration at carboxylation sites. The CO2 concentration depends on the rate of diffusion of CO2 molecules in water, which is known to be very low. In response to this demand, the enzyme carboanhydrase has appeared. It provided fast conversion of the bicarbonateion, a dominant form of assimilated carbon in sea water, into the neutral CO2 molecule. By this way the evolution has provided effective penetration CO2 through the cell membrane to sites of carboxylation. The increase of CO2 fixation rate inside a cell was achieved owing to the rise of carboxylating enzyme concentration – ribulosobisphosphatecarboxylase (RuBP-carboxylase) to such degree that made this protein one of the most abundant on the Earth. Moreover the emergence of photorespiration in the evolution was also a response of photosynthesizing cell on the lack of CO2 in the environment. The photorespiration solved two tasks. Firstly, it allowed utilizing oxygen that appeared in the atmosphere and might be harmful for a cell, as a substrate for RuBP-carboxylase instead of CO2. Secondly, it allowed obtaining additional amount of CO2 as a photorespiration product (Igamberdiev, Roussel, 2012). The content of carbon dioxide in the environment remained the factor controlling photosynthesis rate even after the settling of land by photosynthesizing organisms. Some new factors limiting the rate of photosynthesis have been added, such as water availability, temperature, and others determining different strategy of organism adaptation to diverse
4
A.A.Ivlev
terrestrial conditions of habitation. In terrestrial plants there appeared the stoma apparatus restricting release of the CO2 from intercellular space formed during respiration. Thereby its concentration at the carboxylation sites has arisen. In the vascular terrestrial plants there appeared the ability to vary density of stoma apertures on the leaf surface to maintain the efficient partial intracellular pressure of CO2 depending on partial pressure of CO2 in the environment. A gradual decrease of CO2 concentration in atmosphere has led to the appearance of C4 and Crassulaceaen acid metabolism (CAM) plants with high efficiency of CO2 accumulation in habitats with low CO2 concentration. The special mechanism of CO2 concentration has emerged in some aquatic microorganisms and plants (Igamberdiev & Lea, 2006). Thus the presented examples indicate that CO2 was the limiting factor of photosynthesis rate in the course of evolution. Therefore, it can be expected that the knowledge of how CO2 content was changing in the atmosphere will allow tracing the sequence of evolution stages.
§ 3. “Carbon dioxide – bicarbonate – carbonate” system of atmosphere and hydrosphere Carbon dioxide entering the atmosphere is redistributed between aquatic and gaseous phases in conformity with Henry’s law via the common carbon “atmosphere−hydrosphere” system. Between dissolved forms of inorganic carbon and gaseous CO2 chemical exchange occurs CO2(gas)↔ CO2(solution) ↔HCO3−⎯↔ CO3-2
(1)
Since the reaction rates, characterizing of chemical exchange in the above system, are much higher than the rates characteristic of geological and evolutionary processes this system can be considered as equilibrium. This is confirmed by isotope exchange equilibrium, which is reached in the indicated system after the achievement of chemical equilibrium (Thode et al., 1965). Indeed, the observed differences in the carbon isotope composition of the atmospheric CO2 (δ13C = −7‰) and carbonate forms dissolved in the sea water (δ13C = 0‰) amount on average to 5 - 7‰ (Wendt, 1968; Degens, 1974) and correspond to equilibrium coefficients of isotope fractionation between exchanging forms α(CO2/ CO3-2) and α(CO2/ HCO3-) that for usual temperatures on the Earth surface (0 – 30°C) amount to 1,005 – 1,008 (Abelson & Hoering, 1960; Deaser & Degens, 1967). In the equilibrium system concentrations of all components are unequivocally connected with each other via thermodynamic correlations.
Interaction of chemical and biological evolutions
5
It allows reducing study of all system components to analysis of only one of them, for instance, of the atmospheric CO2 concentration. In Rutten’s monograph “Origin of Life” (1971) it has been asserted that CO2 content in the atmosphere wasn’t constant in the course of geologic time but had jump-like character. The assumed reason for such behavior will be considered in the next section. Here we note that, according to thermodynamic analysis, by the moment of photosynthesis origin the CO2 content in the ancient Archean atmosphere was much higher than in contemporary atmosphere (Garrels, Krist, 1968). It is confirmed by relatively weak carbonate formation in Archean (Ronov, 1976), what is explained by carbonate dissolution at high CO2 concentrations with their conversion into hydrocarbonates CO3-2(sediment) + CO2(gas) + H2O ↔ 2 HCO3− (solution)
(2)
§ 4. The irregularity of lithospheric plate’s movement is a possible cause for irregular and jump-like character of CO2 content change in the atmosphere Prior to analysis of the possible reasons for irregular and jump-like CO2 entry into atmosphere let’s see first two important assumptions in respect to CO2 source in orogenic periods. Rutten (1971) was the first who put forward the assumption that CO2 is of endogenous juvenile origin, i.e. it is related to mantle degassing. He supposed that in orogenic periods CO2 entered the atmosphere by approximately equal portions. He also noted that CO2 jumps in orogenic periods happened simultaneously with O2 drops in the atmosphere, i.e. when CO2 arises, O2 falls. Some other geologists supported this idea (Ronov, 1976; Budyko, Ronov, 1979; Budyko, 1995) considering that endogenous energy of the Earth regulates the CO2 amount rising from inside to the surface. They connected the further fate of juvenile carbon with the carbon that got into sediments as carbonates and organic matter. They might be kept there vaguely long time. The fact that some part of sedimentary carbon might come back into carbon cycle (into labile carbon pool) by erosion, by weathering, or by depth metamorphism wasn’t denied. But these processes were regarded as insignificant. Hayes and colleagues have suggested the alternative point of view on the source of CO2 (Hayes et al., 1989). They assumed that the total amount of carbon entering the “atmosphere–hydrosphere” system is equal to the total amount of carbon coming from sediments. It means that CO2 is
6
A.A.Ivlev
predominantly of sedimentary origin whereas mantle contribution is negligible. Mackenzie and Piggot (1981) have supported this opinion assuming that total amount of carbon and sulfur on the Earth is constant. In addition, they have taken into account the coupling of cycles of both elements basing on current mobilism theory. According to the authors both elements exist in two reservoirs in different forms – oxidized and reduced. The reservoir of oxidized carbon consists of CO2 and carbonates, the reservoir of reduced carbon includes organic matter from sedimentary rocks. Similarly the reservoir of oxidized sulfur consists of rock sulfates. Just the reservoir of reduced sulfur includes H2S and different forms of sulfides. To understand the interaction of carbon and sulfur cycles let’s see the transformations occurring in subduction zones, according to mobilism concept. Following this theory, the plates composing Earth’s crust surface perform permanent movement, reminding that of escalator. In the area of Earth at the middle-oceanic mountain ridges magma exits to the surface and neoformation of cortex occurs. After solidification magma moves apart basalt plates composing cortex. In another Earth area (in Benyof’s zones) during plates collision, one of them is bending, moving down under the other and is adsorbed. The reason for the plate movement is not quite clear yet, but most of the researchers relate it to magma convection under impact of celestial bodies on Earth’s nuclei and mantle (Harlend et al., 1985; Neruchev, 1999). The collisions with participation of continental plates are of particular interest since they bear sedimentary rocks. In the zone of plate collisions high tension and pressure as well as high temperatures appear. The large masses of sediments covering plates frustrate from their base and are subjected to destruction. The metamorphism products having less density than underlying beds are carried out to the surface. At that gaseous and volatile substances fall into the Earth atmosphere forming its composition. Leaving aside many details of these processes, which one can find out in special literature (Monin, 1977; Flint, 1978; Dalimov, Troickii, 2007), we concentrate our attention on the processes that occur in the zones of plate collisions and result in destruction of sedimentary rocks. The sedimentary carbonates getting the zone of collisions under effect of high temperatures and powerful pressures are destructed, converting into carbon dioxide. The metal cations, bound in carbonates, release and interact with rock silica, forming silicates that more stable under the above conditions: MeCO3 + SiO2 → MeSiO3 + CO2
(3)
Interaction of chemical and biological evolutions
7
Under the same conditions the organic matter of sedimentary rocks interacting with rock sulfates is oxidized. The carbon of organic matter (CH2O) also converts into CO2 in sulfate reduction (equation 4), thus filling the oxidized reservoir of carbon by additional amount of CO2. SO42- + 2 CH2O → 2 CO2 + H2O + S=
(4)
Rock sulfur in turn is transferred from oxidizing reservoir into reducing one. Besides sulfur of sulfides the latter, interacting with sulfates, gives rise to elemental sulfur SO42- + 4 H2S → 5S + H2O
(5)
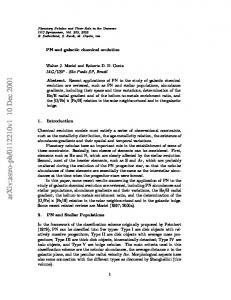
Thus carbon and sulfur cycles turned to be coupled via organic matter of sedimentary rocks. It is evident, the indicated coupling might arise only after photosynthesis appearance, since it provides ”living” matter formation on the Earth and reverse transfer of carbon from the oxidized reservoir to the reduced one (CO2 => ”living” matter). After burial and sedimentation of ”living” matter the reduced carbon (Corg) begins to act in zone of plate collisions as sulfate reductant and simultaneously it provides sulfur transfer from the oxidized reservoir to the reduced one. Carbon isotope effect in CO2 to organic carbon transformation and sulfur isotope effect in sulfate to sulfide transformation turned out to be coupled in the course of elements turnover. The coupling results in the correlation between carbon and sulfur isotope characteristics. It was noticed by Mackenzie and Piggot (1981) as synchronous changes of secular curves, describing carbon isotope composition of sedimentary carbonates and sulfur isotope composition of sulfates during the last 700 Ma (Fig. 1). The close relationship between carbon and sulfur cycles has been also noted by Berner (1999). Considering the robust mechanism of plate movement stemming from the mobilism theory at the same time we took into account rational Rutten’s presentations on orogenic cycles, based on thorough analysis of geological material. To reconcile both concepts we introduced the assumption, that in orogenic periods the plates move with greater rates than in geosynclynal ones and hence plates collide more often. It, in turn, allows asserting that amount of CO2 entering the atmosphere in orogenic period much greater than in geosynclynal one. In such a case the following scenario of evolution may be suggested. In orogenic period of orogenic cycles CO2, formed in collision zone and elevating
8
A.A.Ivlev
Figure 1. Synchronous changes of secular curves of carbon isotope composition of carbonates (A) and sulfur isotope composition of evaporate sulfates (B) for the last 700 years in the geologic history of the Earth. Replotted from Mackenzie & Pigott, (1981).
onto the Earth surface, fills carbon “atmosphere−hydrosphere” system distributing there in accordance with Henry’s law and chemical thermodynamics. Because of short-term duration of orogenic period as compared with geosynclynal one, CO2 concentration in the system varies by jump. In long-term and quiet geosynclynal period the rate of CO2 entry from the crust to the surface is lower than the rate of consumption at the expense of photosynthesis. It results in gradual depletion of CO2 in the system and to a decrease of CO2 level in the atmosphere. A periodicity in CO2 entry onto the Earth surface is confirmed by cyclically varying volume of mid-ocean ridge at the points of magma exits on the surface (Mackenzie & Piggot, 1981), by coupled variations of sea level and land size, by average size of elevations and denudation rates (Flint, 1973). Rutten (1971) proved the jump-like character of CO2 entry into the atmosphere by analyzing sedimentary successions of rocks, their composition and facies. All the facts also evidenced in favor of alternation of relatively short periods of intensive volcanism and orogenesis with long periods of relatively quite development of Earth crust. According to his estimate, based both on relative and absolute (using decay of radioactive elements) dating, the duration of orogenic periods is about 50 Ma whereas that of geosynclinal periods is from 100 to 500 Ma.
Interaction of chemical and biological evolutions
9
The assumed relationship of carbon and sulfur cycles is supported by the following facts. Up to the end of pre-Cambrian time, until a considerable amount of O2 has accumulated in the atmosphere, there was considerable infectiousness with hydrogen sulfide of ocean depth water. This was indirect argument in favor of sulfate reduction with organic matter (Canfield, 1998). Simultaneously wide expansion of sulfide oxidizing bacteria took place (Canfield & Teske, 1996). The last were distributed so strongly, that gave Hayes and co-workers (Hayes et al., 1999) an occasion to assume, that biomass of the above bacteria was the main source of organic matter in sediments at that period. The aforementioned synchronous changes of secular curves describing carbon and sulfur isotope composition of carbonates and sulfates respectively for the last 700 millions years also evidence in favor of the relationship of carbon and sulfur cycles (Fig.1) (Mackenzie & Pigott, 1981).
§ 5. Jump-like evolution of atmosphere and hydrosphere system interacting with biosphere within the framework of mobilism concept To create a model one needs to formalize the presented concept by strengthening the essential moments and neglecting accidental ones. The model that is going to be discussed is based on the photosynthesis reaction, hν
CO2 + H2O ⎯⎯→ O2 + (CH2O)
(6)
This global photosynthesis reaction occurring on the Earth is under control of the CO2 releasing from the zones of plates collision and ascending to the Earth surface filling the atmosphere. It means that at the beginning of orogenic cycle (in orogenic period) CO2 concentration in the atmosphere is maximal. In the following geosynclynal period in accordance with chemical kinetics the exponential decrease of CO2 concentration and vice versa the exponential increase of O2 concentration occurs in the atmosphere. In parallel with O2, a “living” matter, the second product of global photosynthesis reaction, is produced. After burial the latter transforms into sedimentary organic matter. Neglecting lifespan of organisms relative to geological time, it may be adopted that organic matter falls into sediments practically simultaneously with O2 entering the atmosphere. The above changes of reaction participants are depicted on Fig.2. All the curves, shown on the Fig.2, have exponential character in geosynclynal period. The O2 production in geosynclynal period exceeds its
10
A.A.Ivlev
Figure 2. The curves describing the assumed changes of CO2 and O2 content in the atmosphere and organic matter in sediments in the course of orogenic cycle.
consumption in orogenic one. It causes growth of O2 content in the atmosphere on average from one cycle to another. Following the same logic, we have to accept that the excess of organic matter corresponding to O2 growth in the atmosphere is accumulated in sediments. Hence the more oxygen growth is in the atmosphere, the more organic matter accumulates in sedimentary rocks. As we do not know exactly neither duration of orogenic period, nor its ratio in respect to duration of geosynclynal period, but only the fact that the first is much shorter than the second, on the Fig.2 the orogenic periods are depicted as triangles. The concentration changes of CO2, O2, and Corg in geosynclynal periods are shown as conditional exponential curves. Given that photosynthesis is non-steady-state process and is followed by carbon isotope fractionation (Park, & Epstein, 1960), it is clear that photosynthesis in global “atmosphere–hydrosphere–biosphere” system in geosynclynal period should result in depletion of inorganic carbon and its carbon isotope composition should be changed with depletion in accordance with so-called Rayleigh effect. In isotope chemistry this effect is well examined and described long ago (Brodsky, 1957). It establishes the links between carbon isotope composition of initial substrate (CO2), product (organic carbon, biomass) and residual substrate (unreacted CO2), depending on the extent of pool depletion. For “atmosphere-hydrosphere” system the dependence can be illustrated as follows: as far as pool depletion grows, the
Interaction of chemical and biological evolutions
11
residual CO2 gets enriched in 13C relative to initial substrate. In parallel the “living” matter and sedimentary organic matter accordingly, becomes “heavier” (enriched in 13C) too. Isotope fractionation and the above links are described by Rayleigh’s equation. But prior to present the equation we would like to remind of the aforementioned actualism principle applied to the indicated case. 1) The central metabolic pathways in cells of protobionts inhabiting in anoxic environments of Precambrian and in cells of organisms inhabiting in oxygenic environments of Phanerozoic in principle were the same as in cells of modern organisms under the similar conditions, while analogous metabolic processes were accompanied by the same isotope effects, at least by sign. 2) The carbon isotope composition of carbonates reflects isotope composition of coeval carbon dioxide in the atmosphere and that of organic matter reflects the isotope composition of coeval biomass. Now we can apply Rayleigh’s equation to describe carbon isotope fractionation in the natural inorganic carbon “atmosphere–hydrosphere” system:
Qt Q0 = ( R0 / Rt )
α
1−α
(7)
where Qo is the initial amount of inorganic carbon in the system by the end of orogenic period of the cycle; Qt is the amount of the residual inorganic substrate by the end of geosynclynal period (by the moment t) of the cycle; Qt Q0 ratio is the extent of pool depletion. Ro and Rt is carbon isotope ratio
(
13 12
С С
) in initial substrate and in residue accordingly; α is an effective
(average) coefficient of carbon isotope fractionation in photosynthesis. It is called “effective” since it describes the averaged isotope effect, characterizing photosynthesis as a whole, while under different natural conditions, characterized by different set of environmental parameters (temperature, moisture, water salinity, etc.), α varies. Using common δ*)-notation for carbon isotope composition the expression (7) may be presented as follows:
δ 13С 0 ⋅ 10 −3 + 1 α 1−α Qt Q0 = ( 13 ) δ С t ⋅ 10 −3 + 1
(8)
12
A.A.Ivlev
As it stems from expressions (7) and (8), at low extent of inorganic carbon pool depletion (< 10%), the difference in δ13C values between the initial and residual inorganic substrate can’t exceed a single coefficient of isotope enrichment equal to (α – 1). With increase of Qt Q0 ratio above 10% the isotope difference permanently grows. Hence up to the end of geosynclynal period the residual CO2 in the inorganic carbon pool will be most enriched in 13C as compared with what the initial substrate had by the end of orogenic period of the same cycle. ∗ ) It is adopted to express isotopic composition of samples via differential notation : 13
13 С С δ C(‰) = [( 12 )sample/( 12 )standard – 1 ] 1000 С С 13
The standard is carbon dioxide obtained from limestone from Pee Dee belemnite (PDB, Pee Dee formation in South Carolina, USA). Standard value 13
С С
( 12 )standard is 1,1237 × 10⁻⁵.(Craig, 1954). The samples, enriched in relative to standard, have positive δ13C values, those enriched in negative δ13C values.
13
C
12
C have
Figure 3. The curves describing the assumed changes of carbon isotope composition of atmospheric CO2 and that of organic matter in the course of orogenic cycle. Note that difference between two curves at the end of geosynclynal period of the cycle is lesser than the difference at the beginning of it (see the text).
Interaction of chemical and biological evolutions
13
In accordance with expressions (7) and (8), the effective coefficient of carbon isotope fractionation in photosynthesis remains constant during the orogenic cycle. Hence the isotopic differences between residual substrate (CO2) and product of photosynthesis reaction (organic matter, biomass) at the beginning and at the end the cycle should be the same (Melander, 1964). But, in fact, the coefficient of carbon isotope fractionation in photosynthesis doesn’t stay constant in the system because of photorespiration. In fact, as mentioned, the photorespiration has opposite sign of isotope effect, relative to CO2 assimilation. As a result, it leads to 13C accumulation in biomass. The photorespiration isotope effect becomes greater with the growth of oxygen concentration in the atmosphere (Ivlev, 1993). Hence by the end of geosynclynal period carbon isotope composition of “living”(organic) matter becomes enriched in 13C as compared with the beginning (Fig.3). As shown later, it is reflected in decreasing difference between δ13C values of coeval sedimentary carbonates and organic matter in interglacial/glacial transitions (Hayes et al., 1999). On Fig 3 the curves, schematically depicting the supposed changes of carbon isotope composition of the environmental CO2 and that of “living” matter in the course of orogenic cycles, are illustrated by the decrease of distance between the corresponding curves along Y-axis.
§ 6. The facts confirming the validity of the suggested model of evolution The powerful argument in favor of the suggested evolution model was its ability to connect and explain fragmentary and seemingly incoherent facts from different fields. For example, the part of the model, assuming plate collisions with participation of those ones bearing sedimentary carbonates, sulfates and organic matter, allows explaining, as shown before (Fig.1), the observed interconnection of carbon and sulfur cycles, that was expressed via synchronous changes of secular curves describing isotope composition of carbonate carbon and sulfate sulfur for the last 700 Ma years (Mackenzie & Piggott 1981; Berner, 1999). High occurrences of hydrogen sulfide in deep ocean waters up to the end of Precambrian (in the absence of marked oxygen content in the atmosphere), in combination with a wide spread of sulfideoxidizing bacteria at that time (Canfield & Teske 1996; Canfield, 1998) gave more evidences in favor of C and S cycles interaction. In addition, the biomass of these bacteria, according to Hayes and other’s assumption (Hayes et al., 1999), has become the main source of Precambrian organic matter. Carbon dioxide is one of the important greenhouse gases, determining the temperature on the Earth (Kothavala et al., 1999; Berner & Kothavala, 2001; Ivlev & Voronin, 2007). Therefore the highest level of CO2 content at
14
A.A.Ivlev
the orogenic period, stemming from the model, should lead to climate warming (greenhouse effect) whereas its decrease by the end of geosynclynal period should be followed by cooling (glaciations). Thus the model explains the existence of the climatic cycles observed by many researches (Fischer, 1981; Popp et al., 1989). Opposite to carbon dioxide, and coherent changes of atmospheric oxygen, stemming from photosynthesis reaction, are in compliance with the results of the numerous paleoatmospheric reconstructions made by independent researchers (Lenton, 2001; Berner & Kothavala, 2001; Igamberdiev & Lea, 2006) (Fig. 4). Hayes and co-workers (1999), having examined 5000 pairs of samples of marine organic matter and coeval carbonates in Neoproterozoic and Phanerosoic, have disclosed the regular decrease in the difference between δ13C of total organic carbon and that of carbonates (ε = δ13CTOC - δ13Ccarb) arising in transition from interglacial to glaciations. The authors also noticed that glaciations correspond to low CO2 level. This is what one can expect from the model. Indeed, orogenic period, when CO2 level in the atmosphere is high and O2 content is low, there should be warming period on the Earth. Low O2 content provides low photorespiration and hence “light” carbon isotope composition of biomass and organic matter in sediments. Vice versa the end of geosynclynal period, when CO2 level in the atmosphere is low and O2 content is high in the atmosphere, there should be cooling time on the Earth
Figure 4. Anti-phase changes of CO2 and O2 content in the Phanerozoic atmosphere. Replotted from Igamberdiev & Lea (2001).
Interaction of chemical and biological evolutions
15
(glaciations). High O2 concentration provides considerable contribution of photorespiration to biomass synthesis. As a result biomass and sedimentary organic matter become “heavy” (enriched in 13C). By this way the model explains the observed isotopic shift in carbon isotope composition of organic matter in glacial–interglacial transition found independently by different researchers. The same relationship in the late Phanerozoic was noticed by Huang and co-workers (Huang et al., 1999). It was manifested in relative abundance of C3 and C4 plants. In glaciations, characterizing by low CO2 and high O2 level, C4 plants, capable to assimilate from the environments with very low CO2 concentrations, were dominant and vice versa (Huang et al., 2001). Rothman has found correlation (Rothman, 2001) between biodiversity (the rate of the appearance of the new fauna and flora species under marine and terrestrial conditions per geological time unit, for instance, 1 Ma years) and differences in carbon isotope composition of coeval carbonates and organic matter (ε). He has revealed that an increase in the rate of biodiversity is associated with a decrease in isotopic differences (ε), i.e. at the periods of glaciations when photosynthesizing organisms had an intense photorespiration the rate of biodiversity increased. The explanation of Rothman’s correlation is in that participation of O2 in photorespiration is accompanied by formation of intermediate products – hydrogen peroxide and superoxide radicals that are particularly dangerous for the cell, since they are very active particles and attack genetic molecules causing mutations. In spite of the protective mechanisms in the cell (the presence of the catalase enzyme) that extinguish radicals by decreasing their concentration until the save level, they not always succeed with excess of the radicals, especially at the elevated oxygen concentrations, and then stress conditions stimulate mutations to appear (Raven 1991). This is also the cause for the numerous correlations of the biodiversity rate with the CO2 (or O2) content in the atmosphere (Igamberdiev & Lea, 2001; Cornette et al., 2002). Of the close meaning is the correlation indicating the periodicity of extinctions of species in geologic time (Raup et al., 1984; 1982). The possible explanation for these ones is in that at the transition from geosynclynal period of previous cycle to orogenic period of the next one the organisms adapted to oxygenic conditions achieved by the end of geosynclynal period, falling into anoxic conditions of orogenic cycle fail to adapt and die out. Let us summarized some features of the evolution model. 1) The convectional movement of magma generates the permanent escalatory movement of lithospheric plates. During this movement
16
A.A.Ivlev
neoformation of cortex occurs. Continental plates bearing sedimentary rocks move down and in subduction zone are adsorbed. Carbonates and organic matter of sedimentary rocks convert into CO2. It moves up to the Earth surface and then enters the atmosphere. The plate movement is irregular and produces orogenic cycles consisting of two periods orogenic and geosynclynal. Short-term orogenic periods of the orogenic cycles are characterized by intensive movement of plates forming Earth crust. During the orogenic period the inorganic carbon pool of “atmosphere–hydrosphere” system is filled with CO2 produced in subduction zones at the expense of destruction of sedimentary carbonates and conversion of organic matter into CO2. Filling the atmosphere with CO2 in orogenic period results in temperature growth on the Earth surface and finally to greenhouse effect. Oxygen concentration in the atmosphere falls down due to reduced material rising to the Earth surface with magma. High CO2 concentration stimulates photosynthesis. 2) In long-term geosynclynal periods high CO2 concentration stimulates photosynthesis to develop. The rate of photosynthesis exceeds the rate of CO2 entry into the global “atmosphere–hydrosphere–biosphere” system. As a result the depletion of inorganic carbon pool of atmosphere and hydrosphere occurs. The CO2 concentration in the atmosphere decreases whereas O2 concentration grows up. By the end of geosynclynal period the temperature on the Earth surface falls down and glaciations commences. In parallel with the O2 growth, in the atmosphere the equivalent amount of organic matter (in accordance with photosynthesis reaction) gets into sediments. 3) Photosynthesis is followed by carbon isotope fractionation in CO2 assimilation and in photorespiration. The isotope effects in these processes have opposite signs. Isotope fractionation in CO2 assimilation leads to 12C-enrichment of biomass (organic matter) relative to environmental CO2. Isotope fractionation in photorespiration leads to 13 C-enrichment of biomass. Therefore in orogenic period, when atmosphere and hydrosphere is filled with CO2 and is exhausted in O2, the total biomass and organic matter in sediments get enriched in 12C. In geosynclynal period while photosynthesis is developed, the pool of inorganic carbon is depleted and atmosphere is filled with O2. Photorespiration becomes more intensive. In the course of CO2 pool depletion, the residual CO2 in the pool and total biomass (sedimentary organic matter) get enriched in 13C in accordance with Rayleigh equation. Moreover, because of intensive photorespiration the difference in carbon isotope composition of organic matter and carbonates by the end of period becomes lesser. From cycle to cycle the average O2 concentration
Interaction of chemical and biological evolutions
17
grows up. Hence, the isotopic difference between sedimentary carbonate and organic carbon decreases from cycle to cycle. Two additional remarks to the model are needed. The decrease of CO2 content in the atmosphere some authors ascribe to weathering process: MeSiO3 + CO2 = MeCO3 + SiO2
(9)
A special stimulating role of weathering in CO2 sink is ascribed to development of terrestrial life (Lenton, 2001; Farquhar et al., 2011). This point of view is justified by the fact that, according to thermodynamics, at high partial pressures of CO2, existing in subduction zones, carbonates become thermodynamically less preferable as compared with silicates (Holland, 1965). On contrary, in the Earth surface conditions the reverse reaction is assumed to be more preferable (Berner, 1990; Mackenzie & Piggot, 1981). However the thermodynamic preference doesn’t mean its practical realization, because the latter depends on kinetics as well. Some arguments evidence in favor of the dominant role of photosynthesis in CO2 sink. In fact, the weathering mechanism fails to explain climatic cycles. It fails to explain the coupled anti-phase changes of CO2 and O2 concentration in the atmosphere. Since the weathering is not followed by carbon isotope fractionation weathering mechanism is unable to explain the coupled isotopic shifts of carbonate and organic matter carbon, the link of isotopic changes of secular curves of sulfate sulfur and carbonate carbon, etc. Therefore the reaction (9) may be considered only as a secondary additional way of CO2 sink enhancing inorganic pool depletion. The second remark concerns the question what limit oxygen accumulation in the atmosphere can attain. It is well known fact (Farquhar et al., 2011), that primitive atmosphere at first was anoxic. The oxygen accumulation has commenced since photosynthesis has appeared as a result of the reaction (6), where O2 was produced in stoichiometric ratio in respect to the second product of the reaction – organic matter. If the carbon cycle was a closed loop, i.e. all organic carbon, produced in photosynthesis, was entirely converted into CO2, oxygen accumulation in the atmosphere would not occur. Because of time needed for sedimentary organic carbon to reach subduction zone, till it will be converted into CO2, some of organic matter remains in sedimentary rocks. This portion determines the corresponding amount of oxygen preserved in the atmosphere. Thus the presence of the oxygen in the atmosphere is determined by the amount of organic matter accumulated in sedimentary rocks during the time needed for organic matter to get subduction zone after sedimentation.
18
A.A.Ivlev
Now imagine the following way of transformation of primitive anoxic atmosphere into oxygenic, corresponding to attainment of closed carbon cycle. A part of oxygen, produced in photosynthesis, is expended for photorespiration and organic carbon oxidation. The more oxygen is accumulated in the atmosphere, the more intensive the oxidative processes are. The coefficient of fossilization (a portion of organic matter which is buried) becomes lesser. With oxygen growth the global carbon of “atmosphere–hydrosphere–biosphere” system strives to the state where the amount of the assimilated carbon approaches the amount of the oxidized carbon. For an individual plant this state is called a compensation point. If this concept applied to the global system, this state is called an ecological compensation point (Igamberdiev & Lea, 2001). When this state is achieved, the extent of inorganic carbon depletion in the natural “atmosphere– hydrosphere” system sharply falls. The coefficient of fossilization approaches to 0. Most likely, it has happened in Phanerozoic after the conquest the land by plants. The amount of the atmospheric oxygen at this time has attained a relatively high value (about 25-30%). At the point of ecological compensation the system becomes a very sensitive to low amplitude changes of CO2 which may be caused by different factors, such as collisions of individual plates, by collisions of Earth with celestial bodies, like asteroids (Ahrens & Jahren, 2000; McElwain te al,1999), by volcanic eruptions, etc. Frequent changes of warming and icing periods also occur.
Interaction of chemical and biological evolutions
19
§ 7. Timing of photosynthesis origin according to carbon isotopic data To set up the timing of photosynthesis origin is a difficult task because of the practically full absence of the factual material. The only experimental information which may be used are the isotopic data. I mean carbon isotope composition of the ancient organic matter and coeval carbonates. In the logic construction we’ll rely on the earlier formulated actualism principle. Carbon dioxide, methane and other volatile components of volcanic eruptions (H2S, NH3, CO, etc.), lifting from the Earth’s interior to the surface, dissolved in ocean water and filled the primitive atmosphere. Using lightening and ultraviolet radiation as an energy source they interact and synthesize the simplest organic substances. According to Oparin’s concept, these organic substances formed in ocean water the primary bouillon which was used by the first protobionts as a source of nutrition and energy. Considering the low oxygen content in the Archean atmosphere, it was assumed that the first protobionts were anaerobic heterotrophes (Oparin, 1960; Fox & Dose, 1972). In this connection, carbon isotope composition of endogenous CO2 and CH4 are of particular interest, since they allow estimating carbon isotope composition of organic substances in the primary bouillon and finally isotope composition of the protobiont biomass as well as corresponding organic matter in sediments at that time. Taking into account that CO2 concentration in the atmosphere in the course of the Earth history can’t exceed the present concentration more than an order of magnitude (Rutten, 1971) and that carbonate forms amounts more than 95% of total carbon of the “atmosphere – hydrosphere” system (Garrels & Kraist, 1968), carbon isotope composition of juvenile CO2 may be approximately estimated from the balance calculations. It was found that carbon isotope composition of juvenile (endogenous) carbon dioxide lies in the limits from 0 to -2‰ (Ivlev, 1980). Carbon isotope composition of juvenile methane was determined from gaseous inclusions in igneous rocks and turned out to be in the limits from -3 to -13‰. Because of lack of data to find out carbon isotope ratio of organic substances in the primary bouillon, we concentrated our attention on the magnitude of carbon isotope effect observed in the experiments on abiogenic synthesis of organic substances. In the experiments of Dr. Chung*), who simulated abiogenic synthesis of organic substances from CH4, H2O and NH3 in electric charges, the difference between initial substrate and reaction products was in the range between 1 and 9‰. Significantly lesser effects (from 1 to 3‰) were observed
20
A.A.Ivlev
in the common technical syntheses of organic compounds (Yankwich & Promislev, 1953; Menshein et al., 1974; Rinaldi et al., 1974). We have adopted 10‰ as an upper meaning for carbon isotope fractionation in abiogenic synthesis of substrates. Then carbon isotope composition of the organic products, synthesized by abiogenic way, fall in the range from -10 to - 23‰. To estimate carbon isotope composition of protobionts’ biomass and to make imagination on isotopic composition of organic matter in ancient sediments, one should know carbon isotope fractionation in cells of protobionts. In compliance with an actualism principle, one should assume that the processes in protobionts’ cells are the same, as in cells of modern organisms in similar conditions. Therefore we shall examine the processes in protobionts, basing on our knowledge of processes in modern organisms. According to modern representations, heterotrophes, both aerobic and anaerobic, do not fractionate isotopes in assimilation of carbon substrates, but do this in glycolytic chain (Ivlev, 2008, 2012). Carbon isotope fractionation and 13C distribution in cells of anaerobic heterotrophes is investigated much worse than the same characteristics in aerobic heterotrophes. In spite of seeming differences in metabolism of these two groups of organisms, the principal pathways, associated with carbon isotope fractionation, are similar in both groups. It is glycolytic pathway (Embden – Meyerhof – Parnas pathway) ending with pyruvate formation. The terminal part of the pathway is different. In aerobic heterotrophes after decarboxylation of pyruvate the products are used for lipid component syntheses and/or enter Krebs cycle for protein syntheses and respiration. In anaerobic heterotrophes the pyruvate is subjected to decarboxylation and further to different transformations leading to various products (Fig.5). The terminal transformations of these pathways are followed by redistribution of redox states of the molecules and hardly can affect their carbon isotope composition. Anyway isotope effect in pyruvate decarboxylation in glycolytic chain of heterotrophes in both cases does not result in significant changes in carbon isotope composition of their biomass (De Niro, Epstein, 1978; Fry et al., 1978; Ivlev, 2008, 2012). In the experiments on carbon isotope fractionation in glucose fermentation there wasn’t observed any noticeable isotopic shifts between initial substrates and fermentation products – CO2 and alcohol (Abelson&Hoering, 1961; Hobbie&Werner, 2004). So, it may be adopted ______________________ ∗) Private
communication of Dr. Sh. Chung given in E. Galimov’s monograph (1981)
Interaction of chemical and biological evolutions
21
that carbon isotope composition of first protobionts’ biomass and corresponding organic matter fall in the range of δ13C from -10 to -23‰. While life has developed, the organic substances in the initial bouillon were depleted. The photosynthesis has appeared to solve this problem. It was a jump on the evolution curve, named aromorphosis (Shnoll, 1981). Carbon dioxide was abundant in Archean environment and organisms have learned to use it as a source of carbon for the biomass synthesis. Simultaneously sun light was used as a source of energy needed for assimilation. It is essential, that СО2 assimilation is accompanied by carbon isotope fractionation. Isotope effect emerging in CO2 fixation results in 12C accumulation in biomass as compared with environmental CO2. The enrichment of biomass with 12C is a characteristic trait of photosynthetic origin.
Figure 5. The biochemical schemes of glucose fermentation by different anaerobic bacteria from Clostridia class. a) C. acetobutilicum; b) C. pasteurianum.
22
A.A.Ivlev
Since there was no oxygen in Archean atmosphere at that period, the first photosynthetic protobionts had lack of photorespiration. Photorespiration is known to bring about 13C enrichment of biomass of modern organisms. Hence the biomass of protobionts deprived of photorespiration should have abnormally “light” carbon isotope composition. So considering the changes in carbon isotope composition of sedimentary organic matter one should see at first sharp increase in 12C content caused by photosynthesis appearance. After the peak there should be a trend, reflecting gradual accumulation 13C in organic matter from Archean to younger sediments caused by the growth of average O2 content in the atmosphere. Let us see now how this reasoning correlates with experimental data. The data concerning organic matter of very ancient rocks are scarce and fragmentary (Farquhar et al., 2011). It is known that carbon isotope composition of organic matter of the most ancient sedimentary Precambrian rocks (Archean, 3,3Ga, Swaziland series), not subjected to metamorphism, were found to be in the range from -14,7 to -19,5‰ (Oehler, et al., 1972). The absence of metamorphism is important, since it is commonly thought that deep transformation of organic matter at metamorphism may be followed by noticeable isotope shifts. Carbon isotope composition of some Archean carbonate rocks appeared in limits from-2 to -6‰, sometimes to -8‰ (Galimov et al., 1975), Taking into attention that organic matter of overlying younger sediments (3,1 – 2,6 Ga) was found to be significantly enriched in 12C and was characterized with δ13C values from -35 to -40‰ the previous data are of special interest. The jump in δ13C on average was shown to be equal to 12‰. The authors assumed that the jump is linked with photosynthesis origin at about 2,6 – 3,1 Ga years ago (Oehler, et al., 1972). Besides the jump in δ13C values of organic matter the available data indicate on the existence in Archaen of abnormally “light” carbonates. Such 12 C enrichment of carbonates can’t be explained by carbon isotope exchange between atmospheric CO2 and soluble carbonate forms, considering the known values of carbon isotope fractionation coefficients (Thode et al., 1965). But it can be easily explained by the contribution of “light” CO2 formed in oxidation of organic matter synthesized by abiogenic and/or by heterotrophic ways. The isotopic evidences in favor of the photosynthesis origin in the indicated period was supported by paleontological arguments (Smith et al., 1970, 1971; Shopf et al., 1971). According to these data, the early life, was mainly represented by photosynthetic blue-green alga (more than 80%). They were prokaryotic organisms capable of CO2 assimilation and O2 evolution.
Interaction of chemical and biological evolutions
23
The history of atmospheric oxygen at the first stages of photosynthesis evolution can be easily reconstructed due to physical constraints imposed by water photodissociation and by anaerobic fermentation. Water splitting under UV-irradiation could provide oxygen content in the Archean atmosphere that couldn’t exceed more than 0,001 of present content (Urey’s level). In anaerobic fermentation oxygen level couldn’t rise up more than 0,01 (Pasteur’s level) of present level (Rutten, 1971). Only aftermath it appeared in the atmosphere as free oxygen (Farquhar et al., 2011). Geological evidence in favor of these changes in the atmosphere is the co-existence in early and middle Archean, besides unoxidized pyrite sands, partially oxidized iron banded formations (Soyden, 2,7 Ga) (Rutten, 1971).
§ 8. The origin of photorespiration – new aromorphosis in biological evolution. Its consequences. Ecological compensation point The appearance of free oxygen in the atmosphere brought about a variety of important and serious consequences for the evolution. One of them was the transition from anaerobic life to aerobic. It means organisms have learned how to get energy from oxidation of substrates using free oxygen, what gave them possibility to substitute fermentation for respiration. The first process is much more effective than the latter. This way provided for photosynthesizing aerobic organisms a lot of advantages as compared with the anaerobic ones. What the advantages are? Oxygen is known to be a poison for the organisms that inhabit in anoxic environment. Photosynthesizing organisms learned to use O2 as a substrate to supply the carboxylation reaction with the additional amount of CO2 in case when the capacity of the reaction was not enough to maintain Calvin cycle work. For this aim Rubisco, besides carboxylase function, has acquired additional oxygenase function. It was especially important in the conditions of strong sunlight intensity in Archean atmosphere because of great amount of light quantum absorbed. Another important role of the photorespiration consisted in providing the reducing force (NADP-H) and ATP for RuBP and other photorespiratory metabolites synthesis. Since CO2 assimilation and photorespiration have opposite impact on the common “crossing point” of enzyme (Rubisco), it has become possible to regulate photosynthesis by means of feedback. The severe stress conditions at that time made protobionts to develop such mechanism of stress stability to survive. Further on the basis of the photorespiration the mechanism of stress resistance in modern photosynthesizing organisms has been developed.
24
A.A.Ivlev
These and other advantages acquired by photosynthesizing organisms with photorespiration are considered thoroughly in the works of Andre (2011a,b) and Igamberdiev & Roussel (2011). The coupling of CO2 assimilation and photorespiration resulted in formation of a special mechanism of reciprocal interaction between CO2 assimilation and photorespiration. As a result, СО2 assimilation has become discrete (Ivlev, 1989) and photosynthesis has turned into the oscillatory process consisting of two alternating phases - CO2 assimilation and photorespiration. Thus prototype of temporal organization of photosynthesis in modern organisms has appeared. Since the key reaction of photorespiration metabolism – glycine decarboxylation was followed by carbon isotope effect, its coupling with the isotope effect of RuBP-carboxylation in CO2 assimilation led to emergence of the mechanism of carbon isotope fractionation in photosynthesis similar to that in modern organisms. Carbon isotope effect of CO2 assimilation resulted in 12C enrichment of biomass was bound to RuBP carboxylation, whereas that of photorespiration resulted in 13C enrichment of biomass was bound to glycine decarboxylation. Carbon isotope composition of the total biomass was depended on the contribution of both processes. The contribution of each process depended on CO2/O2 concentration ratio in the environment.
Figure 6. Change of carbon isotope composition of the organic matter of sedimentary rocks as function of geological time (Garrels, 1975). Vertical bars – limits of δ13C deviations from the average (‰), horizontal bars – time intervals (Ga years). The average value for the Paleozoic organic matter is -26‰.
Interaction of chemical and biological evolutions
25
It is evident that sedimentary organic matter has inherited the corresponding carbon isotope composition of total biomass of “living” matter after its burial. The intensity of photorespiration depended on O2 content in the atmosphere. While photosynthesis has developed and O2 concentration in the atmosphere increased, the photorespiration contribution into biomass became greater. Hence total carbon of “living” matter has accumulated 13C, and organic matter in sediments gets enriched in 13C too. Garrels (1975) has noticed this decrease (Fig. 6). It allows estimating the timing of photorespiration origin as about 2 Ga. More exact estimates were given in the work of Farquhar et al. (2011). Summarizing geologic, isotopic, and transition element data on the rise of atmospheric oxygen and the origin of oxygenic photosynthesis they concluded that appearance of free oxygen in the atmosphere, termed the Great Oxidation Event (GOE), occurred between 2,45 and 2,32 Ga. This is in compliance with the above Garrels’ estimate. One more global consequence associated with photorespiration emergence should be underlined. The thing is that CO2 photoassimilation and photorespiration are alternative processes. With the photorespiration rise the biosphere system began to move spontaneously in direction of state where further development of life becomes impossible. It corresponds to the ecological compensation point, where the rate of CO2 photoassimilation is equal to the rate of photorespiration. At this point CO2 and O2 concentration become relatively stable. For the individual photosynthesizing organism (plant) it can be explained by means of the concept of CO2 compensation point. The point is determined as the CO2 concentration, when the rate of CO2 photoassimilation is equal to CO2 evolution at respiration and photorespiration. The leaf respiration can be ignored since it doesn’t exceed 5% of assimilation then only photorespiration should be considered (Igamberdiev & Lea, 2006). If apply these concept to biosphere as a whole the real ecological compensation point should be higher because of the necessity to take into account photosynthetic and respiration costs for maintenance, growth and productivity. According to estimate of Sage and Coleman (2000) it equals to 180 ppm approximately depending on temperature, irradiance, humidity, etc. Respiration of plants and non-plants organisms can also impact on the ecological compensation point. Below the ecological compensation point (at the O2 value 21%) plants are unable to complete their life cycle. Tolbert et al. (1995) has introduced the definition of O2 compensation point. It is concentration of O2 at a constant concentration of CO2, when the assimilation and evolution of CO2 are equal. Combining these two definitions Igamberdiev and Lea (2006) have introduced the compensation ratio as O2/ CO2 concentration ratio in the compensation point and found its value.
26
A.A.Ivlev
Applying this concept to biosphere, Igamberdiev and Lea (2006) defined the ecological compensation point for biosphere as a state when amount of CO2, assimilated by biosphere in photosynthesis and in other CO2-consuming processes, becomes equal to amount of CO2, produced by all organisms evolving CO2 and by all oxidative processes. As it follows from the existence of the ecological compensation point, atmospheric CO2 concentration can not be below the concentration in that point. As well as O2 concentration can’t overcome the level corresponding to CO2 compensation point. After filling with CO2 “atmosphere-hydrosphere” system in orogenic period, owing to photosynthesis biosphere spontaneously moves to ecological compensation point defined by physiological surviving parameters (Jahren et al., 2008). It reminds the movement of chemical system to equilibrium determined by thermodynamics. Orogenic events of the next cycle interrupt the biosphere movement to ecological compensation point. But afterwards the land was conquered by plants and O2 concentration reached 25% and even higher, the ecological compensation point was most likely achieved. The global “atmosphere– hydrosphere–biosphere” system became unstable and sensitive to casual bursts of CO2. Short-term oscillations, mentioned before (§ 8), have begun. The period of these oscillations is about ten – hundred thousands years. Only for the last million years it was noticed several periods of glaciations alternating by periods of warming (greenhouse effect) (Huang et al., 1999; 2001). Concluding this section, let’s try to give one more definition of ecological compensation point from the position of interaction of photosynthesis and geological processes in global carbon cycle. It was said that oxygen in the atmosphere appeared as a result of photosynthesis reaction. While its content increased in the atmosphere, the equivalent amount of organic matter entered the sediments. Oxygen content has been increasing till the moment when sedimentary organic matter reached the subduction zone and was transformed into CO2, in accordance with aforementioned reactions (see §4). This moment corresponds to ecological compensation point. Thus O2 concentration is determined by existence timing of organic matter in sediments. By the other words the amount of oxygen in the atmosphere is determined by the capacity of sedimentary rocks to accept organic matter at a given rate of plate movement and other factors influencing on organic matter sedimentation and accumulation.
Interaction of chemical and biological evolutions
27
§ 9. Data on carbon isotope composition of carbonates and sedimentary organic matter evidencing in favor of jump-like character of photosynthesis evolution in Precambrian Studies on carbon isotope composition of sedimentary carbonates and organic matter give more arguments in favor jump-like character of photosynthesis evolution. According to the evolution model, long-term depletion of inorganic carbon in “atmosphere – hydrosphere” system during geosynclynal period is followed by Rayleigh effect which strengthens greatly isotopic shifts. They are especially substantial if samples of carbonates and organic matter relates to transition from geosynclynal period of the previous cycle to orogenic period of the next one. To make certain, let’s examine available geological material. Note, that comparison of carbonates and organic matter samples should be done for identical environmental conditions (for similar facial conditions). Jump-like changes of carbon isotope composition in Precambrian carbonates, gravitating towards periods of orogenesis, were noted by Galimov et al. (1975). Maximal δ13C values reached +9‰. The others researchers (Sidorenko & Borcshevsky, 1977) gave the values reaching +15‰. None of the existing hypothesis of sedimentary or juvenile origin of carbonates was able to explain such “heavy” carbonates using the known isotope fractionation coefficients for “carbon dioxide – carbonate” system (Thode et al., 1965). Maximal values that can be achieved applying sedimentary hypothesis do not exceed +5‰, even assuming that CO2 is dominant species in the natural chemical exchange “CO2-carbonate” system (Ivlev, 1986). The hypothesis of juvenile origin of carbonates, assuming δ13C values for juvenile carbon are in the range from 0 to -2‰ (see § 8), also failed to explain “heavy” isotope composition of carbonates. The way to overcome this deadlock is to accept the evolution model, assuming inorganic carbon depletion in the global “atmosphere-hydrosphere” system, which is followed by Rayleigh effect. This effect can explain the observed 13C-enrichment of the residual carbon forms. As shown, the 13Cenrichment depends on the extent of pool depletion. The tendency of “heavy” carbonates to periods of orogenesis the model links with their formation at the end of geosynclynal period, when the extent of pool depletion is maximal. Hypothesis of metamorphic origin of carbonates, suggesting that carbon source for carbonates genesisis is CO2, produced in the granitization process (according to equation 3), also can explain the tendency of carbonates to orogenic periods (Galimov et al., 1975), but it fails to explain the observed δ13C values for “heavy” carbonates.
28
A.A.Ivlev
A jump-like character of carbon isotope composition is observed for organic matter in Precambrian as well, but its tendency to orogenic periods is not so evident. It is not surprising since the binding of organic matter to facies made by authors (Smith et al., 1971; Oehler et al., 1972) often wasn’t very strict (Fig.7). It is clear that averaged facial conditions can greatly impact on carbon isotope composition. It may explain why the tendency for orogenic periods in this case is weaker though somewhat remained.
Figure 7. Carbon isotope composition variations in Precambrian (Smith et al., 1971; Oehler et al., 1972). The filled triangles on X – axis denotes the known orogenic periods.
The strongest evidence in favor of the model is the existence of correlation between the difference in carbon isotope composition of organic matter and that of co-existing carbonates from one side and climatic changes from the other (Hayes et al., 1999) (see §6). This regularity has been disclosed in Proterozoic and Phanerozoic and was confirmed by many investigators (Cowling & Sykes, 1999; Huang et al, 1999, 2001; Ratnayake et al., 2006). It shows that revealed regularity has common and objective character.
§ 10. Stratigraphic distribution of organic matter in source rocks and genetically related oils are in conformity with the evolution model predictions made on the basis of carbon isotope composition Hereinafter, using available geological records and results of paleoenvironmental reconstructions we’ll substantiate the key links, connecting CO2 and O2 concentrations with surface temperature of the Earth (climatic changes) and organic matter accumulation in sediments, stemming from the evolution model. All these links are the consequence of
Interaction of chemical and biological evolutions
29
photosynthesis reaction (16), and hence their confirmation by natural observations supports the validity of the model itself. The material of this paragraph may be interesting not only to biologists who study evolution, but to organic geochemists and petroleum geologists, since it concerns the problem of organic matter accumulation and ultimately source rock and oil fields formation in the course of geological time. Two related questions are considered: 1) what is the reason for uneven stratigraphic distribution of source rocks and oils and 2) when the first industrial oil fields might be formed. So we should investigate the following natural chain of transformation: photosynthesis → “living” matter → sedimentary organic matter → petroleum. According to the evolution model, “living” matter in the chain is the principal source for the whole sedimentary organic matter on the Earth. Vernadsky (1926), who introduced the term, considered the “living” matter, consisting of two parts - autotrophic (predominantly photosynthetic) and heterotrophic. Since carbon source for heterotrophic biomass synthesis is presented by photosynthetic production (food chains), the “living” matter as a whole may be regarded to be of photosynthetic origin. Moreover, carbon isotope composition of “living” matter is determined by isotope composition of photosynthetic production, i.e. by primary producer and by environmental conditions under which photosynthesis occurs. The analysis of photosynthesis reaction (16) in the course of orogenic cycle allows determining the intervals on geological time scale of intensive accumulation of organic matter in sediments. Since intensive accumulation of organic matter is suitable for oil fields formation, it is possible to define intervals on stratigraphic scale characterized with high probability of source rock formation. These periods may be compared then with the real distribution of organic matter and oils in sediments found by independent researchers. In fact, as said before, photosynthesis reaction establishes reciprocal dependence between reaction substrate CO2 and reaction products: O2 and biomass. According to chemical kinetics, the time of intensive accumulation of organic matter, should coincide with the time of low CO2 concentration and high O2 concentration in the atmosphere (Fig.8). Since CO2 is the main ”greenhouse” gas it means that geosynclynal period should correspond to cooling period (‘icehouse” time, glaciations). To find natural traces of intensive and long oxidation as well as glaciations in the geological past is a relatively simple task (Farquhar et al., 2011). Thus we can regard high oxygen concentration in the atmosphere and cooling periods as the traits of intensive organic matter accumulation in sediments.
30
A.A.Ivlev
Many researchers paid attention to the fact that stratigraphic distribution of organic matter in sedimentary rocks is irregular as well as the inclination of oil fields to source rocks of a certain age (Maksimov et al., 1977; Tissot & Welte, 1978; Hunt, 1982). Many of researchers subconsciously felt that the irregular distribution is bound to biosphere development but the suggested evolution model makes it possible to explain the reason for such distribution. Following the model’s logic, strong glaciations and epochs of the increased O2 content should correspond to the end of geosynclynal periods of orogenic cycles. Hence this timing should be associated with intensive source rock formation.
Figure 8. Atmospheric oxygen changes and organic matter burial in Phanerozoic reconstructed according to sedimentological data. Replotted from Berner & Canfield (1989).
Interaction of chemical and biological evolutions
31
The revealed periods of glaciations and high oxygen concentration in the atmosphere are in good correlations with Domanic Formations distribution. These Formations are high potential source rocks rich in organic matter. They spread in Precambrian as well as in each Phanerozoic system. These sedimentary rocks are traced at different continents and practically on the same stratigraphic levels. According to Bazhenova’ and Sokolov’s data (2002), periods of the Domanic source rocks formation fall on frontier of Vendian and Cambrian, at the end of Devonian – beginning of Carboniferous and at the end of Jurassic – beginning of Cretaceous. These intervals correlate well with the known periods of glaciations and of high O2 concentration (Hayes et al., 1999; Igamberdiev & Lea 2006). The explanation is that by the end of geosynclynal period of orogenic cycle most of the initial CO2, filled “atmosphere – hydrosphere” system in orogenic period, has converted into organic matter. We have listed bellow the known from the literature orogenic cycles, beginning with Penokean cycle, indicating corresponding geological periods composing them. Penokean cycle 1750 – 1000 Ma (Rephean) Grenville cycle 1000 – 570 Ma (Vendian) Unknown 570 – 350 Ma (Paleozoic era: Cambrian, Ordovician,Silurian, Devonian) Caledonian cycle 350 – 250 Ma (Carboniferous, Permian) Hercinian cycle 250 – 65 (Mezozoic: Triassic, Yurassic, Cretaceous) Alpian cycle 65 – 10 (Cenozoic is divided to 7 epoch: Palaeocene, Eocene, Oligocene, Miocene, Pliocene, Pleistocene, and Holocene) The only cycle that we haven’t found in the literature, denoted as unknown, should correspond to the interval 570 – 350 Ma. We can substantiate the existence of this cycle by the following. Hayes et al. (1999) have found glaciations traits at 570 Ma. Taking into account the accuracy of geological time determination it may be interpreted as frontier between the Grenville (Katangian) cycle and the onset of the next one. We suppose the cycle has completed in Devonian, since according to Bazhenova and Sokolov (2002) formation of Domanic source rocks has been completed in Devonian. In agreement with the above said it should be cooling period. It is also interesting to find out if there is conformity between the terminal parts of the orogenic cycles, characterized by high oxygen concentration in the atmosphere and formation of sediments rich in organic matter, with the studied stratigraphic distribution of source rocks and oil fields.
32
A.A.Ivlev
Having compared the stratigraphic distribution of oil fields, it is necessary to keep in mind that 1) 2)
3)
age of oils doesn’t not always correspond to the age of reservoir rock, since, migrating from source rocks, oils may accumulate in reservoirs whose age is different from that of the source rock; comparing organic matter with related oils, it is necessary to make certain they are syngenetic, i.e. oils and organic matter should have common origin, besides organic matter accumulation and source rock formation should occur simultaneously; the evolution model gives possibility to define optimal time for source rock and oil field formation, but it is unable to indicate the “oil kitchen” locations or migration pathways; it’s a special question for geologist.
So the first question is: since what moment oil fields appear or when did source rocks become capable to generate oil? Another question, which is close to the previous: to what concentration of oxygen in the atmosphere does oil appearance correspond? Some estimates of oxygen concentration in the atmosphere show that in late Proterozoic era (in Rephean and Vendian) O2 content has achieved several percent 2-3% (Bjerrum & Canifield, 2004; Igamberdiev & Lea, 2006, Farquhar et al., 2011). It was the very time when first industrial oil fields have been discovered (Vishemirskyi & Kontorovich 1997; Dakhnova et al., 2011). Oil fields related to Rephean - Vendian sedimentary rocks were revealed in different regions of the world including Siberia, Oman, Pakistan and others (Vishemirskyi & Kontorovich, 1997). Moreover data of Bazhenova and Sokolov (2002), mentioned before, have shown that Domanic source rocks in Vendian have already existed. Bearing in mind that oils commonly do not exceed some percent of organic matter, it is reasonable to assume that in Rephean and Vendian organic matter has accumulated in sedimentary rocks in amount sufficient to generate oil fields. In reply to second question note, that till the middle Proterozoic (2,2 – 2,0 Ga) the average O2 concentration in the atmosphere didn’t rise above 0,08 – 0,1%. Then it increased to about 0,2% (Rye & Holland, 1998). Such low O2 concentrations in the atmosphere allows thinking that organic matter accumulated in sediments was not capable to generate considerable amounts of hydrocarbons needed to form oil fields. Thus it is possible to conclude that in Proterozoic era the oil field formation has begun in Riphean and Vendian. The most optimal time for this process were cooling periods. As said before, Hayes and others (1999) has
Interaction of chemical and biological evolutions
33
revealed traces of glaciations in Rephean at 740-720 Ma and in Vendian at 575 Ma. In Phanerozoic there were four orogenic cycles (see above). In accordance with the model, there should be four “waves” of oil generation. In the first cycle, denoted as “unknown”, the period of oil generation, according to the traits, comprises Silurian and a part of Devonian (420 -390 Ma) (Berner & Canfield, 1989; Popp et al., 1989). The O2 content in the atmosphere has grown up to the level 12% on average (Igamberdiev & Lee, 2006). It is also confirmed by the emergence of first land plants, which intensify oxygen production. Caledonian orogenic cycle commenced in late Devonian. Peak of oil generation falls on Carboniferous and Permian. It is a time of land colonization and rapid increase of land photosynthsis. O2 concentration reached 25%. Upper level, according to some estimates, reached 35% (Wildman et al., 2004). Hercinean cycle (380 – 280Ma) led to greater land development. Its terminal part related to Yurassic and Cretaceous. Decreased O2 concentration has increased again up to high level and caused new wave of oil generation. Because of high average atmospheric oxygen concentration the “biosphere– atmosphere–hydrosphere” system has approached to the point of ecological compensation. The system became sensitive to СО2 bursts caused by collisions of separate plates or other reasons. It became the probable reason of that frequency of cycles appearence has increased, and their duration has decreased. The last “wave” of oil generation occurred in terminal part of Alpine cycle. Maximum of O2 concentration (about 25%) was related to Miocene. Isotopic data indicates that it was glaciations at that period (Popp et al., 1989). The coherence between evolution model predictions of the oil generation timing and studied stratigraphic oil fields distribution is presented on Fig.9a,b. Relatively good coherence supports the prognosis made on the basis of evolution model. More evidence in favor of the model provides the data, obtained by Andrusevich et al. (1998), who compared carbon isotope compositions of the saturated and aromatic hydrocarbon fractions from 514 crude oils representing 13 age divisions from Proterozoic to Neogene (Fig. 10). This statistically significant material allowed revealing that 13C content of both fractions increases episodically with decreasing age (indicated by arrows on Fig.10). Figure 10 shows only saturated hydrocarbon data, but it undoubtedly refers to crude oils as well. The authors couldn’t explain the reasons for this
34
A.A.Ivlev
Figure 9. Comparison of distribution of explored extractable oil deposits in the largest 44 world reservoirs (Vishemirskyi & Kontorovich, 1997) (a) and of revealed oil deposits (% of the total number of deposits) in the oilfields of the former USSR (Korchagin, 2001) (b) with stratigraphic subdivisions.
general trend. But within the frame of the evolution model we can do it. The successive 13C enrichment of the oils Precambrian – Cambrian –34,8; Ordovician – Triassic, -29,9; Jurassic – Palogene, -28,0; Neogene -21,8 is observed, since from one orogenic cycle to another the average atmospheric O2 concentration increases. Accordingly the photorespiration contribution to biomass synthesis increases with decreasing age causing corresponding 13C enrichment of organic matter in sedimentary rocks and oils, including fractions. In addition the indicated episodes of isotopic shifts conform well to the designated orogenic cycles.
Interaction of chemical and biological evolutions
35
Figure 10. Change of the average carbon isotope composition (δ13C, ‰) for saturate fraction C15+ of crude oils. Vertical bars are standard deviations, which increase with decreasing age. Arrows indicate Cambrian – Ordovician, Triassic – Jurassic, and Paleogene - Neogene boundaries where 13C enrichment occurs. Replotted from Peters et al., 2007.
Note, the same reason causes a regular decrease of the difference between isotopic ratio of carbonates and organic matter of the same age and facies from one orogenic cycle to another (see §5), established by Hayes et al. (1999). Fig. 10 discloses one more interesting detail. The range of δ13C variations for oils becomes wider from cycle to cycle beginning with Silurian. We explain it by land colonization which led to diversification of ecological situation and widened the range of isotopic variations. By the other words, to typical marine organic matter the admixture of terrestrial organic matter was added. Thus the findings of Andrusevich et al. (1998) give more arguments in favor of the established link between orogenic cycles, oils formation and their carbon isotope composition changing in time.
§ 11. The correlations caused by interaction of the processes in the Earth’s crust and in the “atmosphere – hydrosphere – biosphere” system during geological time The evolution model under study connects the processes occurring in the Earth crust with the processes on the Earth surface in the “atmosphere –
36
A.A.Ivlev
hydrosphere – biosphere” system. As a result the components of both systems turned to be interconnected with each other and their changes generate various correlations, which may be used to prove the validity of the model itself, to trace and study evolution. Many of the correlations were experimentally established by different researchers (e.g., Mackenzie and Piggot, 1981; Hayes et al., 1999, Jahren et al., 2008; etc.), but until now have no adequate explanation. The suggested evolution model provide new basis for interpretation. Some of them will be considered below. We have mentioned already the relationship between carbon and sulfur cycles appearing due to reduction/oxidation interaction of both cycles. In zone of plate collisions organic carbon reduces sedimentary sulfates converting them into H2S and derivatives. The interaction generates correlation between carbon and sulfur isotope characteristics (see Fig.1). Free oxygen content in the atmosphere is linked with the amount of organic matter in sediments. Using carbon and sulfur cycles interaction, it is possible to deduce O2 concentration from the link between sulfide sulfur and organic carbon. Oxygen concentration may be also obtained from carbon and sulfur isotope composition in the same rocks (Berner et al, 2000). Close proximity in O2 evolution curves was found by both ways (Fig. 11). The evolution model is able to explain the physical sense and proximity of the above correlations.
Figure 11. The dependence of O2 concentration in the atmosphere in Phanerozoic, calculated on the basis of isotopic balance C and S (Berner et al., 2000) and using the data on organic matter and pyrite sulfur abundances (Berner, Canfield, 1989). Replotted from (Berner et al, 2000).
Interaction of chemical and biological evolutions
37
In fact, the increased O2 content in the atmosphere by the end of orogenic cycle is followed by intensive accumulation of organic carbon in sedimentary rocks. As compared with organic carbon produced at the beginning of cycle it, being produced at the end, is enriched in 13C because of the greater contribution of photorespiration to biomass synthesis, stimulated by oxygen growth in the atmosphere. In anaerobic zone of sediments, where microbial sulfate reduction occurs, organic matter participates as a reductant. The process is followed by sulfur isotope effect resulting in 32S enrichment of the reduced sulfur forms relative to sulfates (Krouse, Ueda, 1987; Thode et al., 1960, 1961). Without access of sulfates and organic matter from the above layers sulfur fractionation occurs as in a “closed” system and is followed by Rayleigh effect (effect of substrate pool depletion) (Gautier, 1987; Thode et al., 1960, 1961). In this case the more sulfate pool is depleted, the lesser accumulation of 32 S in sulfides occurs, i.e. 34S enrichment increases. Hence, the more organic matter falls into sediments, the deeper conversion of sulfates into sulfides occurs, causing accumulation of 34S in forming sulfides. Finally, the more oxygen is in the atmosphere, the “heavier” carbon isotope composition (13C enrichment) of organic matter in sediments, and the greater 34S accumulation in sulfides. Having carried out balance calculations Berner et al (2000) have received maximum of O2 concentration in Permian atmosphere (≈ 280 Ma) equal to 35%, which coincided with the independent estimates given by other researchers (Lenton, 2001; Igamberdiev & Lee, 2006). Besides climatic cycles and periodic intensity of organic matter accumulation in sediments, some additional correlations, caused by the regular and reciprocal changes of CO2 and O2 concentrations (or by cyclic variations of CO2/O2 ratio) in the atmosphere, should be considered. One of them the regularity between the rate of biodiversity and the level of atmospheric CO2 (Cornette, 2002). Raup (1976a,b) has demonstrated striking similarity in variations of species diversity to the distribution patterns observed for preserved sedimentary rock area volume. Raup argued that estimated numbers of fossil species strongly depend on measures of the amount of rock available for study. Rothman (2001) revealed correlation between diversity vs isotopic differences between the carbonates and organic carbon (ε, see §6). He has found an increase in the rate of the new species emergence with decrease of ε. By the other words, the increase was observed at periods of glaciations when photosynthesizing organisms had a high photorespiration level.
38
A.A.Ivlev
Figure 12. The correlation between biodiversity rate and the variations of CO2 and O2 content in the atmosphere in the course of geological time. The temporal changes (Igamberdiev & Lee, 2006) of the CO2/O2 ratio in the atmosphere, which was based on the model GEOCARB III (Berner & Kothavala, 2001b) in Phanerozoic (1), ratio of carboxylase and oxygenase activities with taking into account temperature (2) and the number of terrestrial plants appearing at the Phanerozoic (3). Replotted from Igamberdiev & Lea (2001).
The correlation of the biodiversity rate for marine fauna with CO2 content in the atmosphere has the analogous nature. The high strength of correlation suggests that environmental variables controlling CO2 levels have had a profound impact on evolution throughout the history of metazoan life. The impact of O2 was manifested less distinctively because of low O2 solubility in water, since even significant CO2 changes in the atmosphere are followed by weak changes in O2 content (Cornette et al., 2002). Much more expressive correlation was observed, if to receive as a parameter O2/CO2 ratio (Igamberdiev, Lee, 2006) (Fig. 12), especially effective ratio O2/CO2 (or Vo/Vc) (oxygenase to carboxylase activity ratio for Rubisco in photosynthesizing organisms). With the increase of O2/CO2 (Vo/Vc) ratio, what takes place in periods with high O2 concentration, the rate of biodiversity increases. On contrary, the decrease of the indicated ratio is followed by disappearance of the plant families (Zavaleta et al., 2001, 2003; Shaw et al., 2002; Raup & Sepkoski, 1982, 1984). Of the close meaning is the correlation connecting the rate of disappearance of species with CO2 (of O2) content in the atmosphere (Cornette et al., 2002). This can be explained by that at the orogenic periods at a sharp rise of the CO2 concentration the organisms, adapted to the aerobic environment of the geosynclynal period, can’t stand it and die.
Interaction of chemical and biological evolutions
39
Another type of correlations connects CO2/O2 ratio in the atmosphere with the number of stomata on the leaf surface of vascular plants (Greenwood at al., 2003; Hetherington, Woodward, 2003). It was found that stomatal density is a function of CO2 partial pressure in the atmosphere. Changing the number of stomata on the leaf surface, plants regulate partial CO2 pressure inside the leaf, maintaining it at a permanent and optimal level for assimilation in cells. Using this correlation a paleobotanical technique of measuring CO2 partial pressure in the geological past has been worked out (Osborne, Chaloner, 2001; Retallack, 2001). It uses feedback connection between stomatal index (the number of stomata on the fossilized leaf surface unit) and partial CO2 pressure in the atmosphere. The ability of terrestrial vascular plants to maintain stable CO2 assimilation conditions in cells (CO2/O2 ratio) determines relatively stable carbon isotope composition of total biomass and its weak dependence on CO2 concentration in the atmosphere. It was confirmed in the experiments on Raphanus sativus L. in growth chambers under controlled conditions. The change of partial CO2 by 3 times practically does not impact on carbon isotope composition of above-ground and root parts of the plant (Yahren, et al., 2008). This ability of terrestrial plants is a likely reason for striking carbon isotope stability of peats and coals of different age and its proximity to isotope composition of contemporary trees (Galimov, 1968). Opposite to coal, carbon isotope composition of oils varies notably with age (Eremenko et al., 1974). This supports the idea that the main carbon source for sedimentary organic carbon providing oil formation was planktonic material (Uspenskii, 1970). Sometimes it is important to define the oxidative states of global “atmosphere– hydrosphere–biosphere“ system. It may be done by means of different traits. Some of them allow identification of the states with high O2 level basing on the findings that high O2 concentration stimulates the emergence of gigantic insects, dragonflies in particular (Berner et al., 2000; Wildman et al., 2004). It is known fact that high O2 concentrations promote fires and the traces of intensive fires can be easily marked (Berner et al., 2000). Another trait of fire is a finding in the tree remnants a sign of special anti-fire morphology that characterize trees of that period (Igamberdiev & Lee, 2006). The other traits of oxygenic states were described in the works of Rutten (1978), Flint (1978) and Farquhar et al. (2011). The chemical trait of high CO2 concentration in the atmosphere is a weak carbonates deposition (Mackenzie & Pigott, 1981). The latter occurs due to chemical reaction MeCO3sediment + CO2 + H2O ↔ Me(HCO3)2solution
40
A.A.Ivlev
It means that at high partial pressures of CO2 the equilibrium in the above reaction shifts in direction of soluble bicarbonates. Geologic correlations compose a separate group which is bound to global processes in the Earth’s crust. They are interconnected variables, synchronically changing in the course of geological time. Some examples of such correlations are presented on Fig. 13. Two curves (Fig. 13 a,b) presenting variations of the reduced (organic) C/total (organic+carbonate) C ratio vs geological time and reduced S (pyrite) / total (pyrite+sulfates) S ratio vs geological time reflect interaction of carbon and sulfur cycles. As it shown from Fig. 13a,b, anti-phase variations of both curve evidence in favor of cycles coupling. The evolution model explains anti-phase dynamics of the studied variables by the same manner as anti-phase changes of CO2 and O2. They are linked as substrate and product of chemical reaction. The curve on Fig.13c illustrates the variations of tectonic plate movement in Phanerozoic in the course of geologic time. The curve on Fig.13d illustrates coupled variations of mid-ocean ridge volume and sea level with geological time.
Figure 13. Phanerozoic variables. A, variations in the ratio of carbon in organic matter to total (organic + carbonate) carbon in sedimentary rocks. B, variations in the ratio of sulfur of pyrite to total (pyrite + sulfates) sulfur. C, distribution of Period average for sedimentary rock mass preserved (Garrels & Mackenzie, 1971). Major times of continental collision and active rifting are indicated. D, generalized sea level curve from Vail et al. (1977). Major times of large ridge volume (LRV) and small ridge volume (SRV) are indicated.
Interaction of chemical and biological evolutions
41
The model explains these correlations as follows. The changes in sea level are bound in turn to the variations CO2/O2 ratio in the atmosphere. When the ratio is low, the cooling period commences on the Earth. The latter comes to end with glaciations. At high latitudes and in most cold points of the planet glaciers are formed, causing drop in sea level. Conversely, when the ratio is high, the temperature on the Earth surface increases (“greenhouse” effect), glaciers begin to melt, causing the increase of sea level (Flint, 1981). In consistence with the model (Fig. 13c,d), orogenic period begins just after collisions when CO2/O2 ratio becomes high, and Earth surface temperature grows. Glaciers begin to thaw and sea level increases (see above the present paragraph). Conversely, by the end of geosynclynal period, when glaciers are formed, sea level drops. In orogenic periods, when large masses of “fresh” magma rise to the surface and harden, mid-ocean ridge volume increases. When orogenic processes calm down ridge volume becomes low. Thus all the correlations that have been considered above confirm the validity of the evolution model.
§ 12. Reconstruction of some stages of biological evolution using the suggested model and available experimental data Basing on the previously studied material and evolution model, let us try to reconstruct the chain of biological events taking into account that they have occurred on the background of the interaction of the processes in the Earth’s crust and in the global “atmosphere – hydrosphere – biosphere“ system. Keep also in mind that the interaction has developed under the repeated orogenic cycles. This repeatability created favorable conditions for natural selection and fastening of the most successful mutations providing suitable kinetic advantages for further development. The reconstruction we’ll begin from the moment when the transition from heterotrophic to photosynthetic life has occurred. It was a great aromorphosis in biological evolution. This jump has happened when substrate, utilized in heterotrophic assimilation (mainly organic substances synthesized by abiogenic way), began to not suffice. The living organisms met a dilemma to survive, or to be lost. The evolution has solved the problem having suggested CO2 as a new substrate, which was plentiful in the environment. It also invented the mechanism of conversion of solar energy into chemical one. It is reasonable to assume that to realize photosynthesis protobionts have acquired electron-transport chain, reductive pentose phosphate cycle (Calvin-Benson cycle), coupled with glycolytic chain, which they inherited from primary heterotrophes. The coupling was needed to supply glycolytic chain with substrates, produced in pentose phosphate cycle.
42
A.A.Ivlev
Owing to anoxic atmosphere glycolytic chain was terminated in a variety of fermentation pathways which have been developed to supply energy needs of metabolism under various conditions (Stanier et al, 1976). Some of them are shown on Fig. 5. Krebs cycle because of lack of free oxygen was absent. One of the most important results of photosynthesis origin was the emergence of the key photosynthetic enzyme, responsible for CO2 fixation by means of ribulosebisphosphate (RuBP) carboxylation. It was named RuBPcarboxylase. But CO2 assimilation in protobionts differed from that in modern photosynthesizing organisms. Considering that environmental CO2 reservoir may be regarded as infinitely large as compared with the volume of a cell in organism, CO2 assimilation in protobionts may be approximated by stationary unidirectional flow, on contrary to discrete flow in modern photosynthesizing organisms where CO2 enters the cell by separate batches (Ivlev, 1989). It is well known that photosynthetic assimilation is followed by carbon isotope fractionation. It results in 12C enrichment of biomass. Sedimentary organic matter after biomass burial inherits 12C enrichment. This enrichment was used as a sign of photosynthesis in determination of origin timing. Oehler et al. (1972), having examined ancient sedimentary organic matter of Swaziland sequence, found the carbon isotopic shift equal to 12‰ between organic matter from underlying (older) sections and organic matter of overlying (younger) sedimentary deposits. It allowed them concluding that photosynthesis has emerged at least 3,1 billion years ago. Further investigations confirmed the timing of photosynthesis origin within the limits from 3,1 to 2,7 Ga (Smith et al., 1970; Schopf et al., 1971; Farquhar et al, 2011). It was also revealed that the ancient organic matter of photosynthetic origin was abnormally enriched in 12C that was never observed in the younger sediments. Carbon isotope composition turned to be in the limits from –35 to –40‰. The model explains this abnormity by two reasons. The first is bound to the difference in CO2 assimilation mechanism. In primitive photosynthesizing organisms assimilation took place from stationary CO2 flow (isotope fractionation in “open” system), while in organisms after photorespiration emergence assimilation took place in conditions of CO2 depletion in a cell (isotope fractionation in “closed” system). In the former case isotope fractionation is known to be larger than in the latter (Melander & Saunders, 1980). The second reason is in the absence of photorespiration in primitive organisms. The latter is followed by carbon isotope fractionation resulting in 13C enrichment of biomass. That is why, in modern photosynthesizing organisms have never been achieved such negative δ13C values of biomass carbon as in primitive ones, even under high CO2 concentrations (Calder, Parker, 1973).
Interaction of chemical and biological evolutions
43
From the emergence of photosynthesis till the moment when atmosphere remained anoxic, protobionts utilized fermentation to extract energy to supply metabolism. During this period the O2 concentration in the atmosphere has changed from 0.001 of present atmospheric level (0.001 PAL, Urey level) to 0.01 PAL (Pasteur’s level). In consistence with photosynthesis reaction the concentration of organic matter in sedimentary rocks should be low. When Pasteur’s level was surpassed, free oxygen has appeared in the atmosphere. Free oxygen in the atmosphere has created an ozone shield which protected organisms from destructive UV- rays and has spread photic zone. It stimulated photosynthesis and led to further considerable growth oxygen in the atmosphere and in corresponding growth of organic matter in sediments. Farquhar and colleagues (2011) have called this period Great Oxidative Events (GOE). In response to GOE new aromorphosis in biological evolution has arisen in the form of photorespiration. Photorespiration has appeared to adapt organisms to free oxygen because it was known as a poison for them. They should adapt to oxidative conditions either to be lost. The evolution chose the first possibility. What advantages photorespiration provides to photosynthesizing organisms? To work effectively photosynthesizing cells should keep Calvin cycle permanently operating and RuBP-carboxylase should be functioning. Under high density of solar radiation in Precambrian atmosphere the amount of CO2, fixed by cells might be not enough to utilize all the reducing power generated in light reactions. The new oxygenase function of enzyme, additional to carboxylase one, gave the organisms a possibility to generate a sink for reducing power and energy (Igamberdiev & Roussel, 2011). Moreover, photorespiratory pathway produced additional amount of CO2 to maintain Calvin cycle operating. The important role of photorespiration was to provide stability of photosynthesizing organisms in stress conditions by production in photorespiratory pathway of some molecules, like glutathione, proline, glycolic acid, etc., which are used to prevent over-reduction of electron transport chain and photoinhibition under stress conditions (under draught, high salinity, high illumination) (Wingler et al., 2000). Hence with the origin of photorespiration photosynthesizing organisms have acquired two important functions: CO2 assimilation to produce biomass and photorespiration to provide adaptation to stress conditions. Both functions are reciprocal, i.e. when one function increases, the other decreases, while their total contribution remains constant (Andre, 2011). Having arisen in early Proterozoic they have remained till present time.
44
A.A.Ivlev
As said before, until photorespiration emerged, photosynthesis was unidirectional and stationary process. The addition of photorespiration has made photosynthesis discrete, i.e. CO2 enters and evolves a cell by discrete batches due to Rubisco switching (Ivlev et al., 2004; Ivlev, 2012). The analysis of the CO2 assimilation and photorespiration coupling showed that, after photorespiration emergence, photosynthesis has acquired oscillatory character. Taking into account double function of the key photosynthetic enzyme to work as carboxylase and oxygenase it was named ribulosebisposphate carboxylase/oxygenase (Rubisco). Rubisco has become a regulator of photosynthetic switching. Another result of CO2 assimilation and photorespiration coupling was carbon isotope heterogeneity of biomass. Due to opposite signs of isotope effects, the coupling results in appearance of two isotopically different carbohydrate pools in photosynthesizing cells (Ivlev, 1993). “Light” carbohydrate pool arising in carboxylase phase of photosynthesis feeds with substrates glycolytic chain. The “heavy” pool arising in oxygenase phase and feeds with substrates photorespiratory loop and coupled syntheses of metabolites. It also supply with substrates heterotrophic tissues of photosynthesizing organisms. Farquhar et al. (2011) have estimated the timing of photorespiration emergence as 2,4-2,3 Ga. It correlates with data obtained by Garrels (1975), who noticed 13C enrichment of organic carbon, commenced after 2.1 Ga. According to the evolution model the 13C enrichment should be interpreted as a trait of photorespiration. Some indirect facts indicate on further development of photosynthesis in Precambrian. One of them is the growth of an average oxygen concentration in the atmosphere from one orogenic cycle to another. In the middle Proterozoic era (Grenwille cycle) the O2 concentration has increased and reached to 2-3% and by the end of Proterozoic (Catangian cycle) it already reached 10% or more (Igamberdiev & Lee, 2006). Besides oxygen content in the atmosphere, as indicator of photosynthesis development may be used organic matter in sediments, the second product of global photosynthesis reaction. Indirect information may be obtained from oils fields, bearing in mind that oils commonly coupled with rocks rich in organic matter. So a discovery of oil fields in Rephean and Vendian evidences for substantial development photosynthesis at that time. Successive growth of average content of O2 in the atmosphere is displayed in 13C enrichment of oils from cycle to cycle along geologic time (see Fig.10). In accordance with the evolution model source rock formation and oil fields abundances in Rephean and Vendian should correspond to glaciations
Interaction of chemical and biological evolutions
45
at the end of orogenic cycles. Hayes and colleagues have confirmed this fact revealing the signs of glaciations in Rephean (1,7 Ga) in Vendian (570 Ma). Moreover in agreement with the model they revealed the 13C enrichment of marine organic matter corresponding to the glacial period. This 13C enrichment was a result of intensification of photorespiration with O2 growth in the atmosphere by the end of orogenic cycle. One more consequence of photosynthesis development was the appearance of climatic cycles. They were direct result of the repeated orogenic cycles in which periods with high concentrations of CO2 (orogenic periods) were replaced by periods with reduced CO2 concentration (geosynclynal periods) and vice versa. At the same time the former periods are known as warming periods (“hotbed” periods), the latter as cooling periods (glacial periods) (see §8). Within certain limits plants have learned to adapt themselves to the changing climatic conditions by changing CO2/O2 ratio, thus controlling contribution of CO2 assimilation and of photorespiration. The aforementioned relationship of carbon isotope composition and carbon isotope fractionation, expressed as difference between 13C abundance in marine organic carbon and in coeval carbonates, corresponding to glacial or interglacial periods respectively (Hayes et al, 1989), gives additional confirmation to this adaptability. Furthermore, its manifestation in Precambrian, as well as in Phanerozoic shows the relationship has common character. The key role of the CO2/O2 ratio in environment and inside a cells of photosynthesizing organisms was emphasized by Tcherkez et al. (2008). The next essential aromorphosis in biological evolution was the conquest of land by photosynthesizing organisms. It began as early as in the Silurian, but its strongest manifestation has happened in Carboniferous. Settling of land was preceded by changes in carbon metabolism of cells of photosynthesizing organisms in a form of adipose storage and a tool obtaining energy of fats, i.e. their oxidation in Krebs cycle with use of oxygen and coupled formation of ATP. Generation of apparatus of dark respiration coupled with photosynthesis provided a certain energetic autonomy for organism under changing and various conditions of land life (Hochachka & Somero, 1977). The indicated time of appearance of these readjustments in carbon metabolism is confirmed by appearance of carbon isotope differences between bitumoidy and kerogen fractions of organic matter (Fig. 14) (Galimov et al., 1975). Indeed, lipid fraction of biogenic matter is considered to be a predominant source of carbon to form bitumoidy part of the organic matter, while its kerogen part is of carbohydrate-protein nature (Tissot & Welte,
46
A.A.Ivlev
1978; Hunt, 1996). It is also known that the lipid fraction of biomass is enriched in 12C relative to the carbohydrate-protein fraction. Moreover the isotopic shift between these fractions is of the same order as the difference between kerogen and bitumoidy fractions (Degens, 1969; Ivlev, 1986). It is logic to conclude that the isotopic difference between kerogen and bitumoidy parts of the organic matter are inherited from the corresponding fractions of “living” matter. It has become a consequence of respiration mechanism formation, including fat reserves coupled with Krebs cycle. The 13C enrichment of organic matter observed on Fig.14 also evidences that violent development of terrestrial plants occurred in the Carboniferous was followed by a significant growth of oxygen concentration in the atmosphere. It advanced biosphere closer to the point of ecological compensation. Since this moment and in the following orogenic cycles the “atmosphere–hydrosphere–biosphere” system became very sensitive to any CO2 entry regardless of the reason for that (see §8). The orogenic cycles became shorter and more frequent. The settling of land by plants led to diversity of conditions of plant habitats. New rate limiting factors of photosynthesis has appeared. Among them the most important was the water, the second substrate in photosynthesis reaction. The other factors, bound to water indirectly, like temperature, illumination,
Figure 14. Changes of isotope composition of the organic carbon (vertical axis, δ13C, ‰) in sedimentary rocks of the Russian platform (Galimov et al., 1975). (1) Kerogen, (2) bitumoidy. Horizontal axis – geological time (Ma).
Interaction of chemical and biological evolutions
47
salinity, etc., also limit the rate of photosynthesis. Usually rate limiting factors result in carbon isotope fractionation. That is the reason for a number of publications devoting to this problem (Park & Epstein, 1960; Osmond et al., 1975; Adiva et al., 1979; Condon & Richards, 1993; Borland et al., 1994). After burial of “living” matter, the diversity of habitats mainly transforms into peculiarities of facial conditions including the type of burial organic material in the area of sedimentation (Degens, 1969; Hayes, 1993). It causes the correlation between carbon isotope composition of organic matter in sedimentary rocks and facial conditions of sedimentation. This correlation is often used for reconstruction of photosynthesis conditions in the geological last (Arthur et al., 1985a,b; Popp et al., 1989; Huang et al., 2001; Ratnnayake et al., 2006). One of the examples confirming the impact of diversity of habitat conditions, mentioned before (Fig.10), shows a marked broadening of the rather narrow range of carbon isotopic variations of oils after Triassic period when land settling occurred. This broadening is explained by the fact that oil, whose genesisis until then was mainly bound to algal source, later became aware of contribution from terrestrial plant biomass. The impact of different factors, limiting photosynthesis rate in land plants is transferred through stoma apparatus. Formation of the stoma apparatus was wonderful acquisition of evolution. The evolutionary sense of this step was to optimize the photosynthesis conditions by regulating CO2/O2 ratio and water vapor pressure in a cell. Optimization of CO2/O2 ratio was aimed at achievement of maximal CO2 concentration at carboxylation sites by means of increasing diffusion rate of CO2 from environment and at decrease of its evolution during respiration. It is provided by modifying the size of stoma apertures and their number thus changing CO2/O2 ratio (Woodward, 1987; Beerling & Woodward, 1997; Royer et al., 2001). As said the ratio controls Rubisco switches and simultaneously determines isotope composition of total carbon of leaf biomass (Ivlev, 2008, 2012). A lot of works are devoted to study of correlations between water availability and carbon isotope composition of plants (Farquhar & Richards, 1984; Farquhar et al., 1989; Ehleringer & Vogel, 1993; etc.). Water availability also changes stoma apertures regulating their size and number, controlling the amount of moisture inside of leaves. In addition, by controlling evaporation, plants regulate their temperature. Evaporation is accompanied by cooling, so the plants take a possibility to protect themselves from overheating under conditions of high temperatures, for instance, at “hothouse” period. The temperature, like water availability, affects the carbon isotope ratio via stoma apparatus.
48
A.A.Ivlev
The permanent decrease of CO2 concentration in the atmosphere has eventually led to the new aromorphosis in the form of the appearance and spreading of terrestrial photosynthesizing organisms and plants with the C4type of assimilation. They often possess a characteristic leaf anatomy (Edward & Walker, 1986). Their vascular bundles are surrounded by two rings of cells. The inner ring called bundle sheath cell contains chloroplasts lacking grana. The outer ring consists of cells called mesophyll cells. The environmental CO2 enters the bundle sheath cells by means of a new carboxylating enzyme – phosphoenolpyruvate carboxylase (further PEPcarboxylase). PEP-carboxylase is one more result of ongoing decrease of CO2 concentration in the atmosphere. This enzyme is deprived of oxygenase activity. As a result of CO2 fixation C4-acids are formed. These molecules move into mesophyll cells where they are subjected to decarboxylation. Carbon dioxide, produced in the reaction, is involved then in Calvin cycle. All further processes are the same as in C3-plants. Due to two-stage mechanism of CO2 assimilation C4-plants have a very low photorespiration, i.e. they assimilate practically entire CO2 entering the cells. Carbon dioxide produced in cells is not released, but almost completely is reassimilated. The above physiological and anatomical peculiarities allow C4-plants to survive at very low CO2 concentrations (up to 0,005 vol. %). They could exist in the places where conditions with low concentrations became spread or predominant. Another consequence of their peculiarities is a small carbon isotope fractionation following assimilation. Their carbon isotope composition varied from -17 to -9‰ (on average -14‰). For comparison, the isotope composition of C3-plants fluctuates from -32‰ to 20‰ (on average -27‰). The origin of C4-plants is referred to Miocene (Cerling et al., 1992, 1997). Their occurrences are the zones with low CO2 concentrations and hot climate. High temperatures are favorable for them since two-stage assimilation system requires additional energy costs. On contrary, in zones with cold climate C3-plants are widely spread (Sage, 2004). In zones with hot and dry climate (desert zones) C4-type plants have appeared as intermediate form, named CAM – plants. They have diurnal rhythm in CO2 assimilation. C4-pathway functions at night, when stoma apertures are open, while in the light, when illumination is strong and apertures are closed, C3-pathway is active. By this way CAM-plants are able to save water in conditions of low water availability. Depending on the concrete circumstances the evolution has created two types of CAM plants: C3-like CAM and C4-like CAM. Carbon isotope composition of CAM plants is intermediate in respect to that of C3 and C4-plants.
Interaction of chemical and biological evolutions
49
So C4-type of CO2 assimilation is one more response of biosphere to decrease of CO2 concentration in the atmosphere. Prior to C4-plants, biosphere responded to CO2 variations, changing CO2/O2 ratio at carboxylation sites via Rubisco switching and causing changes in carbon isotope composition. C4-plants having appeared, biosphere became to respond to climate changes by regulating areas of C3 and C4-plant occurrences (Ehleringer et al, 1997). When CO2 concentration in the atmosphere increased, the occurrence of C3-plants rose and vice versa. Accordingly, in case of prevalence of C3- plants total biomass will be enriched in 12C, in case of prevalence of C4- plants, it will be enriched in 13C. Evidently these changes are manifested in sedimentary organic matter (Cen et al., 2001). An example of such response is given in the work of Huang et al. (1999). On Fig. 15 very interesting correlations are depicted. They prove very close correlation between concentration of atmospheric CO2 and Earth surface temperature from one side, and carbon isotope characteristics of different biogenic objects of terrestrial and fresh aquatic origin from another (Huang et al., 1999). The period of studies covered an interval approximately 40000 yr beginning with last glacial through the present interglacial. The terrestrial organic matter was presented by source specific biomarkers from lipid fraction of organic matter (n-alkanes, n-fatty organic acids and n-alcanols). It revealed large glacial/interglacial isotopic shifts: those from the last glacial (-20 to -18‰) indicate terrestrial vegetation dominated by C4 grasses or sedges, whereas those from the early Holocene (–34 to –27‰) reflect recolonization of the catchment area by C3–plants. The aquatic organic matter was presented by isoprenoid alkenes. It was proved preliminarily; these alkenes were produced by microalgae Botryococcus braunii, abundant at this time. An extreme δ13C shift of over 25‰ was displayed by algal biomarkers with a maximal value of -5,1‰ at the glacial contrasting with the minimal value of -30,3 at the beginning of Holocene. The total organic matter revealed the same character of isotopic variations as lipid fractions. Data, confirming isotopic shifts in organic carbon during glacial/interglacial transitions, were also obtained by Ratnayake and colleagues (2006). They examined carbon isotope ratio of land plant-derived n-alkanes in deep-sea sediments during the last 259,000 years. They gave additional confirmation of the above regularity including isotopic ratio of both terrestrial and marine organic matter. However they noted that input of terrestrial organic matter from the area with various and complex conditions of habitats and specific transportation may obscure the interpretation. It is interesting that close correlations of isotopic characteristics with CO2 concentration and temperature changes characterizing glacial/interglacial
50
A.A.Ivlev
Figure 15. Carbon isotope records of total organic carbon and individual biomarkers in Sacred Lake (Mt. Kenya) during the last 35,000 calendar years. Symbols: empty square denotes the weighted-average δ13C values of leaf wax n-alkyl lipids (C27, C29, and C31 n-alkanes, C26, C28, and C30 n-acid or alkanols); rhomb denotes weightedaverage δ13C values of mid-chain-length n-alkyl lipids (C23and C25, n-alkanes, C22 and C24 n-alkanol) ; square with cross inside refers to the weighted-average δ13C values of isoprenoid alkenes produced by B braunii. The CO2 and temperature record from the Vostok Station ice core, Antarctica. Replotted from Haung et al., (1999).
Interaction of chemical and biological evolutions
51
transitions of quaternary period are in good accordance with analogous correlation observed by Hayes and colleagues (1999) for glacial/interglacial transitions for sedimentary organic matter in Precambrian. It evidences that the physical reason determining these correlations in both cases is the same. Moreover it is the same reason that underlies the examined model describing interaction in Earth’s crust and Biosphere. The same compensating response of biosphere to the increase of CO2 in the atmosphere, caused by anthropogenic factor, is observed in present times (Ivlev, Voronin, 2007). It is manifested in the change of occurrence area of tundra plants and that of boreal forests of Siberia (Bunn, Goetz, 2006). The obtained results support the assumption that isotopic variations of organic carbon are conditioned mainly by the dependence of carbon isotope fractionation in photosynthesis on CO2/O2 ratio concentration in the environment. Summarizing, let’s combine all the above findings in form of a scheme (Fig.16). The scheme is a reconstruction of sequence of biological aromorphosis that can be done using isotopic data connecting with geological, paleontological, and other records. The validity of the suggested scenario is substantiated by its ability to explain the known natural correlations and to disclose their nature and links.
Figure 16. The suggested scenario of the biological evolution based on analysis of fluctuations of CO2 and O2 in atmosphere and of differences of carbon isotope composition of carbonates and organic matter of sedimentary rocks for geological time (Ma).
52
A.A.Ivlev
The key stages of biological evolution coupled with geological events are shown on the Fig. 16 as arrows the starting point of which designates the putative beginning of the event. Each arrow is provided by the proper signature. At the top of the Fig. 16 the curves depicting jump-like changes of CO2 (dash line) and O2 (bold line) in the atmosphere are shown. Concentrations of CO2 and O2 (Y–axe) are given in relative units in respect to present atmospheric level (PAL). According to thermodynamic estimates CO2 concentration in protoatmosphere (prior to photosynthesis origin) can’t be 10 times higher than present level, whereas O2 concentration was about 0.001 of PAL, determined by water photodissociation (Rutten, 1978). At the bottom of Fig. 16 thin lines designate the changes of carbon isotope composition, characterizing organic matter (biomass) and coeval carbonates (CO2). The shifts in carbon isotope composition of organic matter and carbonates are bound to the change in CO2 and O2 concentrations in the course of geological time. The first aromorphosis, according to evolution scenario, depicted on Fig. 16, is the photosynthesis origin. It was transition from heterotrophic to photosynthesizing life. In coordinates” Δ13C vs geological time” the transition was followed by jump in carbon isotope composition more than 30‰ (in absence of photorespiration). The approximate timing of photosynthesis emergence is 3,1 – 2,7 Ga. With the beginning of photosynthesis the O2 concentration in the atmosphere, as well as organic matter concentration in sediments has begun to increase. Since the oxygen concentration was small and protobionts used fermentation for substrate oxidation, oxygen concentration in the atmosphere couldn’t exceed 0,01 PAL (Pasteur’s level) (Rutten, 1978). The organic matter produced was of double origin – synthesized by biogenic and abiogenic way. Next aromorphosis was the emergence of photorespiration. It was caused by appearance of free oxygen in the atmosphere. Simultaneously with photorespiration, the key photosynthetic enzyme RuBP-carboxylase has acquired oxygenase function and has converted into RuBP – carboxylase/oxygenase (Rubisco). At the same time photorespiratory loop has been developed. The coupling of CO2 photoassimilation with photorespiration and double function of enzyme have made photosynthesis to be oscillatory process. Photorespiration was followed by carbon isotope fractionation with effect of opposite sign relative to that in CO2 assimilation. It resulted in 13C enrichment and in isotope heterogeneity of biomass. Different factors stimulating photorespiration led to a greater 13C accumulation in biomass. In particular, the increase of oxygen in the atmosphere, reinforcing photorespiration, resulted in gradual accumulation of 13 C in biomass from one cycle to another. Within the orogenic cycle the
Interaction of chemical and biological evolutions
53
accumulation of 13C in biomass also takes place from the beginning to the end of the cycle in parallel with reinforcement of photorespiration. It causes a decrease of the difference between carbon isotope composition of sedimentary organic matter and coeval carbonates in the course of orogenic cycle. Photorespiration has appeared in the time interval from 2.3 to 2.4 Ga. Emergence of photorespiration stimulated further development of photosynthesis. The oxygen content in the atmosphere and organic matter content in sediments has increased as well. The organic matter content has grown so much that in Rephean first source rocks and industrial oil fields have been appeared. Great aromorphosis, bound to settling of land by plants, occurred in Ordovician and went on in Silurian. Adaptation to terrestrial conditions led to considerable metabolic shifts in plant metabolism. It manifested in formation of dark respiration apparatus, including adipose pools formation and combination them with Krebs cycle. The peak of land settling fell on Carboniferous (Fig.16). One more acquisition to adapt the plants to terrestrial conditions was stoma apparatus formation. Gradual decrease of CO2 concentration in the atmosphere finally led to new aromorphosis caused the appearance of C4-plants with a new CO2 assimilation pathway. It provided effective assimilation CO2 even from the environment with very low CO2 concentration (0,005 vol.%). The efficiency of CO2 assimilation was achieved due to a new enzyme PEP-carboxylase, lacking of oxygenase activity, and due to existence of two types of tissues which provided very low photorespiration (Fig.17). C4-plants occurred in Miocene by the end of geosynclynal period of Alpine cycle when CO2 concentration dropped to minimum. Oxygen content, on contrary, grew up, causing intensification of photorespiration and 13C enrichment of organic carbon. Of course, this tentative scenario isn’t the real picture but rather succession of events that might be. Most of estimates of timings are conditional and have a qualitative character. Nevertheless its validity is confirmed by the fact that scenario is based on a big number of facts and correlations that are self-consistent and have clear physical explanation.
Conclusions The material of the manuscript supports the remarkable idea of outstanding Russian geochemist acad. V.I. Vernadsky about interconditionality and interference of processes in the Earth's crust and in the Biosphere which he has put forward as early as in 1926. We has developed his idea on the basis of modern knowledge and basing on the great
54
A.A.Ivlev
accumulated factual material (mainly carbon isotope data). More thoroughly we have examined the problem concerning evolution of photosynthesis. According to the suggested scenario of biological evolution, photosynthesis is a key point in global carbon cycle which unites all the processes proceeding in Earth’s crust, in atmosphere, and in biosphere. Carbon participates in turnover in oxidized and in reduced form. Photosynthesis realizes the transition from oxidized form into reduced one. The reverse transition of reduced form into oxidized is accomplished in subduction zones in redox reaction with sulfates as an oxidant. Summarizing the obtained results, in short, carbon cycle may be described as follows. Owing to some extraterrestrial reasons (probably under impact of cosmic bodies) magma in Earth’s crust performs convection movement. Owing to this movement in the point of middle-oceanic mountain ridge magma escapes the crust. After solidification magma moves apart basalt plates composing cortex. In the other point of the crust plates collide and one of them, bending, moves down into magma and is adsorbed. Thus the plates are in permanent movement. The movement is uneven and aperiodic. Due to irregularity, two periods of this movement are distinguished. A relatively short period of intensive movement of lithospheric plates, accompanied by volcanism and mountain building, is called orogenic. An extended period of relatively quiet development of Earth’s crust and reduction of volcanic activity and mountain building is called geosynclinal. Both periods compose orogenic cycle. The cyclicity of plate movement determines the cyclic character of all related processes. The collisions with participation of continental plates, carrying sedimentary rock, are of special interest, since they concern global carbon cycle. At high temperatures and large pressures in subduction zones sedimentary rocks are destroyed. Carbonates dissociate, producing CO2. Organic matter also converts into CO2, interacting with sulfates in redox reaction. Sulfates fall into sediments from oceanic waters. Carbon dioxide, raising to the surface, fills carbon “atmosphere-hydrosphere“ system. In subduction zones carbon is transformed from the reduced to oxidizing forms in thermochemical sulfate reduction. In part, oxidation of the reduced carbon occurs already in surface and subsurface conditions in oxidation reactions and in respiration processes in living organisms with participation of free oxygen. The reverse transition of carbon oxidizing forms into reduced ones is provided by photosynthesis mainly in geosynclynal periods of orogenic cycles. Thus global carbon cycle consists of two branches – oxidizing branch, including inorganic carbon forms (CO2, bicarbonate and carbonate ions), and reduced branch, including organic carbon in all its forms. Indispensable
Interaction of chemical and biological evolutions
55
condition of carbon cycle is lithospheric plate movement. Biological evolution concerns only a small segment of global carbon cycle, but the processes in other parts of the cycle exert impact on it. This is impact in a form of aperiodic bursts of CO2 in “atmosphere -hydrosphere” system arising in orogenic periods. They alternate with the impact of photosynthesis in geosynclynal period providing aperiodic cyclicity of the evolution as well as cyclicity of many others biosphere, geological and climatic processes. Since photosynthesis origin, carbon cycle was open from the viewpoint that amount of organic carbon produced in photosynthesis was not equal to amount of CO2 returned back from subduction zones and from other oxidative processes. Therefore oxygen in the atmosphere began to accumulate in amounts equivalent to organic matter, preserving in sedimentary rocks. The accumulation went on until the moment when the ecological compensation point was achieved, i.e. when the amount of reduced carbon became approximately equal to the amount of oxidized carbon. It has happened after Carboniferous when terrestrial life has appeared and plants settled the land causing violent development of photosynthesis. The achievement of the ecological compensation point was followed by many consequences, such as high sensitivity of “atmosphere-hydrosphere” system to separate casual CO2 bursts, proximity of average CO2 and O2 concentrations to steady-state meanings, the sharp reduction of fossilization coefficients. The latter means that accumulation of organic matter in sediments has stopped. This scenario explains well many facts and is confirmed by numerous evidences. Among them the explanation of carbon and sulfur cycles coupling is and those facts that follow from coupling and have logic explanation, such as the correlation of carbon and sulfur isotope characteristics observed along with geologic time, the abundance of sulfide oxidizing bacteria in Precambrium, etc. Evolution model explains the climatic cycles, as a consequence of alternating orogenic periods with high CO2 concentration and geosynclynal periods with gradual decrease of CO2 at the expense of photosynthesis development. It gives substantiation to ecological compensation point. The evolution model explains well the numerous correlations of biodiversity rate (the rate of appearance of new fauna and flora species formation) with oxygen concentration in the atmosphere in the course of geologic time . The model explains the observed variations in carbon isotopic difference between carbonates and coeval organic matter in sedimentary rocks in glaciations and interglacial time.
56
A.A.Ivlev
It gives reasonable explanation for irregular stratigraphic distribution of source rocks as well as a logic explanation for the beginning of oil fields formation in Rephean and trends of oil fields formation to glacial periods, characterizing as a time with high oxygen concentration. The model makes the theoretical basis for explanation of cyclicity of geological processes, such as the periodic variations of a sea level, of middleoceanic mountain ridge volume, of continental area and many other characteristics connected directly or indirectly with interaction of geologic and biosphere processes. The variations of different characteristics of the processes correlate with each other regardless of the place where they have occurred in biosphere, in atmosphere, in hydrosphere, or in the Earth’s crust. Applied to photosynthesis, the key stages of evolution can be marked as follows. 1.
2.
3.
4.
5.
Origin of photosynthesis and transition from heterotrophic Life to photosynthesizing (autotrophic) Life has occurred from 3,1 up to 2,7 Ga. The primary photosynthesis included the appearance of Calvin cycle and RuBP-carboxylase enzyme. Photoassimilation is represented as unidirectional continuous CO2 flow from the environment into a cell. Transition from anoxic Life to oxygenic one and emergence of photorespiration has occurred from 2,3 to 2,1 Ga. It was followed by formation of shuttle mechanism of Rubisco operation and by discreteness of CO2 assimilation and photorespiration. The coupling of CO2 assimilation and photorespiration resulted in appearance of carbon isotope heterogeneity in biomass. Jump-like development of oxygenic photosynthesis with increased contribution of photorespiration to biomass synthesis resulted in a consecutive 13C enrichment of biomass along with geologic time and was manifested as 13C enrichment of sedimentary organic matter. Accumulation of free oxygen in the atmosphere and organic matter in sediments occurred until ecological compensation point was achieved. Accumulation of organic matter in sedimentary rocks was uneven. Most intensive accumulation and source rock formation occurred by the end of geosynclynal periods, characterizing high concentration of oxygen in the atmosphere and glaciations. It was the very time most favorite for oilfields formation. The conquest the land by plants has begun in Silurian, but has reached peak in Carboniferous. It was time when dark respiration apparatus was formed, including the appearance of Krebs cycle
Interaction of chemical and biological evolutions
6.
7.
57
coupled with lipid depot. In plant leaves stoma apparatus was created. In Cenozoic the average oxygen concentration in the atmosphere approached the level when the global “atmosphere – hydrosphere – biosphere” system achieved the point of ecological compensation. A powerful bloom of land plants in Cenozoic produced material which made up a source of carbon for coal formation. Algal material, which was the only source of carbon for oil formation, was supplemented with terrestrial material. A gradual decrease of atmospheric CO2 concentration in Cenozoic led to the occurrence of C4 plants. The peak of wide spread has happened in Miocene. C4- plants had two-stage mechanism of CO2 assimilation and special carboxylating enzyme, PEP-carboxylase, lacking oxygenase activity. Opposite to C3-plants, C4-plants were significantly enriched in 13C.
Certainly, the stated succession of events is only a probable scenario of what could occur. But it looks basically substantiated, as it describes natural regularities and supplies them with clear physical explanations. At least, it can be claimed that it is possible scenario of how interaction of processes in the Earth’s crust and in biosphere could occur.
Literature 1. 2. 3. 4. 5. 6. 7. 8.
Abelson P.H., Hoering T.C. Carbon isotope fractionation in the system CO2(gas) - CO2(aqua) – HCO3(aqua) // Ann. Rep. Dir. Geophys. Lab. 1960. V. 59. P. 158-161. Adiva S.G., Nissenbaum A., Galun M., Waizel Y. Effect of water regime on carbon isotope composition of lichens // Plant Physiol. 1979. V.63. P. 201-205. Ahrens N.C., Jahren A.H. Carbon isotope excursion in atmospheric CO2 at the Cretaceous Tertiary boundary: evidence from terrestrial sediments // Palaios 2000. V. 15. P. 314-322. Andre M.J., Modelling 18O and 16O unidirectional fluxes in plants: 1. Regulation of preindustrial atmosphere // BioSystems 2011a. V. 103. P. 239-251. Andre M. J. Modelling 18O2 and 16O2 unidirectional fluxes in plant: II. Analysis of Rubisco evolution // BioSystems 2011b. V. 103. No 2. P. 251-264. Andrusevich V.E., Engel M.H., Zumberge J.E., Brothers L.A. Secular, episodic changes in stable carbon isotope composition of crude oils // Chemical Geology 1998. V.152. P. 59-72. Arthur M.A., Dean W.E., Claypool G.E., Anomalous 13C enrichment in marine organic carbon // Nature 1985a. V. 315. P.216-218. Arthur M.A., Dean W.E., Schlanger S.O. Variations in the global carbon cycle during Cretaceous related to climate, volcanism, and changes in atmospheric
58
9. 10. 11. 12. 13. 14. 15. 16.
17. 18.
19. 20. 21. 22. 23. 24. 25. 26.
A.A.Ivlev
CO2 / in: The Carbon Cycle and Atmospheric CO2 : Natural Variations Archean to Present // American Geophysical Union Monograph 1985b. V.32. P. 504-530. Bazhenova O.K., Sokolov B.A. Origin of oil - the fundamental problem of natural science // Geol. Oil & Gas. 2002. No. 1. P. 2-7. Beerling D.G., Woodward F.I. Changes in land plant function over the Phanerozoic reconstructions based on the fossil record // Bot. J. Linn. Soc. 1997.V. 124. P. 137-153. Berner R.A. Atmospheric oxygen over Phanerozoic time // Proc. Natl. Acad. Sci. USA 1999. V.96. P. 10955-10957. Berner R.A. Atmospheric carbon dioxide levels over Phanerozoic time // Science 1990. V. 249. P. 1382-1386. Berner R.A.,Canfield D.E. A new model for atmospheric oxygen over Phanerozoic time // Am J. Sci. 1989. V. 289. P. 333-361 Berner R.A., Kothavala Z., GEOCARB III: a revised model of atmospheric CO2 over Phanerozoic time // Am.J.Sci. 2001. V.301. P. 184-204. Berner R.A., Kothavala Z., GEOCARB III: a revised model of atmospheric CO2 over Phanerozoic time // Am.J.Sci. 2001. V.301. P. 333-361. Berner R.A., Petsch S.T., Lake J.A., Beerling D.J., Popp B.N., Lane R.S., Laws E.A., Westley M.B., Cassar N., Woodward F.I., Quick W.P. Isotope fractionation and atmospheric oxygen: implications for Phanerozoic O2 evolution // Science 2000.V.287. P. 1630-1633. Bjerrum C.J., Canifield D.E. New insight into the burial history of organic carbon on the early Earth // Geochim. Geophys. Geosyst. 2004. V.P Q08001. Borland A.M., Griffiths H., Broadmeadow M.S., Fordham M.C., Maxwell C. Carbon Isotope Composition of Biochemical Fractions and the Regulation of Carbon Balance in Leaves of the C3-Crassulenean Acid Metabolism Intermediate Clusia minor L. Growing in Trinidad // Plant Physiol. 1994. V.105: P.493-501. Brodsky A.I. Isotope chemistry М.: Publishers AN SSSR. 1960. Budyco M.I. About the leading factor of evolution of biosphere // Vestn.RAN 1995. V.65. P. 1064-1073. Budyco M.I., Ronov A.B. Evolution of atmosphere in Phanerozoic // Geochimiya 1979. No 5. P. 643-653. Bunn A.G., Goetz S.J. Trends in satellite-observed circumpolar photosynthetic activity from 1982 to 2003: the influence of seasonality, cover type and vegetation density // Earth Interect. 2006. V.10. Paper 12. P. 1-11. Calder J.A., Parker P.L. Geochemical implications of induced changes in 13C fractionation by blue-green algae // Geochim. et Cosmochim. Acta 1973. V. 37. P. 133-140. Canfield D.E. A new model for Proterozoic ocean chemistry // Nature 1998. V. 396. P 450-453 Canfield D.E., Teske A. Late Proterozoic rise in atmospheric oxygen inferred from phylogenetic and sulfur-isotope studies // Nature 1996. V. 382. P. 127-132. Cen Y.-P., Turpin D.H., Layzell D.B. Whole-plant gas and reductive biosynthesis in white lupin // Plant Physiol. 2001.V.126. P. 1555-1565.
Interaction of chemical and biological evolutions
59
27. Cerling T.E., Wang Y. Quade J. Expansion of C4 - ecosystems as an indicator global ecological change in late Miocene // Nature 1992. V. 361. P. 344-348. 28. Cerling T.E., Harris J.M., MacFadden B.J., Leakey M.J., Quade J., Eizenmann V., Ehleringer J.R. Global vegetation change through Miocene/Pliocene boundry // Nature 1997 V. 389. P. 153-158. 29. Cornette J.L., Lieberman B.S., Goldstein R.H. Documenting a significant relationship between macroevolutionary origination rate and Phanerozoic pCO2 levels // Proc. Natl. Acad. Sci. 2002. V. 99. P. 7832-7835. 30. Cowling Sh.A., Sykes M.T. Physiological Significance of Low Atmospheric CO2 for Plant – Climate Interactions // Quaternary Research. 1998. V. 52. P. 237-247. 31. Dakhnova M.V., Bazhenova T.K., Lebedev V.S. Isotopic criteria for predicting the phase composition of hydrocarbons in Riphean and Vendian deposits of the Lena–Tunguska petroleum province // Russian geology and geophysics. 2011. V. 52. №. 8. P. 945-953. 32. Dalimov T.N., Troitskii V.I. Evolutionary Geology Tashkent: IPTD ”O’Qituvchi” 2005. 33. Degens E.T. Biogeochemistry of Stable Carbon Isotopes //Organic Geochemistry / Eds. G.Eglinton and M.T.J.Murphy. Berlin, New York: Springer-Verlag, 1969. Ch.7. P. 207-226. 34. DeNiro M.J., Epstein S. Influence of diet on the distribution of carbon isotope in animals // Geochim. et Cosm. Acta 1978. V. 42. P. 495-506. 35. Deuser M.J.S., Degens E.T. Carbon isotope fractionation in the system CO2(gas) – CO2(aqueous) – HCO3-( aqueous) // Nature 1967. V.215. P. 1033-1037. 36. Dubinsky A.Yu. , Ivlev A.A. Computational analysis of the possibility of the oscillatory dynamics in the processes of CO2 assimilation and photorespiration // BioSystems 2011. V. 103 P.285-290. 37. Edwards G., Walker D.A. C3, C4 : Mechanisms, and cellular and environmental regulation of photosynthesis. Blackwell Scietific, Oxford. 1983, 590 pp. 38. Ehleringer J.R., Cerling T.E.,Helliker B.R. C4 photosynthesis, atmospheric CO2 and climate // Oecologia 1997. V.112. P. 285-299. 39. Ehleringer J.R., Vogel J.C. Historical aspects of stable isotopes in plant carbon and water relations // 1993. pp. 9-19. In: Ehleringer J.R., Hall A.E., Farquhar G.D. (editors) / Stable Isotopes and Plant Carbon-Water Relations.Academic Press, Inc.. San Diego, Boston, New York, London, Sydney, Tokyo, Toronto. 40. Eremenko N.A., PankinaR.G., Botneva T.A., Maksimov S.P., Mekhtieva V.L., Ivlev A.A., Stabil-nye izotopy v geokhimii nefti (Stable Isotopes in Oil Geochemistry) Moscow, 1974. 41. Farquhar G.D., Richards R.A. Isotopic composition of plant carbon correlates with water use efficiency of wheat genotypes // Aust. J. Plant Physiol. 1984.V.11. P. 539-555. 42. Farquhar G.D., Hubick K.T., Condon A.G., Richards R.A. Carbon isotope fractionation and plant water-use efficiency // Stable Isotopes in Ecological Research / Eds Rundel P.W., Ehleringer J.R., Nagy K.A. N. Y. Springer, 1989. V. 68. P. 21-40.
60
A.A.Ivlev
43. Farquhar G.D., Zerkle A.L., Bekker A. Geological constraints on the origin of oxygenic photosynthesis // Photosynthesis Res. 2011. V. 107. P. 11-36. 44. Fischer A.G. Climatic oscillations in the biosphere / in: Biotic Crises in Ecological and Evolutionary Time. Ed. By Nitecki M. // N.Y. Academic. 1981. P. 103-131. 45. Flint R.F. The Earth and its history New York. Wiley & Sons, 1973. 46. Fox S.W., Dose K. Molecular evolution and the origin of life. San Francisco: Freeman and Company. 1972. 47. Fry B., Jeng W.L., Scalan R.C. 13C Food web analysis of a Texas sand dune community // Geochim. Et Cosm. Acta 1978. V. 42. P. 1299-1302. 48. Galimov E.M. Geochemistry of stable isotopes of carbon. M: Nedra. 1968. 49. Galimov E.M., Ronov A.B., Migdisov A.A. Variations of isotope composition of the carbonateand organic carbon in Earth history // Geokhimiya 1975. No. 3. P. 323-342. 50. Garrels R.M. Carbon, oxygen, oxygen turnover in the course of geological time // XV lecturing of V.I. Vernadsky March 12 M.: Nauka. 1975. 51. Garrels M.N., Crist Ch. L. Solutions, minerals, and equilibrium. Harpers, Geosciences Series Harper & Row, New York, 1965 52. Gautier D.L. Isotopic composition of pyrite: relationship to organic matter type and iron availability in some North American Cretaceous shales // Chem. Geol. 1987. V. 65. P. 293-303. 53. Greenwood D., Scarr M.J., Christophel D.C. Leaf stomatal frequency in the Australian tropical rainforest tree Neolitsea dealbata (Lauraceae) as a proxy measure of atmospheric pCO2 // Paleogeograph. Paleoclimatol. Paleoecol. 2003. V.196. P. 375-393. 54. Harland U.B., Koks A.V., Levellin P.G. et al. Geological time scale M.: Mir. 1985. 55. Hayes J.M., Fractionation of carbon and hydrogen isotopes in biosynthetic processes // In: Review in mineralogy and geochemistry V.43 Stable isotope geochemistry / Eds. J.W. Valley, Cole D.R. Mineralogical Society of America. Washington DC. 2001. 56. Hayes J.M., Strauss H., Kaufman A.J. The abundance of 13C in marine organic matter and isotopic fractionation in the global biogeochemical cycle of carbon during the past 800 Ma // Chem. Geol. 1999. V.161. P. 103 - 125. 57. Hayes J.M. Factors Controlling 13C Content of Sedimentary Organic Compounds: Principles and Evidence // Marine Geology 1993. V. 113. P. 111-125. 58. Hayes J.M., Popp B.N., Takigiku R., Johnson M.W. An isotopic study of biogeochemical relationships between carbonates and organic carbon in the Greenhorn Formation // Geochim et Cosm. Acta 1989. V.53. P. 2961-2972. 59. Hochachka P.W., Somero G.N. Strategies of biochemical adaptation. Phyladelphia, London, Toronto : W.B. Saunders Company 1973. 60. Hetherington A.M., Woodward F.I. The role of stomata in sensing and driving environmental change // Nature 2003. V. 424. P. 901 - 908.
Interaction of chemical and biological evolutions
61
61. Hobbie E.A., Werner R.A. Intramolecular, compound-specific, and bulk carbon isotope patterns in C3 and C4 plants: a review and synthesis // New Phytologist 2004. V. 161. P. 371-385. 62. Holland H.D. The history of ocean water and its effect on the chemistry of atmosphere // Proc Natl. Acad. Sci. USA 1965. V.53. P. 1173-1182. 63. Huang Y., Street-Perrott F.A., Metcalfe S.E., Brenner M., Moreland M., Freeman M. // Climate change as the dominant control on glacial - interglacial variations in C3 and C4 plant abundance // Science 2001. V. 293. P. 1647-1651. 64. Huang Y., Street-Perrott F.A., Perrott R.A., Meitzger P., Eglinton G. Glacialinterglacial environmental changes inferred from molecular and compoundspecific δ 13C analyses of sediments from Sacred Lake, Mt. Kenya // Geochim. et Cosm. Acta 1999. V.63. P. 1383-1404. 65. Hunt J.M. Petroleum geochemistry and geology of oil and gas. Moscow: Mir. 1982. 66. Igamberdiev A.U. Roussel M.R. Feedforward non-Michaelis-Menten mechanism for CO2 uptake by Rubisco: Contribution of carbonic anhydrases and photorespiration to optimization of photosynthetic carbon assimilation // BioSystems 2011. V.107 P. 158-166. 67. Igamberdiev A.U., Lea P.J. Land plants equilibrate O2 and CO2 concentrations in the atmosphere // Photosynthesis Research 2006. V. 87. P. 177-194. 68. Igamberdiev A.U. Ivlev A.A., Bykova N.V., Threlkeld Ch., Lea P.J., Gardestrom P. Decarboxylation of glycine contributes to carbon isotope fractionation in photosythetic organisms// Photosynthesis Research. 2001 V. 67. P. 177-184. 69. Ivlev A.A. Oscillatory nature of metabolism and carbon isotope distribution in photosynthesizing cells Oscillatory nature of metabolism and carbon isotope distribution in photosynthesizing cells // Photosynthesis - fundamental aspects / ed. Najafpour M.M. Intech Publishers. Croatia. 2012. P.341 – 366. 70. Ivlev A.A. Isotope fractionation and cell mechanisms of carbon metabolism in photosynthesizing cell // RGAY–MSKhA of Timiryazev. Moscow. 2008 71. Ivlev A.A. On the flows of light and heavy carbon during photosynthesis and photorespiration coupling // Russ. J. Plant Physiol. 1993. V. 40. P. 752-758. 72. Ivlev A.A. About discreteness of the process of CO2 light assimilation by C3plants // Biofizika 1989. V. 34. P. 887-891. 73. Ivlev A.A. Fractionation of carbon isotopes in living cells and stages of biological evolution // Zh. Zh. Obshch. Biol. 1986. V. 47. P. 514-601. 74. Ivlev A.A., Fractionation of Carbon Isotopes in Processes of Organism Life Activities at Different Phases of the Earth Geological History, Zh. Obshch. Biol. 1980, V. 41. P. 901-916. 75. Ivlev A.A., Igamberdiev A.Y., Dubinsky A.Yu. Isotopic composition of carbon metabolites and metabolic oscillations in the course of photosynthesis // Biophysics 2004. V. 49. Suppl. 1. P. 3 - 16. 76. Ivlev A.A., Voronin V.I. The mechanism of carbon isotope fractionation in photosynthesis and carbon dioxide component of the greenhouse effect // Biology Bulletin. 2007 V. P. 603-609.
62
A.A.Ivlev
77. Jahren A.H., Arens N.C., Harbeson S.A. Prediction of atmospheric δ13CO2 using fossil plant tissues // Rev. Geophys. 2008. V.46. (RG 1002. P. 1-12) 78. Khain V..Е. Tectonics of continents and oceans. M.: Scientific World, 2001. 79. Korchagin V. I. General Stratigraphic Scale and Distribution of Oil and Gas Deposits by Stratifications of Subdivisions of Phanerozoic and Precambrian, Table Composed Based on Acting Stratigraphic Lowbook. Moscow. 2001. 80. Kothavala Z., Oglesby R.J., Saltzman B. Sensitivity of equilibrium surface temperature of CCM3 to systematic changes in atmospheric CO2 // Geophys. Rev. Lett. 1999. V.26. P. 209-212. 81. Krouse H.R., Ueda A. Contents and sulphur isotope composition of trace sulphate and sulphide in various rock types // Appl. Geochem. 1987. V.2. N1. P. 127-131. 82. Lenton T.M., The role of land plants phosphorous weathering and fire in the rise and regulation of atmospheric oxygen // Global Change Biol. 2001. V.7 P. 613-629. 83. Mackenzie F.T., Pigott J.D. Tectonic controls of Phanerozoic sedimentary rock cycling // J Geol Soc. London 1981. V. 138. P. 183-196. 84. Maksimov S.P., Kunin N. Ya., Sardonnikov N.M. Cyclicity of biological processes and oil-gas occurrence problem. M.: Nedra. 1977. 85. Malinovsky Yu. M. Annals of Biosphere M.: Nedra. 1983. 86. McElwain J.C., Beerling D.J., Wodward F.I. Fossil plants and global warming at the Triassic-Jurassic boundry // Science 1999. V. 285. P. 1386-1390. 87. Melander L Isotope effects on reaction rates M.: Mir Publisher. 1964. 88. Melander L., Saunders L. Reaction rates of isotopic molecules. A Wiley Interscience Publ. John Wiley & Sons, New York, Chichester, Brisbane, Toronto, 1980. 89. Meyen S.V. Basis of Paleobotany M.: Nedra. 1986. 90. Meinschein W.G., Rinaldi G.G., Hayes J.M., Schoeller D.A. Intramolecular isotopic order in biologically produced acetic acid // Biomed mass-Spectrometry 1974. V. 1 P. 172-174. 91. Monin A.S. Istoriya Zemli (History of Earth) Leningrad: Nauka. 1977. 92. Neruchev S.G. The periodicity of great geological and biological events in Phanerozoic // Geology and Geophysics (russ.) 1999. V.40. № 4. P. 493-511. 93. Oehler D.Z., Schopf J.W., Kvenvolden K.A. Carbon isotopic studies of organic matter in Precambrian rocks // Science. 1972. V.175. P. 1246-1248. 94. Oparin A.I. Life, Its Nature, Origin, and Development. M: Nauka. 1960. 95. Osborne D.Z., Chaloner W.G. Evolution of leaf form in land plants linked to atmospheric CO2 decline in late Paleozoic era // Nature. 2001.V. 410. P. 352-354. 96. Osmond C.B., Bjorkman O. Pathways of CO2 fixation in the CAM-plants Kalanchoe daigremontiana II. Effects of O2 and CO2 concentration in light and dark CO2 fixation // Aust. J. Plant Physiol. 1975. V.2. P. 155-166. 97. Park R., Epstein S. Carbon isotope fractionation during photosynthesis // Geochim et Cosmochim. Acta 1960. V.21.P. 110-119. 98. Peters, K.E., Walters, C.C., Moldowan J.M. The Biomarker Guide. Vol. 1. Biomarkers and Isotopes in the Environment and Human History, Cambridge Univ., 2007.
Interaction of chemical and biological evolutions
63
99. Рорр B.N., Takigiku R, Hayes J.M., Louda J.W., Baker E.W. The post- Paleozoic chronology and mechanism of 13C depletion in primary marine organic matter // Am.J.Sci.1989. V. 289. P. 436-454. 100. Ratnayake N.P., Suzuki N., Okada M., Takagi M. The variations of stable carbon isotope ratio of land plant-derived n-alkanes in deep-sea sediments from the Bering Sea and the North Pacific Ocean during the last 250 000 years // Chem. Geology 2006. V. 228. P. 197-208. 101. Raup D.M. Species diversity in the Phanerozoic: a tabulation // Paleobiol. 1976a V. 2. P. 279-288. 102. Raup D.M. Species diversity in the Phanerozoic: an interpretation // Paleobiol. 1976b. V. 2. P. 289-297. 103. Raup D.M., Sepkowski J.J. Periodicity of extinctions in geological past // Proc. Natl. Acad. Sci. 1984. V. 81. P. 801-805. 104. Raup D.M., Sepkowski J.J. Periodic extinction of families and genera // Science 1982. V. 231. P. 833-836. 105. Retallack G.J. A 300-million-year record of atmospheric carbon dioxide from fossil plant cuticules // Nature 2001. V. 411 P. 287-300. 106. Raven J.A. Plant response to high O2 concentrations - relevance to high O2 episodes // Global Planet Change 1991. V. 97. P. 19-38. 107. Ronov A. B, Volcanism, Carbonate accumulation, Life. The regularities of global geochemistry of carbon // Geochemistry (russ.) 1976. №8. P. 1252-1279. 108. Rothman D.H. // Global biodiversity and the ancient carbon cycle // Proc. Natl. Acad. Sci USA 2001. V.98. P. 4305-4310. 109. Royer D.L., Wing S.L., Beerling D.G.,Jolley D.V., Koch P.L., Hickey L.J., Berner R.A. Paleobotanical evidence for near present-day levels of atmospheric CO2 during part of the Tretiary // Science 2001. V.292. P. 2310-2313. 110. Rutten M.G. The origin of life by natural causes. Amsterdam, London, New York Elsevier Publ. Co., 1971. 111. Rye R, Holland H.D. Paleosols and the evolution of atmospheric oxygen: a crtical review // Am. J. Sci. 1998. V. 298. P. 621-672 112. Sage R.F. The evolution of C4 photosynthesis // New Phytol. 2004. V.161. P. 341-370. 113. Sage R.F., Coleman J.R. Effects of a low atmospheric CO2 on plants: more than a thing of the past // Trends Plant Sci.2001. V.6. P. 16-24. 114. Schopf J.W., Oehler D.Z., Horodysky B.H., Kvenvolden K.A. Biogenecity and significance of oldest known stromatolites // J. Paleontol. 1971. V.45. P. 477-485. 115. Sidorenko A.V., Borschevskii Ju.A. General tendencies in evolution of isotope composition of carbonates in Precambrian and Phanerozoic // Dokl. AN SSSR 1977.V. 234. P. 892-896. 116. Smith J.W., Schopf J.W., Oehler D.L., Horodyski R.H., Kvenvolden K.A. Biogenecity and significance of the oldest known stromatolites // J. Paleont. 1971. V. 45. P. 477-485. 117. Smith J.W., Schopf J.W., Kaplan I.R. Extractable organic matter in Precambrian cherts // Geochim et Cosm. Acta 1970. V. 34. P. 659-675.
64
A.A.Ivlev
118. Shaw M.R., ZavaletaE.S., Chiariello N.R., Cleland E.E., Mooney H.A., Field C.B. Grassland responses to global environmental changes suppressed by elevated CO2 // Science 2002. V.298. P. 1987-1990. 119. Shnoll S.E. Physicochemical factors of biological evolution. Hardwood Academic Publishers GmbH. The Netherlands. 1981. 120. Stenier R.Y., Adelberg E.A., Ingraham J.L. The bacterial world. Prentice-Hall, Englewood Cliffs 1976. 121. Tcherkez G., Cornic G., Bligni R., Gout E., Ghashghaie J. Respiratory metabolism of illuminated leaves depends on CO2 and O2 conditions // Proc. Natl. Acad. Sci. USA 2008. V.105. P. 797-815. 122. Thode H., Shima M., Rees C., Krishnamurty K. Carbon-13 isotope effects in systems containing carbon dioxide, bicarbonate, carbonate and metal ions // Canadian J. Chem. 1965. V. 43. N3. P.582-593. 123. Thode H.G., Monster J., Dunford H.B. Sulfur isotope geochemistry // Geochim et Cosmochim. Acta 1961. V. 25. P. 159-264. 124. Thode H.G., Harrison A.G., Monster . Sulphur isotope fractionation in early diagenesis of recent sediments of northest Venezuala // Bull. Am Ass. Petr. Geol. 1960. V. 44. P. 1809-1814. 125. Tissot B.P., Welte D.H. Petroleum formation and occurrence. Berlin - Heidelberg - N.Y. Springer - Verlag. 1978. 126. Tolbert N.E., Benker C., Beck E. The oxygen and carbon dioxide compensation points of C3 plants: Possible role in regulating atmospheric oxygen // Proc. Natl. Acad. Sci. 1995. V. 92. P. 11230-11233. 127. Yankowich P.E., Promislev A.L. Carbon isotope constitution of some acetic acids // J Am. Chem. Soc.1953. V. 75. P. 4881-4882. 128. Vail P.R., Mitchum Jr. R.M., Thompson S. Seismic stratigraphy and global changes of sea level, 4. Global cycles of relative changes of sea level // Met Am. Assoc. Petrol. Geol. 1977. V. 26. P. 83- 97 129. VernadskyV.I. Isotopes and “living” matter // Dokl. AN SSSR 1926. December. P. 215-220. 130. Vyshemirskii V.S., Kontorovich A.E. Cyclic character of oil accumulation in Earth history // Geol. & Geofiz. 1997. V. 38. P. 907-918. 131. Wendt Y. Fractionation of C isotopes and its temperature dependence in the system CO2(gas) - CO2(solution) and HCO3- in solution // Earth planet Sci. Lett. 1968. V. 4. P. 132-147. 132. Wildman R.A., Hickey L.J., Dickinson M.B., Berner R.A., Robinson J.M., Dietrich M., Essenhigh R.H., Wildman C.B. // Burning of forest materials under late Paleozoic high atmospheric oxygen levels // Geology 2004. V. 32. P. 457-460. 133. Wingler A. , Lea P.J., Quick W.P., Leegood R.C. Photorespiration: metabolic pathways and their role in stress protection // Phil. Trans. R. Soc. (London) B. 2000. V. 355. 1517-1529. 134. Woodward F.I. Stomatal numbers are sensitive to increases in CO2 from preindustrial levels // Nature 1987. V. 327. P. 617-618. 135. Uspenskii V.A. Introduction in petroleum geochemistry L.: Nedra. 1970
Interaction of chemical and biological evolutions
65
136. Yahren A.H., Arens N.C., Harbeson S.A. Prediction of atmospheric δ13C CO2 using fossil plant tissues // Rev. Geophys. 2008. V. 46. RG1002, doi: 10.1029/2006RG000219. 137. ZavaletaE.S., Hobbs R.J., Mooney H.A. Viewing invasive species removal in a whole-ecosystem context // Trends Ecol. Evol. 2001. V.16. P. 454-459. 138. Zavaleta E.S., Shaw M.R., Chiariello N.R., Mooney H.A., Field C.B. Additive effects of simulated climate changes, elevated CO2 and nitrogen deposition on grassland diversity // Proc. Natl. Acad. Sci. USA 2003. V.100. P. 7650-7654.
Chemical Evolution vs Biological Evolution: Coupling Effect and Consequences Author Author Alexander A. A. Ivlev Ivlev Alexander


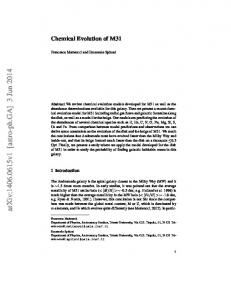


![[PDF] Download Chemical Evolution: The Biological ... - Google Sites](https://m.moam.info/img/260x300/pdf-download-chemical-evolution-the-biological-goo_647745b9097c47a9708b86f6.jpg)