Proceedings of 201 0 International Conference on Systems in Medicine and Biology ... (SVM) classifier is used to detect the epileptic signal from the.
Proceedings of 2010 International Conference on Systems in Medicine and Biology 16-18 December 2010, liT Kharagpur, India
Classification of EEG Signal Using Wavelet Transform and Support Vector Machine for Epileptic Seizure Diction JR. Panda, 2P, S. Khobragade, 3P, D. Jambhule, 4S. N Jengthe,P.R.Pal 5T. K. Gandhi JDept. BiomedicalEngineering, Trident Academy of Technology, Orissa 2Dept. Biomedical Engineering, National Institute of Technology, Raipur 3Dept. Electronic & Telecommunication, Govt. Engineering College, Aurangabad 4Dept. of Computer Science, G. H Raisoni College ofEngg, Ahmednagar 5Center for Bio-Medical Engineering, llT-Delhi
of
visual scoring of the epileptic activity on the EEG background
electroencephalogram (EEGs) signals for (normal and
is very costly as well as time consuming task. More ever due
Abstract-
Feature
extraction
and
classification
scientists.
to human error, leads to improper diagnosis of the diseases
Various signal processing techniques have already been
causing fatal to human life. Now a day's effort has been
proposed
devoted by engineers and researchers to develop an automated
epileptic)
is
a
challenge
for
for
classification
engineers of
and
non-linear
and
non
stationary signals like EEG. In this work, SVM (support
expert system for the detection of seizure and epilepsy which
vector machine) based classifier was employed to detect
might be helpful for speed up the detection and cure of
epileptic
epilepsy [1], [3], [11].
seizure
activity
encephalographs
(EEGs).
(healthy
with
subject
condition, region)
epileptic,
were
eye for
decomposed
DWT
till
5th
background
types
open
seizure
selected
preprocessed, transform
from Five
by level
from
of
signals
eye
close
hippocampal
analysis. using
electro
EEG
condition,
signal the
of
Signals
discrete
were
wavelet
decomposition
tree.
Various techniques were employed for the detection of seizures in the EEG using correlation function, time domain analysis, frequency domain analysis, time-frequency domain analysis, artificial neural network based analysis, fuzzy logic based
analysis
(Oeak,2008b;
lasemidis,
Shiau,&
Chaovalitwongsa, 2003; Khan & Gotman, 2003). Seizure
standard
detection in time domain analysis involve two stages; in first
used
for
stage, features are extracted from EEG signals from both
classification of signals. The results show the promising
epileptic and normal subjects and in the second stage the
Various
features
deviation
were
like
energy,
computed
and
entropy
and
consequently
classification accuracy of nearly 91.2% in detection of
expert system is created for detection of epileptic activity with
abnormal
proposed
high accuracy in less time. The features obtained from these
classifier can be used to design expert system for epilepsy
stages were decomposed at each node of the tree. However,
from
normal
EEG
signals.
This
the EEG is non-stationary in nature, is most appropriate to use
diagnosis purpose in various hospitals.
wavelet transform (time-frequency based) to get the time as Keywords: Vector
Electroencephalogram
Machine
(SVM),
Discrete
Support
well as the frequency information of the signal simultaneously
Transform
[1],[2],[5]. It also helps to accurately capture and localize
(EEGs), Wavelet
transient
(DWT), Epileptic, Seizure.
features
of
the
epileptic
signal
on
the
EEG
background. In this work an algorithm based on Daubechies Discrete
I. INTRODUCTION
Epilepsy
is
the
neurological
disorder
in
which
the
Wavelet Transform (DWT-db2) and Support Vector Machine
abnormal firing activity of neurons can be seen which leads to
(SVM) classifier is used to detect the epileptic signal from the
the formation of seizure [1], [2]. It is mostly seen in the
EEG signature. The DWT is used for time frequency analysis
children and adults at the age 65-70 and at about 1% of
giving quantitative evaluation of different frequency bands of
worldwide population affected by this disease and it can be
clinical brain wave. The EEG epochs were decomposed into
cured if it detected in initial stages .Eighty percent of the
various frequency bands by using db2 mother wavelet up to
epileptic seizure activity can be controlled or can be treated
5th-level of the decomposition. The statistical parameter like
effectively, if detected and diagnosed properly (Cited in
energy, entropy and standard deviation were computed for
WHO,
the
feature extraction, the feature seats were used to train the
epileptic
machine using Support Vector Machine classifier to classify
http://www.who.intltopics/epilepsy/enJ).
developing
countries
like
India
percentage
of
In
patients are seen in more amount but there is lack of proper
the normal and epileptic signal.
diagnosis technique. Traditionally, the EEG recordings were visually
inspected
by
the
trained
neurophysiologist
for
II. THE EEG DATA COLLECTION USED IN THE
detecting epileptic seizure or other abnormalities present. The
10:75
978-1-61284-038-3/10/$26.00 ©2010 IEEE
RESEARCH
405
Proceedings of 2010 International Conference on Systems in Medicine and Biology 16-18 December 2010, liT Kharagpur, India 00
500 epochs of EEG data from five different brain activities (Each group contains 100 signals) were obtained from the data base
under
the
supervision
of
trained
neurologist.
different human activities used for the measuring the brain
(Z),
activity were Eye close (0), Eye open from
hippocampal
region
(N),
EEG
Seizure (S), EEG
from
opposite
-00
The where
cj(k)
and
dj(k)
are,
respectively,
the
scaling
(approximation) and wavelet (detail) coefficients. In the
of
OWT, the frequency axis is divided into dyadic intervals
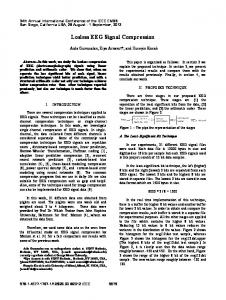
epileptogenic zone (F). The data are collected according to
towards the lower frequencies while the bandwidth length
international 10-20 system shown in figure.I with sampling
decreases exponentially [13].
rate of 173Hz on 26.36sec time duration. The WT can be implemented with a specially designed pair A
B
Vertex
20%
of FIR filters called a quadrature mirror filters (QMFs) pair which separate the high- and low-frequency components of the input signal. The dividing point is usually halfway between 0 Hz and half the data sampling rate (the Nyquist frequency) [10]. The outputs of the QMF filter pair are de sampled by a factor of two. The original signal is passed to the pairs of QMF filter and emerges as two signals. The signal passed through the low-pass filter is called the approximation (A) and includes the high-scale (low-frequency) components. The signal passed through the high-pass filter is called the detail
(D)
and
contains
the
low-scale
(high-frequency)
components [2], [3], [14]. The low-frequency (low-pass) filter output is fed into another identical QMF filter pair. This operation can be repeated recursively as a tree or pyramid algorithm,
yielding
a
group of signals that divides
the
spectrum of the original signal into octave bands with successively coarser measurements in time as the width of each spectral band narrows
Fig.l. International system of electrode placement
signal, (0-86.5 Hz), is decomposed into its higher resolution
We used Wavelet transform method to decompose the signals and reconstruct the information accurately. Wavelet transform method is a suitable analytical tool for the Non Stationary signals analysis such as EEG and it was proposed by Jean Morlet a French geophysicist in 1982[5]. It involves the breaking down of the brain signals into various shorter reads of bands as per requirement. In discrete wavelet analysis, a multi-resolution description is used to decompose a given signal f(t) into increasingly finer details based on two sets of basic functions [9], the wavelets and the scaling functions, as follows:
f(t) =
I :z
components,
(43.25-86.5
components,
(0--43.25
decomposition,
the
Hz)
Hz).
In
low-resolution
and
lower
the
second
component
resolution level is
of
further
decomposed into higher resolution components, (21.62--43.25 Hz)
and
lower
resolution
components,
(0-21.62
Hz).
Following this process, after fifth levels of decomposition, the components obtained are (0-2.7 Hz), (2.7-5.4 Hz), (5.4-10.81 Hz), (10.81-2l.62 Hz), and (2l.62--43.25 Hz) [3].The entire quantitative
analysis
of
EEG
signals
was
coded
using
MATLAB and the Wavelet Toolbox (The Mathworks, Inc., Natick, MA).
(IJ
LL/1: dj(k) , (2jt-k)
L/I: Cj (k)T (2j t-k)+
frequency
fifth level. After the first level of decomposition, the EEG
III. METHODOLOGY
3.1. Wavelet Transform for Signal Analysis:
}-1
and decreases in
[IO].As per this matched the EEG signal is decomposed in to
(1)
}=c K=C
3.2. Feature extraction: In this work we have chosen the statistical parameters like energy, entropy and standard deviation were calculated at each decomposition level starting from 02 to 05 for the all
where functions
. c:p (t)
and
lJ1 (t)
are the basic scaling and
mother wavelet respectively. In the above expansion, the first summation presents an approximation of f(t) based on the scale index of
jll ,
while the second term adds more details
using larger j (finer scales). The coefficients in this wavelet expansion are called the discrete wavelet transform (OWT) of the signal f(t). When the wavelets are orthogonal [9], these coefficients can be calculated by 00
Cj i"C
=
let) rp (2h
-
k)d t
categories of signals. The energy indicates the strength of the signal as it gives the area under the curve of power at any interval of time. The energy of EEG signal offmite length is given by: I','
En er{))' E
..
J
=
2)D[j 1 2
f =
1,2. 3
"
.... l
(4)
}=l
2
-00
10:75
406
Proceedings of 2010 International Conference on Systems in Medicine and Biology 16-18 December 2010, liT Kharagpur, India
Entropy is numerical measure of uncertainty of outcome
possible. We make the mean of our all combination which is
where signal contained thousands of bits of information. The
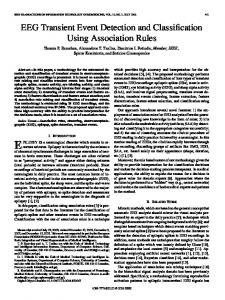
show in following table I where
mathematical representation is: .' En trop-y
(E. )
=
I Di�;
log
Table -1
(Di� )
f
1,2 ... l
=
5
mean observati on for all five types of singnal
} =11. Standard deviation in one word it is 'mean of mean' it is
statistic that tell which tell how closely various features are
USI NG DIFi c ERBIT OIID ER$
d
� ..
USING DIFFERENT
1
2
3
4
5
'.
J
8
�
10
mean
S3
�
93
91
!iI3
92
�
�1
go
9l
91.2
78
f4
80
85
85
as
85
85
as
85
ioU
7
15
7,
7
5
77
79
1>2
82
82
n_ !l
f5I
61,
S3
Eo
61
f5I
B6
a.
1'15
�o
a6
1'15
HQ.2
7�
14
7;
7.
4
75
7.
19
81
82
0..
89
S3
as
f5I
.9
80
9D
91
91
92
EM
P ROPE RTIE S
near to mean.
6
X is random variable with mean fl ;','
"!:" J:
L
n,� J.
f
1,2 ,
=
.
..
,
.
l
1
ENERG Y
2
EtlTROI'Y
3
STD. OE\IIA1l0N
4
ENERGY &. EtlTROI'Y
7
} = 1. IV. CLASSIFICATION USING SVM
TECHNIQUE
After feature extraction, feature matrix is normalized in order to have features in a same range. Simply, linear SVM classifier was trained by the train-train data and then used for
ENERGY &. STD.
5
OE\IIAll O N
•
EtlTROPY& STD. ON
1
ENERGY. EtlTROI'Y& STD. ON
classifying the train-test data. SVMStruct trains a SVM classifier using Training, a matrix of training data taken from two groups; test the classifier with other groups. Information about the trained SVM classifier is returned in SVMStruct, a structure with the Kernel Function fields [4],[6].
Kernel
Function Value is Gaussian Radial Basis Function kernel ('rbf) function handle with a scaling factor, sigma, of 6. This kernel linearly maps samples into a higher dimensional space
DE\IIAll
DE\IIAll
'En' stands for Energy, 'Ent' stands for entropy and 'Sd' stands for standard deviation.
so it, unlike the linear kernel working in high dimensional feature spaces solves the problem of expressing complex function.the multidimensional linear classifier use for neural classification for better accuracy. This task was performed using MATLAB. For the purpose of training, MATLAB code "svmtrain" was used, while for classification, MATLAB code "svmclassify" was used.
VI. CONCLUSION
An
expert
model
was
developed
for
detection
of
epilepsy on the background of EEG by using discrete wavelet transform and support vector machine. The feature like energy, entropy & standard deviation were extracted from the EEG signal. From the training and testing on the proposed classifier it is finding that energy is the best feature among all which gives accuracy about 91.2% and time required is just 0.5 second. This expert model can be successfully mounted in
V. RESULT AND DISCUSSION
real time diagnosis in hospitals of the developing countries
In present work to fmd maximum accuracy we train and test the extracted features of the signal. we make the different
like India where acute shortage of train neurologist and proper diagnostic technique for epilepsy detection.
combination of wavelets bands because while plotting the normal
and
epileptic
signal
it
is
seen
that
the
signal
REFERENCES
accumulated in specific frequency band .in these combination
[1] Seizures and Epilepsy: Hope through Research National
of wavelets band we train and test signal with various feature
Institute of Neurological Disorders and Stroke (NINDS),
like energy, entropy and standard deviation. We also make
Bethesda,
combination of feature of these signals as shown in table from
http://www.ninds.nih.govlhealth
these observation it is find that energy feature give the
and epilepsy_htr. htm
maximum
[2] H. Adeli, Z. Zhou, and N. Dadmehr, "Analysis of EEG
accuracy
91.2%
require just
0.5
second
for
MD,
2004
[Online]. and
Available:
medical/pubs/seizures
processing also energy and standard deviation shows the
records in an epileptic patient using wavelet transform, " J.
better accuracy 83.34%.
Neurosci. Meth., vol. 123,no. 1, pp.69-87, 2003.
Table of result:
[3] Adeli, H., Ghosh-Dastidar, S., Dadmehr, N., "A Wavelet
In this work, using SVM classifier and different features of
Chaos Methodology for Analysis of EEGs and EEG Sub
signal like energy, entropy & standard deviation in various combination, we found that the diagnosis of epilepsy is
10:75
407
Proceedings of 2010 International Conference on Systems in Medicine and Biology 16-18 December 2010, liT Kharagpur, India
bands to Detect Seizure and Epilepsy", IEEE Transactions on Biomedical Engineering, Vol. 54, No. 2, February 2007. [4] "Feature Extraction and Classification of EEG Signals Using
Wavelet
Transform,
SVM
and
Artificial
Neural
Networks for Brain Computer Interfaces", Proceedings of International Joint Conference on Bioinformatics, Systems Biology and Intelligent Computing, pp.352-355,2009. [5] Subasi, A., "EEG signal classification using wavelet function extraction and a mixture of expert model', Expert System with Application, 32,1084-1093, 2007. [6] Petrosian, D. Prokhorov, R. Homan, R. Dascheiff, and D. Wunsch, II, "Recurrent neural network based prediction of epileptic
seizures
in
intra-
and
extracranial
EEG,"
Neurocomputing, vol. 30, no. 1-4, pp. 201-218, 2000. [7] Iasemidis, L. D., Shiau, D. S., Chaovalitwongsa, W., "Adaptive
epileptic
seizure
predication
system",
IEEE
Transaction Biomedical Engineering, 50(5), 616--627, 2003. [8] Kannathal, N., Choo, M. L., Acharya, U. R., & Sadasivan, P. K., "Entropy for detection of epilepsy in EEG", Computer Methods and Programs in Biomedicine, 80, 187-194, 2005. [9]. C. S. Burrus, R. A. Gopinath, and H. Guo, Introduction to wavelets and wavelet transforms: A primer. Prentice-Hall, Upper Saddle River, NJ, 1998. [10] Gandhi, T., Panigrahi, B.k, Bhatia, M., Anand, S. "Expert model for detection of epileptic activity in EEG signature", Expert Systems with Applications, vol.37, pp.3513-3520, 2010. [II] P.R. Pal, R. panda, "Classification of EEG signals for epileptic seizure evaluation", Proceedings of the 20I0 IEEE Students' Technology Symposium, liT Kharagpur, vo1.25, pp72-76,2010. [12] L. D. Iasemidis, L. D. Olson, J. C. Sackellares and R S. Savit, "Time dependencies in the occurrences of epileptic seizures: A nonlinear approach, "EpilepsyRes., vol. 17, pp. 81-94, 1994. [13] A. S Zandi, G. A. Dumont, M. Javidan, R. Tafreshi, B. A. MacLeod, C. R. Ries, and E. Puil, "A Novel Wavelet Based Index to Detect Epileptic Seizures Using Scalp EEG Signals", 30th Annual International IEEE EMBS Conference Vancouver,
British
Columbia,
Canada,
voLl,
pp.919-
922,2008. [14] Khan, Y. U., & Gotman, J., "Wavelet based automatic seizure detection in intracerebral electroencephalography", Clinical Neurophysiology, 114, 898-908, 2003. [15] Pavlopoulos, S., Istepanian, R. S. H., Kyriacon, E., Koutsounis, D., "Optimal wavelet biosignal compression for mobile multipurpose telemedicine", In Proceedings of IEEE EMBS international conference on information technology application in biomedicine. doi: 10.1109/ITAb.2000.892360.
10:75
408