Conducted Emission Variations Using Low Power LED Lamps Connected to Other Devices Miguel Limas
Daniel Agudelo-Martinez
Jan Bacca Rodr´ıguez
Andr´es Pavas
[email protected]
[email protected]
[email protected]
[email protected]
Abstract—In this paper, an analysis of the emissions of an LED lamp is performed, when it is connected in parallel with electrical devices of linear and non-linear behavior. The objective is to determine if the presence of other loads connected in the same installation can cause a change in the emissions of the LED lamp. A measurement assembly and a test electrical network are built to perform the measurements of voltage and current emissions generated by the LED lamp between 1 Hz and 250 kHz. Incandescent, CFL and LED lamps of different power and technology are used as test loads. The analysis of results indicates that the increase of devices connected in parallel to an LED bulb can in general reduce the current THD. However, there are components in the current emission that increase their RMS value.
I. I NTRODUCTION In recent years the use of LED lamps has increased due to advances in lighting technology. Features such as power low consumption, a higher power factor, a greater luminous efficacy and a longer lifetime, have made LED technology to displace CFL and incandescent lamps rapidly. An investigation conducted in 2013 [1] has found that the emissions of LED lamps have a similar frequency spectrum to that of the CFL lamps below 150 kHz. However, the presence of other devices in the same electrical installation changes the magnitude of the voltage and current emissions generated by the LED lamp. For this reason, the conducted emission should be considered as a joint emission related to the impedance of the total installation. Therefore, it is necessary to measure the conducted emission of the lamps in the presence of other electrical devices to identify the impact of this technology.
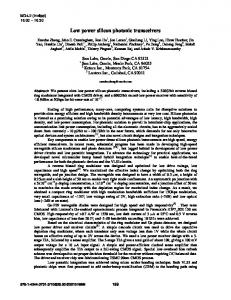
Fig. 1. Block Diagram LED Lamp
Figure 1 presents the block diagram of an LED lamp. The basic circuit consists of a wave rectifier or AC/DC converter. It is usually a rectifier bridge with a ripple filter capacitor at the D. Agudelo-Mart´ınez, M.Limas and A. Pavas are with Universidad Nacional de Colombia and the PAAS-UN Research Group. J. Bacca is with CMUN Research Group. A. Pavas and J. Bacca are Professors with Universidad Nacional de Colombia.
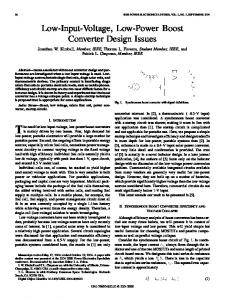
output [2], and a Current regulator which provides a constant current for the operation of the LED module. The circuits implemented in the current source range from a series resistor to DC-DC switching converters (Buck, Buck-boost, Flyback) [3][4]. The use of wave rectifiers and converters generates harmonics that are injected to the source, as well as a reduction in power factor. Lamps greater than 25 W and complying with IEC 61000-3-2 must correct the power factor and the harmonic emission [5]. Then, a power factor correction circuit (PFC) is installed in the lamp, which is usually installed between the wave rectifier and the constant current source. Among the circuits that are implemented are the Valley Fill circuit or the power supply controller with corrected power factor [6]. More robust lamps have an EMC filter at the AC/DC converter input which decreases lamp emissions above 150 kHz, but other emissions below this frequency can be identified [7]. In some paper such as [8-11] consider the emission source circuit. This paper analyzes the variations in the voltage and current emissions of an LED lamp with Bridge rectifier and Flyback converter. To reduce the number of measurements, low voltage applications are commonly available with LED lamps such as: devices that do not generate current emissions, such as incandescent bulbs, and those that generate current emissions, such as compact fluorescent bulbs (CFL) and LED lamps from another topology. An individual and parallel measurement is made to the reference LED lamp and the test lamps in order to determine the THD variations of voltage and current. II. M EASUREMENT SYSTEM SETUP The measurement setup is presented in Figure 2, as performed in [12]. The test consists of measuring the voltage and current emissions generated by an LED lamp when loads with incandescent bulb, CFL and LED lamps are connected in parallel. The measurements are made between 1 Hz and 250 kHz. The acquisition of voltage and current signals is done in the time domain using the DEWETRON-3040 TM power analyzer configured at a sampling rate of 1 MS/s. The signal is sampled in a one second interval to ensure the acquisition of more than 12 periods with a supply voltage of 120 Vrms at 60 Hz. For the acquisition of the current signals a Pearson 110 current clip is used with a sensitivity of 0.1 V/A. Other details such as low pass filters, accuracy of the measurement system and data processing are presented in greater detail in [13]. An Uninterruptible power supply (UPS) Galleon 3K (L) TM is used as a power grid simulator to provide a 120 V voltage.
Tests performed on the UPS found a voltage variation of less than 0.5 % and a voltage THD of less than 3.0 % without charge. An approximation to the output impedance of 0.61 Ω at 60 Hz was also calculated. Table I lists the lamps used for the test, the nominal electrical parameters, as well as the type of power supply, are indicated. These characteristics are taken into account in the results to determine the contribution to the emission of the reference LED lamp.
The results indicate that the harmonic components below 2 kHz are the ones that have a major contribution to Current emissions. Also, an emission band between 2 kHz to 45 kHz can be identified with a variation in magnitude between 0.2 to 13.2 mA, where the highest magnitude component is 19.2 kHz. The frequency coincides with the harmonic 320 of the 60 Hz signal, then this signal is repeated every 19.2 kHz reducing its magnitude, during the measurements it was possible to identify the signal up to 242 kHz, the components of 19.2 kHz and 38.4 kHz are also perceived in the voltage spectrum as shown in the figures 5 and 6. This result suggests that current harmonics can be greater than 100 kHz. Also, the band above 2 kHz that was detected is a combination of harmonics and noise generated by the components of the reference LED lamp.
Fig. 2. Measurent system setup
TABLE I L IST OF LAMPS FOR Device Reference LED Lamp Incandescent Lamp LED Lamp 1 LED Lamp 2 CFL Lamp
THE TEST
Specifications Led luminaire 18 W circuit: Bridge rectifier with Flyback converter. Incandescent bulb 60 W, 500 mA LED bulb 5 W circuit: Bridge rectifier with Flyback converter. LED bulb 5 W circuit: Bridge rectifier with power supply controller and PFC CFL bulb 42 W circuit: Electronic ballast
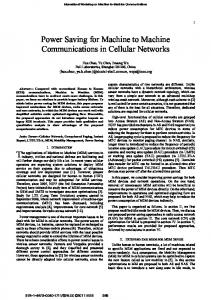
Fig. 3. Voltage spectrogram for reference LED lamp. Color bar [dBV]
III. R ESULTS AND ANALYSIS First, the electrical parameters of an 18 W LED lamp are measured as reference in the following tests. The spectrograms of voltage and current for a cycle main above 2 kHz are presented in Figures 3 and 4, respectively. The current signal is not constant throughout the cycle main and its shape varies according to the supply voltage. As indicated in [14], the current emission having this form can be classified as Time-Variant Continuous Noise synchronous to AC mains. This shape of emission is typical of applications that use rectifiers in the power supply but adequate smoothing of the voltage signal is not performed. A method of detecting bands as presented in [7] is used to determine the spectral emission ranges of the LED reference lamp. Figure 6 shows the spectral current components between 1 Hz to 2 kHz (harmonics) and 2 kHz to 250 kHz (Supraharmonics). The electrical parameters of the reference LED lamp are presented in table II. The calculation of the total THD is done according in (1). 2 2 2 T HDtotal = T DH≤2kHz + T DH>2kHz
(1)
Fig. 4. Current spectrogram for reference LED lamp. Color bar [dBA]
A. Spectral characteristics of the lamps Table II shows the measurement of the electrical parameters of the reference LED lamp connected in parallel to the 60W incandescent lamp which behaves as a linear load. When comparing with the individual measurement of the reference LED lamp, a reduction of 5.2 mA (-3.1 %) in the RMS value of the fundamental current component, as well as of the Total
TABLE II S PECTRAL CHARACTERISTICS FOR LED
97.67 1.84 136.6 106.4 78.51
THD in 4.0 % due to the reduction of harmonics below 2 kHz. For current THD above 2 kHz an increase of 4.4 % is observed, but when examined in more detail it was determined that this increase in THD is caused by the decrease in the current of the fundamental component, then the emissions above 2 kHz are kept constant. For the voltage of the fundamental component as well as emissions generated below 2 kHz a 1.3 % increase is observed, while the emissions above 2 kHz are varied 0.1 % so they can be assumed as constant.
RMS Value [V]
Spectrum (SIGNAL IN LF)
50
RMS Value [V]
T HDV [%] 1.60 2.08 1.36 1.32 3.16
T HDV ≤ 2 kHz [%] 1.53 2.03 1.29 1.23 3.12
T HDV > 2 kHz [%] 0.46 0.44 0.44 0.46 0.53
Spectrum (SIGNAL IN LF) 200 100 0 0
0.5
1 1.5 Frequency [kHz] Spectrum (SIGNAL IN HF)
2
30 20 10 0 0
50
100 150 Frequency [kHz]
200
250
Fig. 7. LED reference lamp in parallel to incandescent lamp
0 0
0.5
1 Frequency [kHz]
1.5
2
B. Measurement of applications that generate conducted emissions
0.4 0.2 0 0
50
100 150 Frequency [kHz]
200
250
Fig. 5. Spectral components of the Voltage for the reference LED lamp
Spectrum (SIGNAL IN LF) RMS Value [mA]
V rms 60 Hz [V] 120.3 120.1 120.3 120.3 120.5
L AMP
100
Spectrum (SIGNAL IN HF)
RMS Value [mA]
T HDI > 2 kHz [%] 35.58 0.44 62.54 102.1 18.78
RMS Value [mA]
LED Lamp reference Incandescent Lamp LED Lamp 1 LED Lamp 2 CFL Lamp
T HDI ≤ 2 kHz [%] 90.96 1.78 121.5 29.95 76.23
T HDI [%]
RMS Value [mA]
Individual Individual Individual Individual Individual
Irms 60 Hz [mA] 167.5 494.4 38.32 124.1 376.0
AND I NCANDESCENT
200 100 0 0
0.5
1 1.5 Frequency [kHz] Spectrum (SIGNAL IN HF)
2
30 20 10 0 0
50
100 150 Frequency [kHz]
200
250
Fig. 6. Spectral components of the current for the reference LED lamp
In order to determine the contribution of the test bulbs to the change in emissions of the reference LED lamp, the individual measurement of LED 1, LED 2 and CFL light bulbs is carried out first. Then, the reference LED lamp is measured in parallel to each of the test bulbs. Finally, the measurement is carried out with two bulbs in parallel. The electrical parameters of individual light bulb measurements as well as the parallel measurement of the reference LED bulb are given in Table III. • Measurement LED lamp 1: Corresponds to the lamp with a bridge with capacitive divider and flyback converter. Measurements show that emissions current below 2 kHz generate a distortion greater than 100.0 %. On the other hand, the voltage distortion level is less than 2 %. Figure 8 shows the current spectrum where harmonic emissions are detected up to 57 kHz. Above 2 kHz 4 emission bands are identified with the highest peak values being about 19 kHz. Other emission bands above 100 kHz are detected not to exceed 2.1 mA. • Measurement LED lamp 2: The circuit is composed of a bridge rectifier with power supply controller and power factor corrected. In Figure 9 shows that the largest current emissions are above 2 kHz being the greater peak of 71.0 mA. On the other hand, the emissions below 2 kHz are attenuated quickly, this is due to the operation of the PFC that decreases the emission of harmonics. The total THD
20 0 0
0.5
1 Frequency [kHz]
1.5
2
RMS Value [mA]
Spectrum (SIGNAL IN LF) 400
RMS Value [mA]
RMS Value [mA]
Spectrum (SIGNAL IN LF) 40
15
200 0 0
0.5
2 50
100 150 Frequency [kHz]
200
250
Fig. 8. Spectral1components of the current for the LED lamp 1
RMS Value [mA] RMS Value [mA]
Spectrum (SIGNAL IN LF) 150
75
100 50 0 0
0.5
1 Frequency [kHz]
1.5
2
Spectrum (SIGNAL IN HF) 50 25 0 0
50
100 150 Frequency [kHz]
2
200
250
Fig. 9. Spectral1components of the current for the LED lamp 2
of the lamp is greater than 100.0% due to components that are above 2 kHz, which are the main source of the distortion. The voltage THD is 1.32 % as indicated in the table III. • Measurement CFL lamp: The CFL 42 W lamp is composed of an electronic ballast. In figure 10 shows that the harmonic components reach up to 1,5 kHz and are the ones that have the greatest contribution to the total current THD. Above 2 kHz, 5 emission bands with a width between 7 kHz and 30 kHz are detected, emissions are perceived up to 240 kHz. The total THD voltage is 3.12% due to harmonic emissions. According to the results and taking into account the power consumption, the CFL lamp is the one that generates greater emissions of voltage and current in comparison to the test LED lamps. • Measurement of the reference LED lamp in parallel to the test lamps: In figures 11 to 12 the current spectrum of the reference LED bulb in parallel to each of the test lamps is presented. Figure 13 shows the current spectrum when two lamps (LED 1 and CFL) are placed in parallel with reference LEDs. The table II presents the electrical parameters of the bulb and the variation of THD in each one of the measurements. According
10 5 0 0
50
100 150 Frequency [kHz]
200
250
Fig. 10. Spectral components of the current for the CFL Lamp
to the results it is observed that the electrical parameters of the reference LED bulb present variations when changing each test lamp. The first thing to note is a 5 mA decrease in the fundamental component current. These measurements correspond to the incandescent bulb (60 W load) and the LED bulb 1 and CFL (50 W power). On the other hand, the measurements of the reference LED in parallel with the LED bulbs (5 W of power) generate smaller variation of the fundamental component. During the measurements, the output voltage of the UPS presented a variation smaller than 0.1 V. Then the measured decrease in the current is not caused by variations of the voltage of the source so we assume that there is a proportional relation Between the load power connected in parallel to the reference LED lamp and a decrease in the current of the fundamental component. Spectrum (SIGNAL IN LF) RMS Value [mA]
4
0 0
1.5
Spectrum (SIGNAL IN HF)
6
RMS Value [mA]
RMS Value [mA]
Spectrum (SIGNAL IN HF)
1 Frequency [kHz]
200 100 0 0
0.5
1 1.5 Frequency [kHz] Spectrum (SIGNAL IN HF)
2
30 20 10 0 0
50
100 150 Frequency [kHz]
200
250
Fig. 11. LED reference lamp in parallel to LED bulb 1
During the measurements, the voltage of the source does not vary more than 0.1 V (0.1% of the supply voltage). In consequence, this decrease in current is not caused by variations in the voltage of the source and there is a relationship between the power of the load in parallel to the reference LED lamp and a decrease in the current of the fundamental component. A reduction of the current THD below 2 kHz
TABLE III S PECTRAL CHARACTERISTICS OF THE REFERENCE LED
Individual LED Lamp reference LED Lamp reference connected Incandescent Lamp LED Lamp ref + LED Lamp 1 LED Lamp ref + LED Lamp 2 LED Lamp ref + CFL Lamp LED Lamp ref + LED Lamp 1 + CFL
Irms 60 Hz [mA] 167.5
LAMP IN PARALLEL TO THE TEST LAMPS
97.67
T HDI ≤ 2 kHz [%] 90.96
1.60
T HDV ≤ 2 kHz [%] 1.53
162.3
95.68
86.92
39.99
120.2
2.86
2.83
0.44
167.8 167.5 162.7
96.74 96.64 91.13
89.33 90.71 83.38
37.14 33.31 36.79
120.1 120.2 120.2
2.77 2.02 3.19
2.74 1.97 3.16
0.45 0.45 0.47
161.8
91.17
83.04
37.62
120.3
3.01
2.97
0.47
T HDI [%]
T HDI > 2 kHz [%] 35.58
V rms 60 Hz [V] 120.3
T HDV [%]
Spectrum (SIGNAL IN LF) RMS Value [mA]
100
0.5
1 1.5 Frequency [kHz] Spectrum (SIGNAL IN HF)
20 10 50
100 150 Frequency [kHz]
200
100
0 0
2
30
0 0
200
250
RMS Value [mA]
RMS Value [mA]
RMS Value [mA]
Spectrum (SIGNAL IN LF) 200
0 0
T HDV > 2 kHz [%] 0.46
Fig. 12. LED reference lamp in parallel to LED bulb 2
0.5
1 1.5 Frequency [kHz] Spectrum (SIGNAL IN HF)
2
30 20 10 0 0
50
100 150 Frequency [kHz]
200
250
Fig. 13. LED reference lamp in parallel to Lamp CFL
RMS Value [mA]
is observed in all the measurements made. Similar to the measurement of the fundamental component, the one with the greatest harmonic reduction is the measurements with the incandescent lamp and the lamp assembly LED 1 and CFL. A more detailed observation determines that the CFL lamp is the one that generates the greatest reduction of current harmonics in the reference LED lamp, while the harmonics remain almost constant with the LED lamps 1 and 2. Emissions and current THD above 2 kHz show a different behavior than emissions below 2 kHz. It was found that the greater the current emission above 2kHz of the test lamp, the lower the current THD above 2 kHz of the LED reference lamp. On the other hand, the current spectrum of Figures 11 to 14 presents a considerable increase in the 18 kHz to 19 kHz band. Then, although the emissions decrease above 2 kHz when connecting a load in parallel, there are components that can increase in magnitude. For this case, the highest recorded peak was presented in the incandescent lamp and CFL (22 mA and 18 mA, respectively). For the measurement of the voltage THD, the specifications of the UPS, which indicate a value less than 3.0 %, are taken into account. Then, the measured voltage emission is within the tolerance range of the source. However, there is an increase in the magnitude of the voltage THD below 2 kHz compared to the individual measurement. The measurement that presented the greatest increase was the LED reference lamp in parallel to the CFL of up to 1.6 %. For the measurement with two lamps
RMS Value [mA]
Spectrum (SIGNAL IN LF) 200 100 0 0
0.5
1 1.5 Frequency [kHz] Spectrum (SIGNAL IN HF)
2
30 20 10 0 0
50
100 150 Frequency [kHz]
200
250
Fig. 14. LED reference lamp in parallel to CFL+LED bulb
in parallel (LED 1 and CFL) a THD increase of 1.4 % is observed. This result suggests that an increase in loads does not imply an increase in the voltage emission. The voltage THD for emissions above 2 kHz showed few variations with an average value of 0.45 %.
IV. C ONCLUSION An analysis of the emission variations conducted in voltage and current for an LED lamp was carried out. The results indicate that if there is a variation in the current emission of the LED lamp when connecting other devices to the same electrical installation. A decrease of up to 6.0 % in the current THD was observed when the power of the load connected in parallel increased by 35 W. On the other hand, an increase in the magnitude of certain components in frequency above 2 kHz was identified. With these results it can be concluded that although the current emitted by the LED lamp decreases when connecting other devices in parallel. There are bands in frequency of the current emission that can increase its magnitude influenced by the emissions and impedance of the loads connected in parallel. On the other hand, the emissions in the voltage can increase according to the individual emission of the devices connected to the electrical installation. ACKNOWLEDGMENT The authors would like to thank the support received from Universidad Nacional de Colombia, the research Groups PAAS-UN, and CMUN. The present work has been partially funded by the Program J´ovenes Investigadores convocatoria No. 706 de 2015, the authors would like to acknowledge COLCIENCIAS for their granted support. R EFERENCES [1] R¨onnberg, S. (2013). Emission and interaction from domestic installations in the low voltage electricity network, up to 150 kHz (Doctoral dissertation, Lule˚a tekniska universitet). [2] R. J. Bravo and N. Y. Abed, ”Experimental evaluation of the harmonic behavior of LED light bulb,” 2013 IEEE Power & Energy Society General Meeting, Vancouver, BC, 2013, pp. 1-4. doi: 10.1109/PESMG.2013.6672991 [3] J. M. Alonso, J. Vina, D. G. Vaquero, G. Martinez and R. Osorio, ”Analysis and Design of the Integrated Double Buck–Boost Converter as a High-Power-Factor Driver for Power-LED Lamps,” in IEEE Transactions on Industrial Electronics, vol. 59, no. 4, pp. 1689-1697, April 2012. doi: 10.1109/TIE.2011.2109342 [4] D. Gacio, J. M. Alonso, A. J. Calleja, J. Garcia and M. Rico-Secades, ”A Universal-Input Single-Stag2e High-Power-Factor Power Supply for HB-LEDs Based on Integrated Buck–Flyback Converter,” in IEEE Transactions on Industrial Electronics, vol. 58, no. 2, pp. 589-599, Feb. 2011. doi: 10.1109/TIE.2010.2046578 [5] IEC 61000-3-2 ”Electromagnetic compatibility (EMC) - Part 3-2: Limits - Limits for harmonic current emissions (equipment input current ≤ 16 A per phase)”,2014 [6] J. H. Kim, D. Y. Cho, J. P. Hong and G. W. Moon, ”Boost integrated flyback AC-DC converter with valley fill circuit for LED light bulb,” Proceedings of The 7th International Power Electronics and Motion Control Conference, Harbin, China, 2012, pp. 457-462. doi: 10.1109/IPEMC.2012.6258910 [7] F. A. Karim, M. Ramdhani and E. Kurniawan, ”Low pass filter installation for reducing harmonic current emissions from LED lamps based on EMC standard,” 2016 International Conference on Control, Electronics, Renewable Energy and Communications (ICCEREC), Bandung, 2016, pp. 132-135. doi: 10.1109/ICCEREC.2016.7814966 [8] Gil-de-Castro, A., R¨onnberg, S. K., & Bollen, M. H. (2017). Light intensity variation (flicker) and harmonic emission related to LED lamps. Electric Power Systems Research, 146, 107-114. [9] T. Busatto, F. Abid, A. Larsson, M. H. J. Bollen and G. Singh, ”Interaction between grid-connected PV systems and LED lamps: Directions for further research on harmonics and supraharmonics,” 2016 17th International Conference on Harmonics and Quality of Power (ICHQP), Belo Horizonte, 2016, pp. 193-197. doi: 10.1109/ICHQP.2016.7783479
[10] S. K. R¨onnberg and M. H. J. Bollen, ”Emission from four types of LED lamps at frequencies up to 150 kHz,” 2012 IEEE 15th International Conference on Harmonics and Quality of Power, Hong Kong, 2012, pp. 451-456. doi: 10.1109/ICHQP.2012.6381216 [11] R¨onnberg, S. K., Bollen, M. H., Amaris, H., Chang, G. W., Gu, I. Y., Kocewiak, Ł. H., ... & Desmet, J. (2017). On waveform distortion in the frequency range of 2kHz–150kHz—Review and research challenges. Electric Power Systems Research, 150, 1-10. [12] D. A. Mart´ınez and A. Pavas, ”Current supraharmonics identification in commonly used low voltage devices,” 2015 IEEE Workshop on Power Electronics and Power Quality Applications (PEPQA), Bogota, 2015, pp. 1-5. doi: 10.1109/PEPQA.2015.7168230 [13] D. Agudelo-Mart´ınez, M. Limas, A. Pavas and J. Bacca, ”Supraharmonic bands detection for low voltage devices,” 2016 17th International Conference on Harmonics and Quality of Power (ICHQP), Belo Horizonte, 2016, pp. 1003-1009. doi: 10.1109/ICHQP.2016.7783327 [14] “Wiley: Power Line Communications: Theory and Applications for Narrowband and Broadband Communications over Power Lines - Hendrik C. Ferreira, Lutz Lampe, John Newbury, et al.”2010 pp. 87-89.