Proceedings of the 37th Hawaii International Conference on System Sciences - 2004
Digital Artifacts for Remembering and Storytelling: PostHistory and Social Network Fragments Fernanda B. Viégas1 danah boyd2 David H. Nguyen3
[email protected] [email protected] [email protected] Jeffrey Potter4 Judith Donath1
[email protected] [email protected] 1
MIT Media Laboratory 20 Ames Street Cambridge, MA 02138 USA
2 University of California, Berkeley – SIMS 102 South Hall Berkeley, CA 94720 USA
Abstract As part of a long-term investigation into visualizing email, we have created two visualizations of email archives. One highlights social networks while the other depicts the temporal rhythms of interactions with individuals. While interviewing users of these systems, it became clear that the applications triggered recall of many personal events. One of the most striking and not entirely expected outcomes was that the visualizations motivated retelling stories from the users’ pasts to others. In this paper, we discuss the motivation and design of these projects and analyze their use as catalysts for personal narrative and recall.
1. Introduction Our dependence on objects is not only physical but also, more important, psychological. Most of the things we make these days do not make life better in any material sense but instead serve to stabilize and order the mind. – Csikszentmihalyi [6: 22]
It has been argued that objects are essential for maintaining a coherent sense of self, as they have the ability to embody goals and make skills manifest and shape the identity of their users [5][6][16]. When sharing our stories, we often use artifacts as props to relay our experiences. Photographs and the conversational reminiscing they provide generate situations where personal identities and social relationships can be articulated and shared [11][20]. Also, by associating previous experiences with an object, the object becomes infused with personal meaning and, therefore, valuable both as a souvenir and as a tangible marker of past times and places.
3 College of Computing Georgia Tech Atlanta, GA 30332-0280 USA
4 Atof, Inc. Box 398035 Cambridge, MA 02139 USA
As our lives and experiences become more digital, the records of our experiences become less tangible. Yet, our appreciation for social artifacts does not diminish. Even online, people want access to the kinds of tools that provide snapshots of their social existence. Web traffic monitors allow people to see patterns in their hits and visitors, while new social technologies, such as blogs and Friendster.com allow people to articulate and share their social networks. The popularity of these sites suggests that people find tools that provide them with slices of their social experiences online useful and desirable, even if only out of passing curiosity. While some sites generate artifacts about people’s public digital experiences, little has been done concerning one’s more private digital activities. Yet, private venues such as email and instant messaging capture some of the most meaningful social interactions that people have online every day. The quantity of data alone is massive, with the average user receiving and sending approximately 29 messages per day (in 2001) [14]. Although almost all online users participate in email [15], most of the records of these social interactions are lost or cluttered. As individual messages are usually the only artifact of most email conversations, users have no way of seeing any of the higher level patterns of the social interactions in which they participate. This is problematic because people’s mental model of email exchanges does not correspond to unrelated individual messages [7]. In this paper, we present two projects that provide an alternative approach to accessing and deriving meaning from email archives. PostHistory and Social Network Fragments are visualization tools that allow users to access the higher-level patterns of one’s email habits. Although initially intended as tools for
0-7695-2056-1/04 $17.00 (C) 2004 IEEE
1
Proceedings of the 37th Hawaii International Conference on System Sciences - 2004
uncovering social patterns in email archives, PostHistory and Social Network Fragments turned out to be useful for self-reflection. Moreover, users felt compelled to tell stories around the data they saw in their visualizations and, in some cases, users became eager to share these visualizations with friends. We begin by discussing our intentions in designing these systems and then briefly outline their implementation. We then analyze users’ reactions to the visualizations of their data. We conclude this paper with a discussion about the importance of understanding email archives not only as raw data repositories but also as powerful objects with which to think about issues of identity and memory.
2. Intentions Patterns in email usage are often inaccessible to users because the available archives provide little descriptive detail. As such, we set out to uncover three dimensions of email patterns: 1) social networks, 2) email exchange rhythms, and 3) the role of time in these patterns. In presenting email data, we sought a user-centric approach, focused on providing the user with lasting impressions about their social interactions in email. We wanted to uncover the irregularities that the user would recognize: vacation habits and surprising connections between clusters of friends, for instance. In addressing these questions, we analyzed the social patterns that can be derived from the FROM, TO, CC, SUBJECT, and DATE headers present in both messages sent to and those received by the user. We tracked mail traffic as opposed to mail content. As we discuss later, this approach has both merits and serious limitations.
2.1 Why visualize? Previous work on understanding online social interaction has shown that visualization techniques are important aids in helping users and researchers understand social and conversational patterns in other online interactions [3][9][13][18]. Yet, unlike the related work in this area, our design approach is purely centered on the owner of the email account. Rather than focusing on how researchers or the public could understand an individual’s behavior, we designed and developed a set of systems that emphasize the social data relevant to the individual whose email archive is being visualized. A user-centric, impressionistic visualization approach diverges from the traditional social visualization approaches. Because the majority of visualizations are intended for external analysis and
evaluation, the common goal is to maximize the analyst’s ability to comprehend other people’s behavior. The strength of a visualization tool is normally evaluated via its effectiveness as a device for information retrieval. Alternatively, we argue that the value of our approach lies in providing users with the means to explore personal self-awareness through the exploration of their data patterns on the screen.
2.2 Visualize what? Both PostHistory and Social Network Fragments focus on two major dimensions of email archives: people and time. Even though both visualizations reveal the email social landscape of the user at different points in time, they do so in very different ways. PostHistory focuses on the social world of dyadic email relationships whereas Social Network Fragments explores the groupings of people that emerge within a person’s social network as seen through email exchanges. Both systems have mechanisms to show how social worlds evolve over time. Because of their distinct approaches to email, these visualizations generate different insights, which frequently complement one another. In this section, we discuss the significance of the dimensions we chose to visualize in each of the systems. 2.1.1 Social Landscapes In sociology, one of the most fundamental and yet elusive concepts is that of the “group.” A special class of human grouping is the one termed “dyadic,” which refers to a group of two people. The reason this group is in its own category is that only dyadic relationships have no sense of collectivity. In all other groups, duties and responsibilities can be delegated whereas in the dyad, each participant is immediately and directly responsible for any communal action [17]. This category of human relationship permeates personal spaces, including that of email where the majority of conversations are only a few messages long and usually include only two people [10]. PostHistory focuses on this specific aspect of the user’s social world: the users’ direct interactions with each of the contacts in their email world. In contrast to the dyadic focus of PostHistory, Social Network Fragments reveals a world of social collectivities. People participate in a variety of social groups, such as those ranging from gatherings of work colleagues to college pals to extended families. By portraying the structure of an individual’s social network and the known connections between one’s relations, Social Network Fragments unveils the disparate nature of one’s social clusters. Such
0-7695-2056-1/04 $17.00 (C) 2004 IEEE
2
Proceedings of the 37th Hawaii International Conference on System Sciences - 2004
clustering is indicative of how one segments the facets of one’s identity depending on social context [4]. 2.1.2 Time and Change Time is a major structural factor in our lives. We pace ourselves by the hour, sometimes by the minute. Not only does time structure our lives, it instills our daily activities with meaningful rhythms. As anthropologists have long recognized, human practices are defined by the fact that their temporal structure, direction, and rhythms are constitutive of their meaning [2]. The same is true of our computer-mediated interactions: they are temporally structured and, as such, defined by their tempo. Recent work on email rhythms [1] [19] has demonstrated that people are highly sensitive to the rhythms of email exchange, as they are quite sophisticated and diligent in the coordination between receiving and sending messages. PostHistory grounds its entire visualization scheme in the notion of time, expressing long-term email exchange rhythms within an interface that is structured through a calendar. The system visualizes the amount of email exchanged over time with each person the user knows, revealing large concentrations of interaction during certain periods in contrast to times when almost no email was exchanged. The application also visualizes how changing rhythms of email exchange affect the social landscape of the user. Social Network Fragments uses time to emphasize how connections between one’s correspondents emerge and dissolve. Thus, by using the system, users can grasp the evolution of one’s social clusters. By presenting one’s relationships and social network over time, the system also allows users to recognize when the context of a given relationship changed (i.e. when a work colleague became connected with one’s social community).
3. PostHistory In PostHistory, we were mainly interested in two dimensions of email: 1) time and 2) dyadic relationships with ego (the owner of the email account). By visualizing email activity along these two axes, we hoped to highlight interesting patterns that reflect the changes in interaction between ego and their contacts over time such as: 1) 2) 3) 4)
How does the frequency of email exchange differ from one dyadic relationship to the next? What are the rhythms of email exchange in the different relationships? What does the entire landscape of egocentric, dyadic ties looks like? How does it evolve over time? Is there a sense of periphery x centrality in the distribution of these dyadic ties? (i.e. What is the core
of people with whom ego corresponds? How big/small is this core? Does the constitution of this core of people change over time?)
3.1 Implementation In order to reveal the temporal and social dimensions mentioned above, PostHistory preaggregates data on the following dimensions: 1) Daily email averages (i.e. how many messages a user sends and receives per day and on average?) 2) Daily "quality" of emails (i.e. on a given day, are most of the messages sent directly to the owner of the account, or are they sent to mailing lists to which the owner subscribes?) 3) Frequency of email exchanges with contacts (i.e. has “Mary” exchanged more/less email with me today than usual?) 4) Comparative frequency of email exchanges with contacts (i.e. how does my email exchange with “Mary” compare to the rest of my email activity with other contacts in my social network?)
3.2 Interface The PostHistory interface is divided into two main panels: the calendar panel on the left, which shows the intensity of email exchanges over time, and the “contacts” panel on the right, which shows the names of the people with whom ego has exchanged email [Fig. 1]. The calendar panel displays email activity on a daily basis. Each square represents a single day and each row of squares represents a week’s worth of email activity. Each week row starts on Monday and ends on Sunday so that both week and weekend activities can be seen as contrasting, adjacent visual units. Month names are shown on the right of week rows and each day’s number is displayed above the day’s colored square. PostHistory shows an entire calendar year at any given time, and the number of the year is shown at the bottom. The size of each square represents the quantity of email received on that day. PostHistory determines the average number of emails a person receives on a given day and uses this average to determine the size of each daily square. Days with less than average numbers of message are portrayed as small squares, while heavy email traffic days are shown through large squares. Each square is centralized inside its grid cell and, as squares get bigger or smaller – in a pattern reminiscent of halftone – the overall density pattern they create is readily perceived as the gradation of intensity in email exchanges over time.
0-7695-2056-1/04 $17.00 (C) 2004 IEEE
3
Proceedings of the 37th Hawaii International Conference on System Sciences - 2004
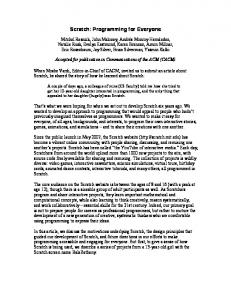
Fig 1. PostHistory interface with calendar panel on the left and contacts panel on the right. A contact name has been highlighted and the corresponding emails sent by this person have been highlighted in yellow on the calendar pane
The second dimension used in the calendar visualization is color, which represents how “personal” or “directed” to the user the messages have been on that particular day. Messages where the only recipient is the user get tagged as “highly directed.” Messages where the user is one of several recipients – i.e. their email address appears in conjunction with other email addresses – get tagged as “somewhat directed.” Finally, messages where the user’s email address does not appear – for instance, messages sent to mailing lists to which the user subscribes – get tagged as “not directed at all.” PostHistory computes the “directedness” average of a day based on the rating of all messages on that day. The brighter the color of a given day, the more directed that day has been. The “contacts” panel on the right displays the names of the people who have sent messages to the user up to that point in time (i.e. the disposition of names is driven by the calendar panel). There are three visualization modes in the contacts panel: vertical [Fig. 1], circular [Fig. 2], and alphabetical. The vertical mode of the contacts panel displays ego’s name at the top of the panel; other people’s names are placed below it, such that the most frequent contacts are visually closest to ego. The circular mode works is similar to the typical circular egocentric diagrams first devised by sociologists looking at social networks [21]: ego’s name is displayed in the center of the diagram and contacts’ names surround it. The closer someone’s name is to the center of the diagram, the more email messages this person has exchanged with ego. The alphabetical mode presents a table of contacts’ names that can be sorted either by
Fig 2. PostHistory interface with the circular mode of the contacts panel on the right
alphabetical order or by the number of emails people have sent to ego.
3.3 Interaction Interaction with the PostHistory interface causes temporal patterns of email exchange to be highlighted. When the user clicks on a specific day on the calendar, the names of people who have sent email to ego on that day get highlighted on the contacts panel. After the user clicks on the name of a person on the contacts panel, yellow squares are displayed on top of each day in the calendar panel that the person has sent a message to ego. Each yellow square represents a message sent to ego by that person. The accumulation of yellow squares on the calendar panel creates a visual pattern that highlights times when email exchange was intense and contrasts times when the exchange between the two people was at its lowest levels. Finally, users can animate the passage of time in PostHistory to observe the changes in the landscape of names displayed in the contacts panel. Underneath the vertical and circular modes of the contacts panel, there are “play” and “pause” buttons that allows the user to animate the passage of time. In the time animation, each day gets momentarily highlighted, from the start of the chosen year to its end. Over the course of time, new names appear on the right panel indicating the beginning of email exchange with a new person. In the vertical mode of the contact panel, a contact’s name can move upwards – closer to ego – to reflect periods of more intensive email exchanges. If ego starts to work on a project with “Maria,” her name might move up a couple of levels very quickly during the time of the project and then subside again when the project is over. This creates a series of rhythms on the contacts panel – names moving
0-7695-2056-1/04 $17.00 (C) 2004 IEEE
4
Proceedings of the 37th Hawaii International Conference on System Sciences - 2004
Fig 3. In Social Network Fragments, the social network panel is on the left while the history panel is on the right.
up, staying stationary, moving down – that reflect the ebb and flow of ego’s evolving email relationships.
4. Social Network Fragments Social Network Fragments reveals the faceted contexts that people systematically create. To do so, the system derives a graph of social relationships by analyzing the recipients of emails using header data. Using this information, Social Network Fragments addresses the following questions: 1) 2) 3)
4) 5)
What is the visual structure of one’s social network? How do people segment their network into smaller clusters? When clusters form, are they connected via a common role or definable community - i.e. might you see clusters of extended family separated from college friends? Are there specific individuals that bridge disparate clusters of people together? How does one’s structure evolve over time? Do certain roles or communities of people dominate at different times?
To address these questions, we developed a language for discussing email connections and a method for articulating which people are associated with ego’s various roles and communities.
4.1 Structure In order to code email relationships, we defined five different types of relationship ties: - Knowledge ties. If A sends a message to B, A ‘knows’ B. (We do not assume that B knows A; we also do not assume that A knows B if the message went through a listserv.) - Awareness ties. If B receives a message from A that B is ‘aware’ of A.
Fig 4. Zooming into the social network panel reveals the structure and the people who operate as bridges.
- Weak awareness ties. If B and C both receive a message from A, B and C are ‘weakly aware’ of each other. - List awareness ties. If B receives a message from A through a listserv, B is ‘listserv aware’ of A. - Trusted ties. If A sends a message to B and blind carbon copies (BCC’s) D, A ‘knows’ and ‘trusts’ D. (We assume this because D has the ability to respond and reveal that A included D without B’s awareness.) These relationship rules are used to analyze a user’s email spool. In order to avoid duplication of individuals, we collapse multiple email addresses based on a set of rules given to us by the user. For each message, we evaluate the role of ego in a given message based on the email address used (i.e. work email, personal email, school email). If we know the role used in that email, we code the connections made during that message accordingly. The user may also specify known roles with specific people or groups. The manual and systematically calculated roles are used to determine the color of each message and connection. Relationship ties are stored in a matrix where each pairing is given a different weight for each time slices. The system pre-defines 24 time slices per year; each slice is approximately two weeks. For a given individual in a given period of time, we know the frequency of connections that they have to every other individual in the system along the aforementioned five types of ties. We also know the various role-based relationships that the individual has to the user in each message. In order to present the information, we first collapse this data into one tie strength per connection per time slice. We work directly with the user to determine the most appropriate weighting system for each of the five types of ties, determining how likely
0-7695-2056-1/04 $17.00 (C) 2004 IEEE
5
Proceedings of the 37th Hawaii International Conference on System Sciences - 2004
each type is to indicate a strong connection. Thus, if our user did not use BCCs to indicate trust, the weight of trust ties in the system would be weaker than if they had. In addition, we determine the average role between each person and ego, generating one color role per time period. Thus, if red indicates work relations and yellow indicates personal ones and messages are exchanged that are equally personal and work-related, the name will be colored yellow for that time slice. The matrix of connections is then used as input for a spring system algorithm, which attempts to maximize for ideal positioning of all people on a 2D plane. Those with tight bonds are pulled towards one another; those who do not know each other are repelled. The system settles when it minimizes the distance between tightly bonded individuals while maximizing the distance between unrelated individuals. The graphical layout determined by the spring system algorithm is the basis for the user interface.
4.2 User interface The user interface for Social Network Fragments is comprised of two different panels: the primary social network panel and a history panel [Fig. 3]. Social Network Fragments can be viewed as an interactive animation that shows how the data evolves over time; each second represents one day in the archive. The history panel depicts each time slice as a two squares. The outer square represents the number of awareness connections that occur during that time period while the inner square indicates the number of knowledge ties. As the animation moves over time, the current time slice is highlighted. When users click on a time square, the animation moves to that point in history and continues from there. The social network panel displays the results of the spring system. Clusters of people are collocated and interlinked. Only people who are actively communicating with ego during a given time slice are shown in this view and thus people come in and out of the image. The stronger an individual is tied to others and to the user, the larger the font size used. Color represents the primary role of communication between the individual and ego at that time. Users can click on an individual’s name and the history panel will shift to show just that person’s frequency of connections over the various time slices. Thus, the user can trace the patterns of different people over time. Also, by selecting a region of the network, one can zoom into the clusters, as seen in [Fig. 4]. This allows for close-up views of the network.
5. Small Evaluation: case studies While developing PostHistory and Social Network Fragments, we ran a small ethnographic evaluation with ten users, including some of the systems’ developers. All ten people had their own email data visualized. Out of the test users, two became our case studies because they provided us with extensive personal email archives that spanned five years (from 1997 to 2002). The evaluation users were 20-something students and young professionals. Seven of the ten were American and six of the ten were female. All users had over five years of experience with email, which they used daily. Both people in our case studies had their archives visualized by both applications and, as discussed below, took advantage of this simultaneous access when interacting with the systems. These two users interacted with the applications at various milestones during development and thus played with various renditions of the tools over the period of six months. Overall, each one had over ten hours of interaction with the visualizations. Unlike the users in the case studies, other evaluation users did not have the benefit of having their email archives visualized simultaneously by the two applications; mostly, they interacted with only one of the visualizations. Each one of these users had around two hours of interaction with one of the systems. As we were more interested in getting an ethnographic understanding of how these visualizations could be used as opposed to performing focused user tests, we opted not to have any set, directed tasks for users. Users were free to explore the visualizations for as long and in whatever ways they saw fit.
5.1 Users’ Reactions This section describes common themes that emerged out of users’ interactions with PostHistory and Social Network Fragments. We also highlight individual responses to the systems and address some of the concerns that emerged. When looking at Social Network Fragments, most users first passively observed the visualization animate over time, adjusting to the movement of the vast constellation of names displayed on the screen. Users would then focus on graphically interesting clusters and start exploring, usually by zooming in to see the various names in a tight group. In PostHistory, as the visualization is completely driven by time, there is no single “optimal” view, so users would start exploring the calendar panel and watch how the names of people would move in the contacts’ panel. Users would then identify bursts of email exchanges by the way these people’s names moved upwards in the social landscape
0-7695-2056-1/04 $17.00 (C) 2004 IEEE
6
Proceedings of the 37th Hawaii International Conference on System Sciences - 2004
panel. Sudden movements in the contacts panel would immediately prompt users to consider the events that caused those bursts to happen. Users readily utilized the visualizations to revisit past experiences and to reflect on their relationships with others. Usually, users were excited that they could recognize almost all the names on the screen. Identifiable names, by themselves, evoked memories. Because names are presented in clusters in Social Network Fragments, users had a group context in which to think about their relationships. Often, users felt compelled to explain what the relationships amongst the people in a cluster meant. This would almost always motivate the user to reminisce about past events and share stories that involved one or more of the people in the cluster. Some stories were focused on cluster formation while others focused on the relationships between different people or different clusters. People who bridged multiple clusters intrigued users and motivated them to explore further. Seeing the shapes that described long-term interaction patterns on PostHistory was often surprising to users. Having never seen her five years of email activity laid out all at once in front of her before, one of our users was simply stunned by the fact that the pattern of email exchange had evolved into a clear and consistent rhythm over the years. As she looked at her archive on PostHistory, she was surprised to see how different her email behavior was during weekdays as opposed to weekends. She was also taken aback by the number of emails she received everyday that were not directed specifically at her – i.e. emails to mailing lists (or spam). To our surprise, we found that the users in our case studies were frequently eager to share the stories prompted by the visualizations with the people involved. The stories that users conveyed to others and the depth of details communicated depended on their relationship with the person. In one of our case studies, the user found a selfcontained cluster (no links with any of the other clusters) and it turned out to be a collective of women that had helped support her in her early years at university via email. She sent the group a screen shot of the cluster as it was displayed in the visualization. “The list hadn't been used in well over two years, but the visualization prompted an impressive walk down memory lane, as people pointed out specific connections and why they emerged at that time […]. The little slice of history allowed the group to reconnect by providing the reminder of what had made us close in the first place. In a pleasant turn of events, that resurgence of connected energy rebuilt
relationships that hadn't been maintained in five years by providing a reason to meet in person and get to know one another again.” As users shared portions of the visualizations with friends, those friends valued the opportunity to learn about the user’s life. The partner of one of our users told us “I learned some little things about him that he had never mentioned before, like the fact that he was in a string quartet – suddenly there's a little cluster of names all one color off in the corner: 'Who are they?' I ask. 'Oh, that's the string quartet I was in.' 'You were in a string quartet?'” We were also surprised to find that users felt comfortable sharing not only the specific portions that concerned their friends, but also entire visualization overviews. There was a sense of sustained privacy even though hundreds of names were being displayed on the screen. “Most people I showed these to seemed to say ‘Oh, that's pretty!’ or ‘Wow, pretty cool.’ They could not, I felt, understand the stories behind the images; without my explanations it was almost useless.” Another user observed: “Sure, my closest friends could tell what those clusters were and why they were so significant to me. But very few people had access to all of the different social circles that I knew and maintained.” These testimonials seem to suggest that these visualizations kept just enough of the context needed for memory prompting and storytelling without spelling out the details. In other words, these visualizations seem to provide users with a comfortable balance between private and public boundaries. In PostHistory, users saw the “rise and fall” of many relationships: “I loved to see the pattern of my relationships with various lovers: intense conversation, then stability, then slowed down conversation and then !bam! no conversation (a.k.a. breakup). I saw my vacation habits, the intense (procrastination) email during the stressful periods of the school year.” Some users would animate the time aspect of PostHistory many times over to see the way the names on the contacts panel moved as time progressed. After looking at his data on both systems, one of our case study users remarked on the transient nature of his relationships: “In the broadest way, the visualizations made me very aware of the ephemeral nature of relationships and community […]. Observing how my relationships grew and died was fascinating.” PostHistory also highlighted the core group of relations and how this core evolved over time. “Seeing my social network in PostHistory makes me aware of how many people overall I know, and how few of them really count. It's fascinating to see how some of the stronger names (higher up on the screen) stay around
0-7695-2056-1/04 $17.00 (C) 2004 IEEE
7
Proceedings of the 37th Hawaii International Conference on System Sciences - 2004
for a long time, bobbing up and down occasionally; how some of them faded away slowly while others crashed instantly.” Social Network Fragments allowed users to reflect on qualitative changes of their supportive social world over the years. In one of our case studies, a user reflected on the staggering changes in his social landscape as it evolved from his university years to his first years as a young professional: “I remember looking at the difference in my social world from school, then my first job. It really struck me how much my entire landscape changed during these transitions.” In both of our case studies, users made extensive use of both systems simultaneously, going back and forth between them. For example, when users spotted an interesting cluster of people in Social Network Fragments, they would turn to PostHistory to locate the patterns of intensive email exchange that made those people’s names coalesce into a single cluster. One of our users was able to trace how she got involved in a legal action concerning a group of people she met over one summer. She first saw the tight cluster of names in Social Network Fragments and turned to PostHistory to confirm when her exchanges with that group of people had taken place. In such cases, users repeatedly used one system to confirm and contextualize the other.
5.2 Concerns After using PostHistory, some users complained about the inability to go back into the calendar panel and annotate important dates/events; they felt that after they had located meaningful periods of activity, they wanted to highlight those in some way for future reference. The vertical mode of the contacts panel was a lot more legible to users than the circular mode; users felt that comparisons in the vertical mode were a lot easier to track than in the circular display. Some users wanted to have PostHistory either linked to the actual email messages it represents or have it show the subject lines of the messages being visualized so that people could get an idea of the content of the exchanges shown on the screen. This reaction suggests that there might be multiple levels at which users are interested in interacting with these visualizations: the high-level patterns of social interaction that evolve over time could serve as a map for accessing “lower-level” contents of conversations. This possibility implies multiple levels of privacy and presentation for visualizations such as these. Users remarked on the overwhelming nature of the Social Network Fragments overview visualization, usually mentioning the high number of names
displayed on the screen and the difficulty of reading them before zooming into specific clusters. They also had a hard time reading the meaning in the history panel beyond its use as time slices over years; they did not understand the coloring or the differently sized squares. Users also complained that they did not understand the static nature of the people’s geographic location in Social Network Fragments; they wanted people’s positions to change over time as they participated in different groups. While the coloring was effective for relational purposes, users were confused about its meaning and accuracy.
6. Discussion In developing PostHistory and Social Network Fragments, we focused on creating personally informative tools that provided high-level views of social interaction over time. We realized that our visualizations had a much broader appeal. Not only did they allow users to reflect personally, but they also operated as artifacts for sharing and storytelling. Whereas unanticipated uses for novel applications are not that startling – people often find surprising social ways of using software [12] – we feel it is important to incorporate both our design intentions and the uses that emerged from users’ interactions with the applications into the discussion. Some of the ways in which our users interacted with the visualizations are reminiscent of how people relate to photographs. People return to their photos to reflect on past experiences as well as to share aspects of their lives with others. Photographs themselves convey limited slices of the events they represent, but their presence allows the owner to convey as much or as little as they want in sharing the event represented. Although our stories are as deeply embedded in our email as they are in our photos, we rarely have access to any sort of “snapshot” of our email so as to have these deep reflections and storytelling opportunities. The higher-level view of our digital experiences is buried deep within the actual data. When users in our case studies began storytelling around the visualizations, we realized that these provided a missing link; they created a legible and accessible view for sharing and reflecting upon our digital experiences, without revealing too much. Since we started working on PostHistory and Social Network Fragments, other systems have emerged that give different kinds of access to people’s social interactions both online and offline. Of these tools, BuddyZoo most closely resembles our work – the system visualizes people’s social networks on instant messaging (IM). Even though the tool is fairly new and its use has been limited to a few college campuses,
0-7695-2056-1/04 $17.00 (C) 2004 IEEE
8
Proceedings of the 37th Hawaii International Conference on System Sciences - 2004
students’ reactions so far include gathering in groups around one terminal to compare their visualization results, explaining their visualizations to friends by indicating a cluster of people as being from home, from summer camp, etc. [8]. Although IM is considered a private mode of communication, some students published their BuddyZoo visualizations on their website. These reactions resonate with what we have observed in our own case studies. Given the opportunity to gain meaningful access to data about oneself, people want to explore it and then share it with others. A remarkable outcome of working with both systems presented in this paper is realizing how much meaning can be derived from the structural traces of email archives. Without having looked into what people were saying to one another, by simply focusing on patterns of email traffic, we were able to build two visualizations that made people conscious of social patterns they were not previously aware. For the most part, people were able to look at the patterns in the visualizations and explain the meaning behind the changes they saw over time without having to access the content of the individual messages. These results indicate that a structural approach to the social patterns of email exchange is a valuable research endeavor.
6.1 Privacy In designing the visualizations, we gave little consideration to privacy concerns because our targeted audience was the owner of the email account that was being visualized. As this was personal data, we felt that privacy was not an issue. However, although the user was part of every email interaction and thus has understandable access to those messages, the data available in those conversations implicates more than just that one individual. In Social Network Fragments in particular, not only is the user’s network easily accessible; portions of other people’s social networks are also made explicit by their connections to others in the visualization. In one of our case studies’ visualization, we recognized one of our colleagues in the graph. She had only ever briefly met our subject, but when we presented her with a screenshot in which she was present and linked to other people in a cluster, she was completely taken aback and reacted immediately by asking, “Where did you get that?!?!” When presented in an accessible manner, people can learn a great deal about themselves as well as their friends. Such realizations suggest that one’s personal data is not solely their own, but also offers insights into one’s acquaintances’ lives. Part of the reason why users did not seem feel as though the visualizations broke their privacy might be
because the names on the screen did not tell the complete story. As one user put it: “They are tools, props, for telling a story, but it requires a storyteller intimate with what the props are saying to relate events.” If users feel as though the data is publicly incomprehensible without explanation, the visualizations protect the aspects of the user’s life that are more intimate and allow one to evaluate what to share depending on who is getting to see the data.
6.2 Where to go from here Users’ reactions indicate that visualizations have the potential of transforming email archives into social objects of display that afford multiple levels of privacy. As our users interacted with their datasets in these applications they found no harm in sharing the visualizations with others and telling stories about the relationships they had with the different people displayed on the screen, which suggests a semi-public use of the data. We can envision an even more personal use of these archives if we were to link the visualizations to the actual email content and allow users to delve into their past messages, reading the conversations they had with people over the years. We see these distinct levels of data display as important next steps in transforming email archives into objects of social display that traverse a range of public and private contexts: 1) public display (obfuscated names, no content available), 2) semi-public display (real names, no content available), and 3) personal (real names and content available). One potential consequence of tailoring visualizations to the activity of sharing stories and memories with others is the creation of new forms of social capital. By inventing ways in which people can share images of their email social networks with others, we automatically create a way for people to compare themselves with one another. By visualizing social rhythms of email exchange, we transform things that were previously intangible into concrete images that can be displayed, compared and judged. This phenomenon is already happening with tools such as BuddyZoo. In a sense, these visualizations might have a broader social effect than our initial intent of self-reflection. While much meaning can be derived from the structure of email traffic, the content within messages provides a richer source of social context. Analysis of the content would allow us to more accurately determine the significance of a relationship. Meaningful connections are often based more on content than frequency; some people send many quick point-by-point messages or forward articles of interest, while others write long extended conversations that
0-7695-2056-1/04 $17.00 (C) 2004 IEEE
9
Proceedings of the 37th Hawaii International Conference on System Sciences - 2004
cover many points in one message. Content analysis would also allow us to more accurately tell the social context of the relationship, its formality and whether groups are being converged because of conversation or because of a shared activity.
7. Conclusion It is difficult to remember the quality and texture of past experiences… Without external props even our personal identity fades and goes out of focus” – Csikszentmihalyi [6: 22]
We have presented PostHistory and Social Network Fragments, two visualizations designed to reveal social patterns in email archives. Users’ reactions to these pieces indicate that visualizing one’s evolving email social landscape over time is meaningful because they allow the end user to reflect on long-term patterns which were not obvious before. The pieces also provided users with opportunities to share memories and to utilize the visualizations as storytelling props. While they may not be the kind of tools that people would use on a daily basis, PostHistory and Social Network Fragments provide the same type of artifacts as photographs. They allow individuals to remember their past and construct stories for sharing. Just as photographs allow individuals to begin relationships by having a mechanism for sharing information about one’s pasts, these visualizations provide a tangible link to one’s digital interactions. This work stemmed, in big part, from the notion that the current view of email archives as solely utilitarian repositories of data is outdated and needs to be reevaluated. We posit that something like one’s email history is actually very individual and organic; it is highly infused with personal meaning. Visualizations like the ones presented here provide users with accessible ways of looking at high-level patterns of their email exchange over time and, therefore, have the potential to enrich users’ sense of self as they get ever more engrossed in digital interactions. By representing a person through the collection of their social interactions, PostHistory and Social Network Fragments present a personal portrait of an individual through the context of their email interactions.
8. Bibliography [1] Begole, J. B., et al. 2002. “Work Rhythms: Analyzing visualizations of awareness histories of distributed groups.” In Proceedings of CSCW 2002, New Orleans, LA. [2] Bordieu, P. 1977. Outline of a Theory of Practice. Cambridge University Press. Cambridge, UK.
[3] boyd, d., Lee, H., Ramage, D., Donath, J. 2002. “Developing Legible Visualizations for Online Social Spaces" In Proceedings of HICSS-35 (Persistent Conversations Track; Big Island, HI; January 7-10). [4] boyd, d. 2002. “Faceted Id/entity: Managing Representation in a Digital World.” MIT Master’s Thesis. Cambridge, MA. [5] Csikszentmihalyi, M., and Rochberg-Halton, E. 1981. The Meaning of Things. Cambridge University Press, Cambridge, UK. [6] Csikszentmihalyi, M. 1993. “Why We Need Things.” In History from Things (edited by S. Lubar & W.D. Kingery), Smithsonian Institution Press. [7] Comer, D. and Peterson, L. 1986. “Conversation-based Mail.” In TOCS 4(4), ACM Press, 299-319. [8] D'Angelo, A. 2003, May 10. Email conversation with the creator of BuddyZoo. http://www.buddyzoo.com/ [9] Donath, J. 1995. “Visual Who.” In Proceedings of ACM Multimedia ’95 (San Francisco, CA, November 5-9). New York: ACM Press. [10] Hewett, J. and Teplovs, C. 1999. “An Analysis of Growth Patterns in Computer Conferencing Threads.” In Proceedings of CSCL 1999, Erlbaum, 232-241. [11] Middleton, D., and Edwards, D. 1990. Conversational Rememberings: A Social Psychological Approach. Collective Remembering. Sage Publications Ltd., London. [12] Morningstar, C. and Farmer, F. 1990. “The Lessons of Habitat.” In Cyberspace: First Steps (edited by Michael Benedikt), MIT Press. Cambridge, MA. [13] Nardi, B., Whittaker, S., Isaacs, E., Creech, M., Johnson, J., Hainsworth, J. 2002. “ContactMap: Integrating Communication and Information Through Visualizing Personal Social Networks.” Communications of the Association for Computing Machinery. April. [14] Pastore, M. 2001, July 25. “E-Mail Continues Dominance of Net Apps.” CyberAtlas (based on Gallup Poll Results). http://cyberatlas.internet.com/big_picture/ applications/article/0,1323,1301_808741,00.html [15] PEW Internet and American Life. 2002. “Internet Activities.” http://www.pewinternet.org/reports/ [16] Radley, A. 1990. Artefacts, Memory and a Sense of the Past. Collective Remembering. Sage Pub., London. [17] Simmel, G. 1908. “Quantitative Aspects of the Group,” in The Sociology of Georg Simmel Reissue edition, Free Press (June 1985). [18] Smith, M., Fiore T. 2001. "Visualization Components for Persistent Conversations." In the ACM Proceedings of SIG CHI 2001 (Seattle, WA; March 31-April 5), 136-143. New York: ACM Press. [19] Tyler, J., and Tang, J. 2003. “When Can I Expect an Email Response? A Study of Rhythms in Email Usage.” In Proceedings of ECSCW 2003. Helsinki, Finland. [20] Viégas, F. 2000. “Collections: Adapting the Display of Personal Objects for Different Audiences.” MIT Master’s Thesis. Cambridge, MA. [21] Wellman, B. 1997. “Structural Analysis: From Method and Metaphor to Theory and Substance.” In Social Structures: A Network Approach, CT: JAI Press.
0-7695-2056-1/04 $17.00 (C) 2004 IEEE
10