J. Microbiol. Biotechnol. (2010), 20(7), 1128–1133 doi: 10.4014/jmb.0907.07021 First published online 19 May 2010
Diversity and Abundance of Ammonia-Oxidizing Bacteria in Activated Sludge Treating Different Types of Wastewater Baek, Kyunghwa1, Chul Park2, Hee-Mock Oh1, Byung-Dae Yoon1, and Hee-Sik Kim1* 1
Environmental Biotechnology Research Center, KRIBB, Daejeon 305-806, Korea Department of Civil and Environmental Engineering, University of Massachusetts, Amherst, MA 01003, U.S.A.
2
Received: July 17, 2009 / Accepted: February 23, 2010
The diversity and abundance of ammonia-oxidizing bacteria (AOB) in activated sludge were compared using PCRDGGE and real-time PCR assays. Activated sludge samples were collected from five different types of wastewater treatment plants (WWTPs) mainly treating textile, paper, food, and livestock wastewater or domestic sewage. The composition of total bacteria determined by PCR-DGGE was highly diverse between the samples, whereas the community of AOB was similar across all the investigated activated sludge. Total bacterial numbers and AOB numbers in the aerated mixed liquor were in the range of 1.8×10¹⁰ to 3.8×10¹² and 1.7×10⁶ to 2.7×10¹⁰ copies/l, respectively. Activated sludge from livestock, textile, and sewage treating WWTPs contained relatively high amoA gene copies (more than 105 copies/l), whereas activated sludge from food and paper WWTPs revealed a low number of the amoA gene (less than 103 copies/l). The value of the amoA gene copy effectively showed the difference in composition of bacteria in different activated sludge samples and this was better than the measurement with the AOB 16S rRNA or total 16S rRNA gene. These results suggest that the quantification of the amoA gene can help monitor AOB and ammonia oxidation in WWTPs. Keywords: Ammonia-oxidizing bacteria, activated sludge, PCR-DGGE, real-time PCR, wastewater
Nitrification is an important biological process in nitrogen cycling and has a significant effect on effluent quality in wastewater treatment. Nitrification occurs in two steps by two types of chemoautotrophic bacteria that are distinguishable by their substrate. The oxidation of NH4+ to NO2- is performed by ammonia-oxidizing bacteria (AOB) belonging to the β- and γ-subgroups of the Proteobacteria, whereas the *Corresponding author Phone: +82-42-860-4326; Fax: +82-42-879-8103; E-mail:
[email protected]
oxidation of NO2- to NO3- is conducted by nitrite-oxidizing bacteria (NOB) [24]. The presence and activity of AOB was thought to be a rate-limiting step in the biological nitrification process [16]. Therefore, it is important to understand the ecology and microbial properties of AOB in wastewater treatment systems to enhance nitrification and control the treatment process. In spite of the importance of ammonia oxidizers in wastewater treatment, their slow growth and heterogeneous nature of activated sludge have made it difficult to investigate the AOB in wastewater treatment systems using traditional culturing methods. Recently, molecular approaches based on the analysis of 16S rRNA genes have been applied to detect and identify microbial diversity in activated sludge samples [1, 14, 22, 23]. Denaturing gradient gel electrophoresis (DGGE), terminal restriction fragment length polymorphism (T-RFLP), and fluorescence in situ hybridization (FISH) have been commonly used in analyses of ammonia-oxidizing bacterial communities [3, 8, 19]. Among these, DGGE is the most frequently used community fingerprinting method. It allows a rapid comparison of the microbial communities between the samples and is generally used to detect shifts in microbial population under different environmental conditions. More recently, real-time PCR was investigated for enumerating nitrifying bacteria in wastewater sludge and soil [10, 15]. Real-time PCR permits continuous monitoring of a sample during PCR using hybridization probes [5, 6] or DNA-binding dyes such as SYBR Green I [2, 12]. The SYBR green assay is simple, fast, and sensitive, because it relies on a fluorescence signal produced as the dye binds to double-stranded DNA during the extension step. This experiment was performed for the comparison of the diversity and abundance of AOB in activated sludge from five different types of wastewater treatment plants (WWTPs) in February 2006. The diversity of AOB collected from an aeration tank at each facility was compared using PCR-DGGE, and the total bacterial number, AOB number,
DIVERSITY AND ABUNDANCE OF AMMONIA-OXIDIZING BACTERIA
Table 1. Characterization of activated sludge samples collected from an aeration tank at each facility in February 2006. Activated sludge samples Livestock wastewater L1 L2 L3 Food wastewater F1 F2 F3 Paper wastewater P1 P2 P3 Sewage wastewater S1 S2 Textile wastewater T1 T2 T3
pH
T-N NH4-N T-P MLSS (mg/l) (mg/l) (mg/l) (mg/l)
7.02 7.74 8.21
54.7 62 92
35.2 48.3 70.3
7.7 2.4 3.1
2,320 2,060 4,240
6.99 7.10 7.14
35.8 95.2 66.2
30.2 77.3 53.1
0.08 3.6 10.1
2,067 5,270 6,500
6.81 6.94 6.55
10.3 59.5 44.0
8.5 48.1 40.1
0.1 3.18 0.38
600 2,600 1,430
6.74 6.38
14.0 24.9
10.3 12.5
6.4 4.1
1,800 1,500
6.90 197 6.95 191 7.43 100.4
143 151 82.1
8.59 1.49 0.17
4,820 4,890 7,500
and amoA gene abundance were estimated by real-time PCR. MATERIALS AND METHODS Activated Sludge Samples Activated sludge samples were collected from 14 different WWTPs in Korea. These facilities can be classified into five groups depending on the type of wastewater that the facility treats: wastewater from livestock, food, paper, and textile industries, and sewage wastewater. Some physicochemical properties of the activated sludge samples are presented in Table 1. All samples were collected from an aeration tank at each facility in February 2006, with the 1-l sample frozen at -20 C until use. o
DNA Extraction and PCR-DGGE Genomic DNA was isolated from activated sludge using a FastDNA SPIN kit (Q-Biogene, U.S.A.) following the manufacturer’s instructions.
1129
The quantity and purity of DNA obtained from the sludge were determined by the measurement of absorbance at 260 nm and 280 nm (NanoDrop ND-1000, U.S.A.). The PCR conditions and primers used in this experiment are listed in Table 2. A nested PCR was performed for the analysis of each bacterial community in the activated sludge samples. In the first round, a nearly complete 16S rDNA fragment was amplified using the universal primer set 9F and 1392R. During the second PCR round, the obtained fragments were reamplified by using the bacterial primers 341F-GC and 518R. For the analysis of the AOB group, a three-step nested PCR was performed. In the first round, a nearly complete 16S rDNA fragment was amplified using the universal primer set 9F and 1392R. The PCR product was used as a template for a second amplification with AOB primers CTO168F and CTO654R. Finally, to generate products suitable for DGGE, a third round of amplification was performed with DGGE primers 341F-GC and 518R using the PCR product of the second round as a template. DGGE was performed using a D-Code universal mutation system (Bio-Rad, U.S.A.) as described by Muyzer et al. [13]. Each sample was run on 10% polyacrylamide gels with a denature gradient of 30% to 60% for total bacteria and 30% to 40% for AOB. Each lane of the gradient gel received approximately 20 ng of PCR product. Gels were run for 15 h at 60 V and 60 C in 1×TAE (40 mM Trisacetate, 1 mM Na-EDTA, pH 8.0) buffer, and then stained with ethidium bromide. For the analysis of DGGE band patterns, images were converted, normalized, and analyzed with the Kodak 1.0 software package (Eastman Kodak Co., U.S.A.). The ShannonWeaver (H') index of microbial diversity [20] was calculated according to the formulas H'=-ΣPilogPi, and Pi=ni/N, where ni is the intensity of band I in the lane, and N is the total intensity of all bands in the lane. o
Real-Time PCR Assay The abundance of AOB was estimated by real-time PCR with the DNA Engine Opticon continuous fluorescence detection system (MJ Research, U.S.A.). The 20-µl reaction mixtures contained 0.2 µM of each primer (see Table 2), 1 µl of DNA (all 1 ng/µl), and 10 µl from the DyNAmo HS SYBR Green qPCR Kit (Finzymes, U.S.A.). The real-time PCR conditions for detecting the total bacterial 16S rRNA were 5 min at 95 C, and 40 cycles at 95 C for 1 min, 55 C for 1 min, and 72 C for 1 min. For the AOB 16S rRNA gene, the PCR program was 5 min at 95 C, and 40 cycles at 95 C for 1 min, 60 C for 1 min, and 72 C for 1 min. For the amoA gene detection, the PCR program was 5 min at 95 C, and 40 cycles at 95 C for 1 min, o
o
o
o
o
o
o
o
o
o
Table 2. PCR primers used in this study. Primers
Sequence (5'→3')
Target
Annealing temp. (oC)
9F 1392R 1055F 341Fa 518R CTO189f CTO654R amoA-1F amoA-2R
GAGTTTGATCCTGGCTCAG ACGGGCGGTGTGTAC ATGGCTGTCGTCAGCT TACGGGAGGCAGCAG ATTACCGCGGCTGCTGG GGAGRAAAGCAGGGGATCG CTAGCYTTGAGTTTCAACGC GGGGTTTCTACTGGTGGT CCCCTCTGCAAACGGTTC
Bacteria Bacteria Bacteria Bacteria Bacteria Ammonia oxidizers Ammonia oxidizers amoA gene of Betaproteobacteria amoA gene of Betaproteobacteria
50 56 56 Touch-down Touch-down 56 56 58 58
a
A 5' GC-clamp (CGCCCGCCGCGCGCGGCGGGCGGGGCGGGGGCACGGGGGG) was added for DGGE analysis.
References [5] [12] [8] [16]
1130
Baek et al.
o
o
58 C for 1 min, and 72 C for 1 min. All samples were measured three times during each assay, and negative controls without template were included in each PCR run. Because the detection by SYBR green is not fragment specific, we verified the length and quality of the amplicons by electrophoresis and melt-curve analysis. To generate standards for each gene, each PCR product from N. europaea ATCC19718 was cloned into a pGEM T-easy vector (Promega Co., U.S.A.), and then prepared from serial dilution. The gene copy number was calculated as follows: Copy number (molecules/µl) = DNA conc. (g/l) × 6.02 × 10²³ molecules/mol --------------------------------------------------------------------------------------------------------Plasmid length ( bp ) × 660 The number of copies of each target gene per PCR reaction was calculated by comparison of threshold cycles obtained in each PCR reaction from standard DNA. The PCR efficiency (E) was determined from the slope of the external calibration curve -1. according to E=10 To confirm the specificity of the amplicons, each purified target gene product ligated into the pGEM-T easy vector was sequenced using an ABI Prism 377 automatic sequencer (Applied Biosystems, CA, U.S.A.). The sequences were compared with the GenBank database using the BLASTN function (http://ncbi.nlm.nih.gov). Sequences were aligned in ClustalX; the alignment was manually checked. Phylogenetic analyses were conducted using MEGA Version 4 [21] using the neighbor-joining method with evolutionary distances computed using the maximum composite likelihood model. Phylogeny was tested using bootstrapping with 500 replicates. (1/-slope)
Statistical Analysis One-way analysis of variance (ANOVA) test was performed using SPSS Version 11.0 (SPSS Inc., U.S.A.) after log transformation of the data to meet the assumption of equal variance between groups. In the ANOVA test for real-time PCR assay, the mean difference was significant at the 0.01 level. The Tukey test was used for multiple comparisons between groups. 10
RESULTS AND DISCUSSION Activated sludge samples were taken from the aeration tank of 14 wastewater treatment plants. The pH of these samples was between 6.4 and 7.7, except for L3 (Table 1). As the data in Table 1 show, ammonium concentrations varied widely depending on the types of wastewater treated and even within the same group of wastewater as well. Because of the differences in solids retention time (SRT) used in each facility, the values of mixed liquor suspended solids (MLSS) also varied widely. It is also worth noting that activated sludge from the textile wastewater treatment plant showed the highest MLSS with the highest T-N, whereas activated sludge of sewage wastewater generally showed the lowest values for both MLSS and T-N. It was found in this study that the extracted DNA concentration was correlated with the concentration of MLSS (r2 =0.87, P0.17). Curtis and Craine [4] also did not find evidence of spatial, diurnal, and intrasample variations in a WWTP. They concluded that a single sample of activated sludge from one facility was sufficient for a plant-to-plant comparison. Moreover, other researchers have proved that the communities of AOB in the activated sludge of various sewage treatment systems do not have seasonal variations, and only particular microorganisms exhibited seasonal variation in some systems [3, 11].
DIVERSITY AND ABUNDANCE OF AMMONIA-OXIDIZING BACTERIA
1131
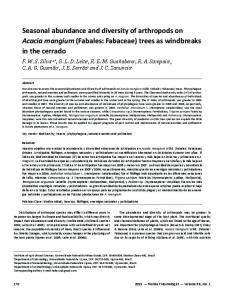
Fig. 1. Phylogenetic tree constructed from 16S rRNA gene sequences using MEGA4. The tree was constructed using the neighbor-joining method with 16S rRNA (A) and amoA gene (B). The bootstrap consensus tree was inferred from 500 replicates.
Quantification of bacteria capable of nitrification is important for an understanding of nitrifying activity and NO3- fluxes in a wastewater treatment plant. DGGE analysis characterizes differences in the relative abundances of different phylotypes, but does not allow an absolute quantification of each phylotype or the number of the total bacterial group analyzed. Real-time quantitative PCR enables such analysis, because it can monitor the initial exponential phase of the PCR, and the amount of the amplified product is proportional to the concentration of the template DNA [7]. Both the 16S rRNA and amoA genes provide well-studied genetic markers for the characterization of AOB [17]. A functional gene, amoA,
Fig. 2. DGGE profiles of PCR-amplified total bacterial (A) and AOB 16S rRNA genes (B) in the activated sludge in 14 different WWTPs.
rather than the AOB 16S rRNA gene, was targeted to provide quantitative information about the process of ammonia oxidation [15]. For real-time PCR assay, equations of the regression for total bacterial 16S rRNA, AOB 16S rRNA, and amoA gene were respectively as follows: y=-3.43x+24.92 (r2 =0.99, p=0.002), y=-4.0x+ 44.76 (r2 =0.98, p