Copyright WILEY-VCH Verlag GmbH & Co. KGaA, 69469 Weinheim, Germany, 2017.
Supporting Information for Adv. Sci., DOI: 10.1002/advs.201700659
Oxygen-Vacancy Abundant Ultrafine Co3O4/Graphene Composites for High-Rate Supercapacitor Electrodes Shuhua Yang, Yuanyue Liu,* Yufeng Hao, Xiaopeng Yang, William A. Goddard, Xiao Li Zhang, and Bingqiang Cao*
Copyright WILEY-VCH Verlag GmbH & Co. KGaA, 69469 Weinheim, Germany, 2013.
Supporting Information Oxygen-Vacancy Abundant Ultrafine Co3O4/Graphene Composites for High-Rate Supercapacitor Electrodes Shuhua Yang, Yuanyue Liu*, Yufeng Hao, Xiaopeng Yang, William A. Goddard III, Xiao Li Zhang, and Bingqiang Cao*
Dr. S. H. Yang, Dr. X. P. Yang, Prof. Dr. B. Q. Cao Materials Center for Energy and Photoelectrochemical Conversion, School of Material Science and Engineering University of Jinan Jinan 250022, China E-mail:
[email protected] (B. Q. Cao) Dr. Y. Y. Liu, Prof. W. A. Goddard III Materials and Process Simulation Center California Institute of Technology Pasadena, CA 91125, US Prof. Dr. Y. F. Hao National Laboratory of Solid State Microstructures, College of Engineering and Applied Sciences, and Collaborative Innovation Center of Advanced Microstructures Nanjing University Nanjing 210093, China Dr. Y. Y. Liu The Resnick Sustainability Institute California Institute of Technology Pasadena, CA 91125, US E-mail:
[email protected] (Y. Y. Liu) Prof. Dr. X. L. Zhang School of Materials Science and Engineering, and State Centre for International Cooperation on Designer Low-Carbon & Environmental Materials Zhengzhou University Zhengzhou 450001, China Keywords: ultrafine Co3O4 nanoparticles, graphene, laser irradiation, oxygen vacancies, supercapacitors
1
Part I: Supplementary Figures and Tables
Figure S1 UV-vis absorption spectrum of the porous Co3O4 nanorods.
2
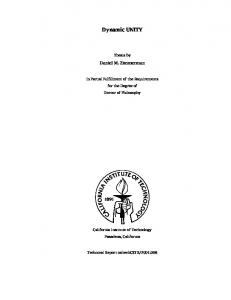
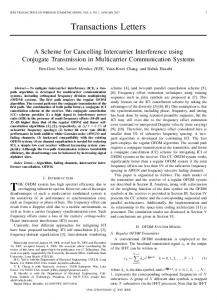
Figure S2 TEM images of UCNG-10 (a), UCNG (b), UCNG-60 (c) under the same laser fluence (400 mJ pulse-1 cm-2) with different irradiation time (10, 30, 60 min); TEM images of UCNG-200 (d), UCNG (e), and UCNG-600 (f) under the same irradiation time (30 min) with different laser fluence (200, 400, 600 mJ pulse-1 cm-2). The figure S2b and the figure S2e are from the same sample (UCNG), but the scales are different.
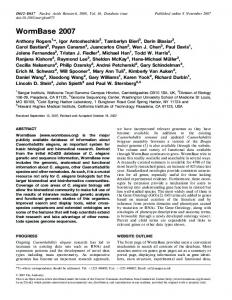
Figure S3 (a) GCD curves of the Co3O4 nanoparticles/graphene composites under same laser fluence with different irradiation time, (b) GCD curves of the Co3O4 nanoparticles/graphene composites under same irradiation time with different laser fluence. The current density is 1 Ag-1. 3
Table S1 Various Co3O4 nanoparticles/graphene composites prepared under different laser parameters. Conditions
10 min
30 min
60 min
200 mJ pulse-1 cm-2
N/A
UCNG-200
N/A
400 mJ pulse-1 cm-2
UCNG-10
UCNG
UCNG-60
600 mJ pulse-1 cm-2
N/A
UCNG-600
N/A
Table S2 The capacitance (capacity) of various Co3O4 nanoparticles/graphene composites prepared under different laser parameters. Materials
UCNG-10
UCNG-60
UCNG
UCNG-200
UCNG-600
Capacitance (F/g)
167.4
127.3
978.1
320.5
101.2
Capacity (mAh/g)
23.2
17.7
135.8
44.5
14.1
A number of Co3O4 nanoparticles/graphene composites prepared under various laser parameters (Table S1) were surveyed to prove the proposed strategy in paper and optimize the preparation condition associated with excellent electrochemical properties for SCs electrodes applications. Figure S2a-c reveals the morphology evolution of Co 3O4 nanoparticles/graphene composites with different irradiation time (10, 30, 60 min) under the same laser fluence (400 mJ pulse-1 cm-2). When the laser irradiation time is as short as 10 min, the porous Co3O4 nanorods have been fragmented into ultrafine Co3O4 nanoparticles, but only few particles are anchored on LG surface, as shown in Figure S2a. This is because the laser energy is enough to fragment the porous Co3O4 nanorods, but the laser irradiation time is too short to disperse and anchor the ultrafine Co3O4 nanoparticles on LG surface. When laser irradiation time increase to 30 min, all ultrafine Co 3O4 nanoparticles are well dispersed on LG surface and no particles outside LG surface are found (Figure S2b). When the laser irradiation time further increase (60 min), the ultrafine Co3O4 nanoparticles on LG surface fuse together and form bigger spherical particles, as shown in Figure S2c. Figure S2d-f reveals the morphology evolution of Co 3O4 nanoparticles/graphene composites with different laser fluence (200, 400, 600 mJ pulse-1 cm-2) for the same 4
irradiation time (30 min). As the applied laser energy density is 200 mJ pulse-1 cm-2, it is too low to fragment the porous Co3O4 nanorods, as shown in Figure S2d. When the laser increase to 400 mJ pulse-1 cm-2, the porous Co3O4 nanorod are completely fragmented into ultrafine Co3O4 nanoparticles, as shown in Figure S2e. The ultrafine Co3O4 nanoparticles merge and form bigger spherical particles under 600 mJ pulse-1 cm-2 laser energy density, which is high enough to melt the particles (Figure S2f). This indicates that lasers with proper irradiation time and fluence (400 mJ pulse-1 cm-2 of laser fluence and 30 min of irradiating time) are necessary to prepare ultrafine Co3O4 nanoparticles/graphene composites. Figure S3 shows the galvanostatic charge/discharge (GCD) curves of the various Co3O4 nanoparticles/graphene composites at 1 A g-1. Among various Co3O4 nanoparticles/graphene composites, the UCNG composites exhibit the highest specific capacitance (Table S2), further confirming the optimized preparation condition (400 mJ pulse-1 cm-2 of laser fluence and 30 min of irradiating time).
5
Figure S4 (a) SEM image, (b) enlarged SEM image, (c) TEM image, and (d) enlarged TEM image of the UCNG composites.
Figure S5 Size distribution of Co3O4 nanoparticles in the UCNG composites.
6
Figure S6 (a, b) TEM image of ultrafine Co3O4 nanoparticles on graphene sheets after laser irradiation. The neck formation (slight fusion) between adjacent Co3O4 particles may be mainly caused by laser melting. The neck was indicated by the red circle.
7
Figure S7 (a) TEM image and (b) zoom-in TEM image of porous Co3O4 nanorods (PCo3O4) before laser irradiation.
8
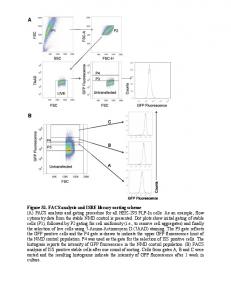
Figure S8 High-resolution O1s XPS spectra of LG (a) and UCNG composites (b).
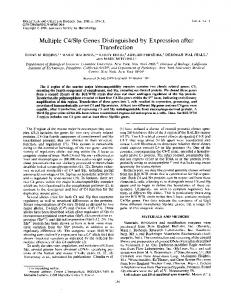
Figure S9 FTIR spectra of LG (a) and UCNG composites (b).
The interaction between graphene and Co 3O4 nanoparticles is further corroborated by XPS and Fourier transform infrared (FTIR) spectroscopy (Figure S8, S9). High-resolution O1s XPS spectra was obtained in the LG (laser reduced graphene) and ultrafine Co3O4 nanoparticles/graphene (UCNG) composites. The O1s XPS spectrum of UCNG can be deconvoluted into four peaks (Figure S8a). The peak located at 530.1 is attributed to O-Co bonding configuration in Co3O4.[1] The peak at 531.6 eV is related to C=O bonding configuration while the peak at 533.3 eV is due to the C-OH and/or C-O-C bonding 9
configuration.[2, 3] Another peak centered at 530.4 eV originates from the possible formation of a Co-O-C bond, exhibiting that Co3O4 was anchored on the graphene sheets by a Co-O-C.[2, 4]
Comparing with the peaks at binding energies of 531.5 and 532.7 eV in O 1s XPS spectrum
of the LG (Figure S8b), the intensities of the O 1s peaks associated with C=O group and COH and/or C-O-C group in UCNG decreased dramatically, indicating that the oxygencontaining functional groups on LG have been substituted by cobalt ion in Co3O4, forming the Co-O-C bonds. The FTIR spectra of the LG (laser reduced graphene) and ultrafine Co3O4 nanoparticles/graphene (UCNG) composites in the 400-2000 cm-1 spectral region were shown in Figure S9. In the FTIR spectrum of the UCNG, the peaks at 562 and 661 cm-1 are derived from the characteristic Co-O vibrations of the Co 3O4 spinel lattice.[5] The FTIR spectrum of LG shows the characteristic peaks at 1398, 1261, and 1099 cm-1 are attributed to O-H deformation vibration, C-O vibration of the carboxy, and C-O-C vibration of the epoxy, respectively.[2, 6] However, after the growth of Co 3O4 nanoparticles, the peaks corresponding to the O-H and C-O-C groups at 1398 and 1099 cm-1 almost disappear, while the intensity of C-OH group at 1261 cm-1 significantly decrease. This result suggests that the epoxy C-O and hydroxyl O-H groups have been broken down to form a Co-O-C bond between graphene and Co3O4 nanoparticles.[4]
10
Figure S10 XRD diffractograms of P-Co3O4 and LP-Co3O4.
Figure S11 Co 2p XPS spectrum for LP-Co3O4. In the high-resolution Co 2p spectra (Figure 3b and Figure S11), the peaks observed at 780.0 and 795.5 eV for the P-Co3O4 (780.0 and 795.3 eV for the LP-Co3O4) can be assigned to the Co 2p3/2 and Co 2p1/2 spin-orbital peaks of Co 3O4, respectively. Compared to the P-Co3O4, the Co 2p peaks of the LP-Co3O4 show two more obvious satellite peaks centered at about 786.6 and 802.8 eV, which are attributed to the Co2+ oxidation state, indicating that a part of the Co3+ ions was reduecd to Co2+ and formed oxygen vacancies.
11
Figure S12 (a) Room-temperature EPR spectra of UCNG composites and P-Co3O4. (b) Room-temperature EPR spectrum of LP-Co3O4. The signal intensity illustrates that both UCNG composites and LP-Co3O4 obtained under the laser irradiation possess higher oxygen vacancy concentration, while the P-Co3O4 exhibit very low oxygen vacancy concentrations, which agrees well with the XPS results.
Figure S13 Optical images of the mixture solution for GO and porous Co3O4 nanorods before (a) and after (b) laser irradiation. Upon laser irradiation, the yellow–brown color instantaneously turned black, indicating that GO could be rapidly reduced by laser irradiation.
12
Figure S14 TEM image of LP-Co3O4. In the absence of GO, the LP-Co3O4 was prepared under same laser conditions as described in EXPERIMENTAL SECTION.
Figure S15 Equivalent circuit for three-electrode configuration cell used in this work. The impedance characteristics were analyzed by the complex nonlinear least-squares (CNLS) fitting method on the basis of a Randles equivalent circuit, as shown Figure S15 (Supporting Information). RS, RCT, CDL, CF, and Wo in the circuit represents solution resistance, chargetransfer resistance, double-layer capacitance, pseudocapacitance, and the finite-length Warburg diffusion element, respectively.
13
Figure S16 (a) TEM image and (b) HRTEM image of the UCNG composites after 20000 cycles.
Figure S17 (a) XRD diffractogram and (b) Raman spectrum of the UCNG composites after 20000 cycles.
14
Figure S18 Co 2p XPS spectrum for the UCNG composites after 20000 cycles.
Figure S19 (a) GCD curves at different current densities, (b) Ragone plot (power density vs energy density) of symmetric supercapacitors based on UCNG. The power density (P) and energy density (E) of the ultrafine Co3O4 nanoparticles/graphene composites (UCNG) were tested by a classical two-electrode configuration in 2 M KOH aqueous electrolyte. Specific capacitance of the UCNG in the symmetric supercapacitors (two-electrode configuration) were calculated from the galvanostatic charge–discharge (GCD) curves according to Eq. (1) C=2IΔt/ΔVm
(1)
15
where C is the specific capacitance (F g-1), I is the current (A), Δt is the discharge time (s), m is the mass of one electrode (g), and ΔV is the operating potential window (V) during the discharge. The potential range was set between 0 and 0.8 V. The energy density (E) and power density (P) of the UCNG were calculated by using the following equations: E = 0.5C (ΔU)2/3.6
(2)
P = E/Δt
(3)
where E (Wh/kg) is the energy density, C (F/g) is the specific capacitance, ΔU (V) was the SCs voltage window, P (W/kg) is the power density, and Δt (h) is the discharge time.
Figure S20 TEM images of (a) Fe2O3/graphene and (b) MnO2/graphene composites. After laser irradiation, the Fe2O3 and MnO2 precursors completely break up into ultrafine Fe2O3 and MnO2 nanoparticles, and the ultrafine Fe2O3 nanoparticles and ultrafine MnO2 nanoparticles were simultaneously anchored on graphene sheets. For comparison, Fe2O3 and MnO2 samples were prepared as given in previous reports (Chem. Commun. 2002, 764, Adv. Funct. Mater. 2013, 23, 4049). L-Fe2O3 and L-MnO2 (Fe2O3/graphene and MnO2/graphene composites) were fabricated using the as-prepared Fe2O3 and MnO2 samples by laser irradiation reduction route.
16
Figure S21 (a) Narrow O 1s XPS spectra collected for untreated Fe2O3 and Fe2O3/graphene samples, (b) narrow Mn 3s XPS spectra collected for untreated MnO2 and MnO2/graphene samples. For the O 1s XPS spectra of the untreated Fe2O3 and Fe2O3/graphene samples, two peaks can be obviously identified for both samples. The peak centered at about 530.2 eV is attributed to O-Fe bonding configuration in Fe2O3, while the peak located at 531.7 eV is related to the oxygen defects in the matrix of metal oxides (Adv. Mater. 2014, 26, 3148). In comparison with the untreated Fe2O3 sample, the higher intensity of the peak located at 531.7 eV for Fe2O3/graphene sample indicates that Fe2O3 in Fe2O3/graphene sample has more oxygen defects. For the Mn 3s XPS spectra of the untreated MnO2 and MnO2/graphene samples, the MnO2/graphene sample shows larger energy separation (ΔE=5.6 eV) when compared with untreated MnO2 sample (ΔE=4.9 eV). As previously reported (Nano Energy 2014, 8, 255), the multiplet splitting energy (ΔE) increases linearly as the valence of Mn element decreases. This result further confirms that the MnO2 in MnO2/graphene sample is reduced by laser irradiation (Mn4+ to Mn3+/Mn2+) and plentiful oxygen vacancies are induced into MnO2.
17
Figure S22 (a) Specific capacitance of Fe2O3/graphene composites, Fe2O3, and L-Fe2O3 electrodes calculated from GCD curves as a function of current densities, (b) Specific capacitance of MnO2/graphene composites, MnO2, and L-MnO2 electrodes calculated from GCD curves as a function of current densities. The electrochemical measurements of Fe2O3 based electrodes were tested using a threeelectrode cell in 1 M Na2SO4 aqueous solution within a potential window from -1 to -0.3 V (vs. Ag/AgCl). The electrochemical measurements of MnO2 based electrodes were tested using a three-electrode cell in 1 M Na2SO4 aqueous solution within a potential window from 0 to 1 V (vs. Ag/AgCl).
18
Figure S23 Atomic structures used to model the 001 surface
19
Table S3 Comparison of the rate capability of other Co3O4-based electrodes in the literature. Materials
Electrolyte
Measurement methods
Mesoporous Co3O4 nanosheet 3D GrapheneBased Aerogel/ Co3O4
3-electrode
660 (0.5)
6 M KOH
2-electrode
130 (0.455) 103 (9.09)
2 M KOH
3-electrode
6 M KOH
3-electrode
1 M KOH
3-electrode
Co3O4/carbon
6 M KOH
3-electrode
CNT@ Co3O4
PVA-H2SO4 gel
2-electrode
2 M KOH
3-electrode
Reduced Nanowires
Nanofilms
PVA/KOH gel
2-electrode
graphene Mesoporous Co3O4 Microtubules Needle-like Co3O4 /Graphene Co3O4 nanosheets
201 (1)
Rate capability 53.8%
75.8%
Ref.
[7]
[8]
79.2% 88%
[9]
90.8%
[10]
78.2 %
[11]
49.5%
[12]
74.2%
[13]
33.3%
[14]
91.1%
[15]
300 (10)
51.7%
[16]
196 (40)
33.8%
176.9 (20) 458 (0.5) 416 (2) 781 (0.5) 611 (8) 977 (2) 484 (10) 555.2 (1) 411.8 (40) ~90 (~0.1) ~30 (~1.9) 1400 (1) 1276 (8) 580 (1)
Co3O4 / Vertically aligned
1471 (10) 500 (10)
RGO-Co3O4
Sub-3 nm Co3O4
2735 (2)
6 M KOH
3-electrode
Mesoporous Co3O4
(Is / A g )
3-electrode
2 M KOH
spheres
-1
2 M KOH
Co3O4/C-800
3D Co3O4 twin-
Cs/ F g-1
3 M KOH
3-electrode
2 M KOH
3-electrode
2 M KOH
3-electrode
130.5 (0.5)
91.2%
[17]
38.0%
[18]
88.2%
[19]
353 (10)
78.3%
[20]
308 (20)
68.3%
119.0 (2) 157.7 (0.1) 60 (2) 176.8 (1) 156.0 (10) 451 (1)
CoO/Co3O4
Mesoporous Co3O4 nanowire Macro-/ Mesoporous Co3O4 Carbon Nanofibers/ Co3O4
3 M KOH
3-electrode
1160 (2) 6 M KOH
3-electrode
2 M KOH
3-electrode
6 M KOH
3-electrode
20
884 (10)
76.2%
820 (20)
70.7%
742.3 (0.5) 403.8 (20)
54.4%
586 (1) 490 (10)
[21]
[22]
[23]
83.6%
196 (50) 270 (1)
Co3O4-CNFs1
225 (12) Co3O4-CNFs2
6 M KOH
3-electrode
325 (1) 256 (12) 403 (12)
Nanosheet UCNG
83% [24]
79%
552 (1)
Co3O4-CNFs3 Mesoporous Co3O4
33.4%
30 wt % KOH
2-electrode
2 M KOH
3-electrode
21
905 (1) 705.9 (40) 978.1 (1) 916.5 (10)
73% 78% 93.7%
[25]
This work
Table S4 Comparison of the rate capability of some advanced carbon materials in the literature. Materials
PCNS-G-4
Electrolyte
Measurement methods
Cs/ F g-1 (Is / A g-1)
6 M KOH
3-electrode
6 M KOH
2-electrode
300 (0.5) 246 (10) 228 (1) 189.2 (40) 106 (1) 85.9 (40) From50mV/s to 5000 mV/s N/A (~0.5) N/A (~120) N/A (1) N/A (20) 179.3 Fcm-3(1) 158.9 Fcm-3 (10) 140.7Fcm-3 (100)
1 M TEABF4/AN Shape-Tailorable Graphene
PVA-Na2SO4 gel
2-electrode 2-electrode 3-electrode
Sheet-like porous carbon
6 M KOH
2-electrode
B/O co-doped carbon nanofiber films
1 M H2SO4
2-electrode
GMCS–NH3
6 M KOH
2-electrode
Functionalized highly porous graphitic carbon fibers Single-walled carbon nanotube aerogels
1 M H2SO4
3-electrode
1 M H2SO4
2-electrode
29.6 (0.1) 25.2 (25) 175 (1) 107 (60) 96 (1) 48 (120)
Rate capability
Ref.
82% [26]
83% 81% 53% ~75%
[27]
[28]
~89% 88.6% 78.5%
[29]
85%
[30]
61%
[31]
50%
Ionic liquid
2-electrode
~50 (1) ~25 (60)
~50%
[32]
N-doped porous carbon buildings
6 M KOH
3-electrode
347 (1) 278 (50)
80%
[33]
UCNG
2 M KOH
3-electrode
978.1 (1) 916.5 (10)
93.7%
This work
22
Part II: Computation details Spin-polarized DFT calculations are performed using the Vienna Ab-initio Simulation Package (VASP)[34, 35] with projector augmented wave (PAW) pseudopotentials[36, 37] and the Perdew–Burke–Ernzerhof (PBE) exchange-correlation functional[38]. The electron correlation was remedied by using the LDA+U approach[39], with U=3 eV for Co d-electrons, which has been shown to reproduce well the experimental structural parameters, heat of formation, and the band gap[40]. The atomic structures and the coordinates (in VASP CONTCAR format) used to model the 001 surface are shown in Figure S22. We used 400 eV for the plane-wave cutoff, and fully relaxed the systems until the final force on each atom is less than 0.01 eV/Å. 5x5x1 k-points with Monkhorst-Pack sampling[41] are used to relax the systems, and 21x21x1 k-points are used to calculate the DOS.
Perfect 001 surface 1.00000000000000 8.1500000000000004 0.0000000000000000 0.0000000000000000 0.0000000000000000 8.1500000000000004 0.0000000000000000 0.0000000000000000 0.0000000000000000 20.0000000000000000 Co O 30 40 Selective dynamics Direct 0.0000977465099083 0.5002195250814268 0.4046075283703487 T T 0.9887789289470135 0.0117258177517883 0.2038345628438449 T T 0.5023683232349327 0.4970064977758497 0.1948311284579987 T T 0.5981191429062633 0.4112613492843167 0.5834208901865452 T T 0.4994081384111979 0.0002157725558973 0.4046575308906597 T T 0.7499952269322563 0.7498403726926313 0.3085249846230553 T T 0.7615181750050724 0.2384331599526917 0.5093137663493010 T T 0.1524743769208570 0.8390744881178236 0.1296150300278143 T T 0.2478274734410491 0.7535835383290532 0.5181560487454746 T T 0.2507875785055091 0.2497860902984570 0.3084268406271633 T T 0.6213815398808222 0.8875027057333469 0.5598089327490712 T T 0.8745798731743477 0.6290925847810129 0.5579467360663486 T T 0.1166906777901602 0.3806795055406624 0.5597277673411512 T T 0.3766462922002702 0.1268741391400638 0.5593929459992850 T T 0.6337575473441674 0.8696813852505301 0.1533943933350344 T T 0.8758399838625337 0.6211595507435916 0.1550269714047445 T T 0.1289379588617692 0.3627960270605897 0.1533362505992955 T T 0.3738595014516335 0.1234613856084437 0.1536459109143777 T T 0.6230030374947546 0.6263949303774581 0.4577607184063979 T T 0.3750774566133330 0.8733507950506763 0.2547088164029816 T T 0.6242669527868969 0.3754988831195973 0.3561967674292177 T T 0.6230081195592660 0.1254905974306837 0.2545645868712256 T T 0.3750924474074111 0.3767398614773612 0.4585086948446957 T T 0.8750472729849363 0.1250754521251665 0.3566314018900627 T T 0.1256555068917962 0.8747060436295442 0.3570548892220629 T T 0.1270606226596698 0.6238358442588350 0.2554732034516576 T T 0.8753111312998456 0.8733023951612537 0.4585644763965533 T T 0.3750267250762676 0.6250283424585774 0.3566723690771951 T T 0.1272185735927351 0.1247335457515035 0.4586278600075602 T T 0.8748331935504154 0.3768615338756121 0.2546209305953511 T T 0.1397991364182474 0.3628815775396390 0.4601332376677973 T T 0.1141238925238781 0.6114342803956134 0.1573588355006450 T T 0.1026444026643247 0.6090187979588109 0.5684331610285724 T T 0.8926823328570848 0.6110836320945268 0.2556751448873911 T T
23
T T T T T T T T T T T T T T T T T T T T T T T T T T T T T T T T T T
0.8948559152574731 0.3884183222383513 0.1575368757208295 T T 0.8571049428020387 0.3973369055710094 0.5741834148027962 T T 0.8573980716919536 0.6390882794462058 0.4573653594279250 T T 0.8933218792065958 0.8529083280044105 0.1388333121599388 T T 0.8555156873096763 0.8617965789459774 0.5555561266762439 T T 0.6103961313713668 0.8872656087349569 0.2530049831840770 T T 0.6477258352825999 0.6414137226815981 0.1444685077290089 T T 0.6363193147738144 0.6388642117142851 0.5558599528350570 T T 0.1372349637163595 0.8629894824570741 0.2593739790908955 T T 0.1101951181002576 0.1094205137968203 0.3626145386845394 T T 0.8918306324928551 0.1086011174807524 0.4525311870753228 T T 0.8908355416944431 0.8899624102709396 0.3627299398110750 T T 0.8583953238096811 0.1415568211053824 0.2606488222266776 T T 0.8591850529948175 0.3602385738024054 0.3504668227260765 T T 0.6128889963158315 0.3872031139388454 0.4539016050611124 T T 0.6398749183752273 0.1407585591170957 0.3505796424492473 T T 0.6359871152233225 0.3638865829091884 0.2586276154913989 T T 0.6089166048219141 0.6104141678874910 0.3628693758407522 T T 0.3859314569471692 0.6142017468535883 0.4547462087255880 T T 0.3891728999047288 0.3908935283258899 0.3634602685557553 T T 0.3641887272138362 0.6359263720474715 0.2585215363169908 T T 0.3608457773747560 0.8591812541868862 0.3497612878927114 T T 0.1140441756409700 0.8864169336822698 0.4545317813514913 T T 0.1410874133068560 0.6397574729048827 0.3503904581202377 T T 0.6386533727298200 0.8597181003749341 0.4589987782513347 T T 0.6070283914004619 0.1024031536638716 0.1589206555295704 T T 0.6080133264732197 0.1331791394152546 0.5731383768562068 T T 0.3893605577988524 0.1078301427287798 0.2552022449242699 T T 0.3787794829725613 0.8866067073443631 0.1553242524687874 T T 0.3924856664650918 0.8984226349809035 0.5684698123272440 T T 0.3608673318647249 0.1422898337986709 0.4578675453347003 T T 0.3578101400149620 0.3519778251098771 0.1444823496588654 T T 0.3717267103044364 0.3636096174237409 0.5577952908745232 T T 0.1115151786488795 0.3904870471474169 0.2541644638767835 T T 0.1424828045837288 0.1169904956609926 0.1399446725787641 T T 0.1434610795749691 0.1478966171327798 0.5542246421523060 T T VO 1.00000000000000 8.1500000000000004 0.0000000000000000 0.0000000000000000 0.0000000000000000 8.1500000000000004 0.0000000000000000 0.0000000000000000 0.0000000000000000 20.0000000000000000 Co O 30 38 Selective dynamics Direct 0.9961315508177506 0.5022073966592941 0.4061240360688458 T T 0.9892873468152246 0.9984732850918974 0.1954250307669341 T T 0.4984460250984455 0.4905060731025301 0.1939799879732647 T T 0.5279761256679194 0.5248535944875528 0.5787047469174240 T T 0.5006565218426289 0.9941360116212437 0.4085527026692972 T T 0.7448105907904932 0.7511038088600444 0.3046935352599363 T T 0.7479574955687909 0.2398637374642831 0.5195847452728373 T T 0.2712216941553294 0.7819255044989930 0.1341000668653010 T T 0.2393070114978784 0.7489281450925560 0.5170256198995489 T T 0.2515407136290335 0.2456874224497909 0.3068867447992716 T T 0.5979785516528509 0.8764152325564893 0.5642119829780725 T T 0.8833363680339446 0.6040775204115860 0.5641526858269259 T T 0.1227819986432195 0.3740492162637636 0.5575200156970226 T T 0.3713601709485985 0.1232770962040703 0.5581998620281539 T T 0.6317992763160802 0.8529706894229463 0.1480681073517118 T T 0.8738016345380970 0.6229201414129832 0.1552332153461649 T T 0.1227007684187882 0.3725527576346650 0.1550621415007285 T T 0.3501288155164559 0.1278717752961711 0.1499728427386344 T T 0.6240089739845160 0.6226212495766106 0.4592224094111330 T T 0.3740686756916247 0.8725069873125975 0.2541410384956251 T T 0.6247123779315586 0.3744122219471251 0.3568422219004717 T T 0.6223407976287376 0.1234430033169005 0.2582371118187936 T T 0.3758207278870174 0.3744475014775261 0.4567269811222090 T T
24
T T T T T T T T T T T T T T T T T T T T T T T T T T T T T T T T T T T T
T T T T T T T T T T T T T T T T T T T T T T T
0.8733712217053053 0.1246179177385756 0.1265186211844593 0.8726535563782392 0.3759904374688858 0.1234097406623818 0.8745688937546348 0.1425706080427389 0.1179122958088072 0.1170915058711444 0.8935095529698529 0.8923415322614687 0.8895566421116285 0.8599084185115586 0.8662236320518630 0.6094505063043414 0.6413047826043865 0.6796340382728161 0.1366691640520088 0.1079312479337133 0.8826700494888158 0.8874591546338948 0.8583687688609416 0.8585071049562600 0.6164799010233182 0.6381013760749568 0.6330118558702509 0.6108916256615373 0.3864613449472998 0.3906234247145832 0.3666030124215425 0.3603642785241021 0.1076593871182041 0.1403891958080408 0.6423679779863178 0.6055762241507097 0.3919942081812948 0.4288283718175734 0.3632453641481632 0.3579996263723046 0.3564682425793464 0.3676372602488271 0.1093417797265559 0.1154217571357563 0.1407336757181241
0.1249128350470770 0.8747851023451219 0.6244174131967881 0.8731105990417802 0.6241727261078225 0.1258938494401747 0.3753437019482533 0.3619093950242913 0.6165628830813645 0.5984528990084854 0.6110182467736180 0.3931796101274898 0.3647792945144630 0.6432297303348804 0.8476307508183822 0.8936934618322709 0.6136049077603758 0.6762106497194296 0.8625835484923883 0.1092298037217390 0.1110959573528518 0.8895022260665471 0.1368199214600665 0.3593467828797046 0.3830595524794518 0.1379205492707314 0.3608242328051574 0.6094469340264013 0.6124423307838356 0.3888670137156183 0.6330253175206124 0.8591238281063056 0.8870810601511252 0.6400265673124252 0.8569596085612261 0.1148994204554796 0.1074672418683917 0.9269582735218691 0.8994337665072010 0.1407165770324568 0.3658558842086350 0.3659480418920253 0.3903156753985968 0.1480851781892767 0.1445486092245503
0.3565175143808119 0.3563540891603765 0.2564589393368166 0.4547872197396359 0.3567645767693932 0.4581831889575554 0.2549484757286535 0.4572144075705182 0.1582693869647187 0.5722859786635937 0.2558173959300234 0.1586073004558131 0.5654198959998240 0.4646740157701856 0.1407107145281827 0.2478040221801550 0.1478288225761659 0.6041617892984377 0.2589244434893416 0.3623224824255260 0.4539174067590750 0.3606756488284475 0.2592820581976127 0.3507588364240846 0.4542181658634945 0.3522861271798021 0.2592719820521197 0.3608480652418180 0.4541781815515122 0.3621219669854980 0.2591168475416055 0.3525613703922588 0.4538410638632300 0.3512720821924944 0.4650497214280023 0.5672502622210374 0.2488640877582355 0.1087101295356803 0.5701628545310697 0.4569671407276275 0.1457514787896130 0.5550824922113620 0.2561853257854665 0.1429140739794477 0.5544251373253530
25
T T T T T T T T T T T T T T T T T T T T T T T T T T T T T T T T T T T T T T T T T T T T T
T T T T T T T T T T T T T T T T T T T T T T T T T T T T T T T T T T T T T T T T T T T T T
T T T T T T T T T T T T T T T T T T T T T T T T T T T T T T T T T T T T T T T T T T T T T
References [1] Z.-S. Wu, W. Ren, L. Wen, L. Gao, J. Zhao, Z. Chen, G. Zhou, F. Li, H.-M. Cheng, ACS Nano 2010, 4, 3187. [2] S. Yang, X. Song, P. Zhang, J. Sun, L. Gao, Small 2014, 10, 2270. [3] X. Li, G. Zhang, X. Bai, X. Sun, X. Wang, E. Wang, H. Dai, 2008, 3, 538. [4] G. Zhou, D.-W. Wang, L.-C. Yin, N. Li, F. Li, H.-M. Cheng, ACS Nano 2012, 6, 3214. [5] W.-H. Ryu, T.-H. Yoon, S. H. Song, S. Jeon, Y.-J. Park, I.-D. Kim, Nano Lett. 2013, 13, 4190. [6] S. Yang, Y. Lin, X. Song, P. Zhang, L. Gao, ACS Appl. Mater. Interfaces 2015, 7, 17884. [7] C. Yuan, L. Yang, L. Hou, L. Shen, X. Zhang, X. W. D. Lou, Energy Environ. Sci. 2012, 5, 7883. [8] L. Xie, F. Su, L. Xie, X. Li, Z. Liu, Q. Kong, X. Guo, Y. Zhang, L. Wan, K. Li, C. Lv, C. Chen, ChemSusChem 2015, 8, 2917. [9] N. Wang, Q. Liu, D. Kang, J. Gu, W. Zhang, D. Zhang, ACS Appl. Mater. Interfaces 2016, 8, 16035. [10] C. Xiang, M. Li, M. Zhi, A. Manivannan, N. Wu, J. Power Sources 2013, 226, 65. [11] Y. Xiao, S. Liu, F. Li, A. Zhang, J. Zhao, S. Fang, D. Jia, Adv. Funct. Mater. 2012, 22, 4052. [12] Y. Wang, T. Zhou, K. Jiang, P. Da, Z. Peng, J. Tang, B. Kong, W. B. Cai, Z. Yang, G. Zheng, Adv. Energy Mater. 2014, 4. [13] J. Li, Z. Liu, L. Li, C. Zhu, D. Hu, J. Electrochem. Soc. 2016, 163, A417. [14] F. Su, X. Lv, M. Miao, Small 2015, 11, 854. [15] C. Feng, J. Zhang, Y. He, C. Zhong, W. Hu, L. Liu, Y. Deng, ACS Nano 2015, 9, 1730. [16] Q. Liao, N. Li, S. Jin, G. Yang, C. Wang, ACS Nano 2015, 9, 5310. [17] D. Yan, H. Zhang, L. Chen, G. Zhu, S. Li, H. Xu, A. Yu, ACS Appl. Mater. Interfaces 2014, 6, 15632. [18] Q. Guan, J. Cheng, B. Wang, W. Ni, G. Gu, X. Li, L. Huang, G. Yang, F. Nie, ACS Appl. Mater. Interfaces 2014, 6, 7626. [19] Y. Wang, Z. Zhong, Y. Chen, C. T. Ng, J. Lin, Nano Res. 2011, 4, 695. [20] M. Pang, G. Long, S. Jiang, Y. Ji, W. Han, B. Wang, X. Liu, Y. Xi, D. Wang, F. Xu, Chem. Eng. J. 2015, 280, 377. [21] F. Zhang, C. Yuan, X. Lu, L. Zhang, Q. Che, X. Zhang, J. Power Sources 2012, 203, 250. [22] X. Wang, A. Sumboja, E. Khoo, C. Yan, P. S. Lee, J. Phys. Chem. C 2012, 116, 4930. [23] S. Abouali, M. Akbari Garakani, B. Zhang, Z.-L. Xu, E. Kamali Heidari, J.-q. Huang, J. Huang, J.-K. Kim, ACS Appl. Mater. Interfaces 2015, 7, 13503. [24] F. Zhang, C. Yuan, J. Zhu, J. Wang, X. Zhang, X. W. D. Lou, Adv. Funct. Mater. 2013, 23, 3909. [25] R. Rakhi, W. Chen, M. N. Hedhili, D. Cha, H. N. Alshareef, ACS Appl. Mater. Interfaces 2014, 6, 4196. [26] X. Fan, C. Yu, J. Yang, Z. Ling, C. Hu, M. Zhang, J. Qiu, Adv. Energy Mater. 2015, 5. [27] B. Xie, C. Yang, Z. Zhang, P. Zou, Z. Lin, G. Shi, Q. Yang, F. Kang, C.-P. Wong, ACS Nano 2015, 9, 5636. [28] Z. Li, W. Lv, C. Zhang, B. Li, F. Kang, Q.-H. Yang, Carbon 2015, 92, 11. [29] Z.-Y. Yu, L.-F. Chen, L.-T. Song, Y.-W. Zhu, H.-X. Ji, S.-H. Yu, Nano Energy 2015, 15, 235. [30] Z. Lei, N. Christov, X. Zhao, Energy Environ. Sci. 2011, 4, 1866. [31] H. Wang, H. Yi, C. Zhu, X. Wang, H. Jin Fan, Nano Energy 2015, 13, 658. 26
[32] K. L. Van Aken, C. R. Pérez, Y. Oh, M. Beidaghi, Y. Joo Jeong, M. F. Islam, Y. Gogotsi, Nano Energy 2015, 15, 662. [33] L. Jiang, L. Sheng, X. Chen, T. Wei, Z. Fan, J. Mater. Chem. A 2016, 4, 11388. [34] G. Kresse, J. Hafner, Phys. Rev. B 1993, 47, 558. [35] G. Kresse, J. Furthmüller, Phys. Rev. B 1996, 54, 11169. [36] G. Kresse, D. Joubert, Phys. Rev. B 1999, 59, 1758. [37] P. E. Blöchl, Phys. Rev. B 1994, 50, 17953. [38] J. P. Perdew, K. Burke, M. Ernzerhof, Phys. Rev. Lett. 1996, 77, 3865. [39] S. L. Dudarev, G. A. Botton, S. Y. Savrasov, C. J. Humphreys, A. P. Sutton, Phys. Rev. B 1998, 57, 1505. [40] G. A. Kaptagay, T. M. Inerbaev, Y. A. Mastrikov, E. A. Kotomin, A. T. Akilbekov, Solid State Ionics 2015, 277, 77. [41] H. J. Monkhorst, J. D. Pack, Phys. Rev. B 1976, 13, 5188.
27