S5 DOI: 10.5379/urbani-izziv-en-2014-25-supplement-001
The on-going desegregation of residential property ownership in South Africa: The case of Bloemfontein Ralph Rex Maléne Campbell Gustav Visser Ralph Rex, University of the Free State, Department of Town and Regional Planning, Bloemfontein, South Africa (
[email protected]) Maléne Campbell, University of the Free State, Department of Town and Regional Planning, Bloemfontein, South Africa (
[email protected]) Gustav Visser, University of the Free State, Department of Geography, Bloemfontein, South Africa (
[email protected])
Abstract The investigation responds to the low ebb in racial property ownership desegregation discourse in South Africa. The paper provides a review of recent desegregation studies in South Africa and its empirical reflection in the secondary city of Bloemfontein. The investigation supports current discourses focused on desegregation of residential property ownership in urban South Africa. Drawing on the Bloemfontein experience, it is demonstrated that significant progress has been made in this type of desegregation. Keywords: South Africa, residential desegregation, home ownership, Bloemfontein
Introduction The legal segregation of different races, in terms of residential life and property ownership, was a defining feature of twentieth century South Africa (Robinson, 1996). This was the result of a range of interventions although the Group Areas Act of 1950 was the main legislative framework that underpinned the near-absolute segregation of different racial groups spatially. After this Act was repealed in 1991, all racial groups could choose where to live and own property (Christopher, 2005). Owing to the Apartheid-induced scarcity of appropriate economic opportunities, however, Black South Africans have, until recently, been severely restricted in options available for exercising these newly acquired spatial mobility rights, including the choice of where to reside (Christopher, 2001a). However, this has changed over the past two decades: the Black, Coloured, and “Indian” middle class is now larger than the entire White population (Donaldson et al., 2013; Statistics South Africa, 2013). Consequently, it has mainly been this nouveau riche cohort who have left previously designated townships and moved to less crowded, safer, and better serviced former White suburbs (Crankshaw, 2008; Horn & Ngcobo, 2003). The limited scholarship on urban desegregation has followed different methodologies. Most relevant investigations have been dominated by the work of Christopher (2001a, 2001b, 2001c, 2005), Crankshaw (2005, 2008, 2012) and Horn (2000, 2002a, b, 2005) in detailed analyses of South Africa’s census records. Through comparison of the census data of the late Apartheid and early post-Apartheid eras, scholars argue that the high levels of White segregation that prevailed under the previous dispensation have changed slowly during the 1990s and 2000s. However, recent work by Crankshaw (2008, 2012) demonstrates that this trend is gaining pace in certain places, though
Urbani izziv, volume 25, supplement, 2014 (special issue)
S6 still linked to class position. In a concurrent, but methodologically different debate, similar conclusions have been drawn. In those investigations, residential property ownership, as opposed to residential occupation measured in the census data, also indicates such trends (Donaldson & Kotze, 2006; Rex & Visser, 2009). This investigation draws upon the latter methodology and chronicles current desegregation in Bloemfontein. The paper revisits investigations by Kotze and Donaldson (1998), and Rex and Visser (2009) in a city that was among the first to legislate residential segregation (as early as 1893). This study’s objective is to determine the extent of subsequent desegregation. This aim is addressed in five sections of discursive analysis. The first furnishes an overview of trends in residential desegregation scholarship. The second explores the broad residential segregation trends in Bloemfontein, while the third outlines the methodology employed. The fourth provides a detailed analysis of Bloemfontein’s desegregating residential property market, and in the final section, some key conclusions are highlighted. A Brief Overview of Residential Segregation and Desegregation in South African Cities Residential segregation is a worldwide phenomenon, chronicled and theorised extensively (Mustert & Ostendorf, 2000; Donaldson & Kotze, 2006). Segregation is typically based on personal attributes (race, class, ethnicity, religion) and/or other identity markers (such as sexual identity, or migration status) (Acharya & Barragán Codina, 2012; Donaldson & Kotze, 2006; Donaldson & van der Merwe, 1999a; Márquez, 2011). Pacione (2005) has summarised these types of segregation, discerning three types of residential segregation: (1) segregation by social status; (2) segregation by family status and lifestyle; and (3) ethnic segregation. The (un)desirability of segregation is generally gauged on whether different types of residential segregation are voluntary or forced. Typical examples of voluntary segregation relate to migrant communities in cities such as London, or gay and lesbian communities in Los Angeles and San Francisco, where minorities cluster for defence, mutual support, and cultural preservation. These “enclaves”, based on a range of possible identity markers, can, however, be malignant if they are the result of a specific group’s entrapment – its members unable to move out into a broader urban society owing to hostility and a resultant lack of opportunities (both outside and within the enclave). Such locations are often referred to as ghettos, the subject of a large body of literature, particularly in North American urban studies. Residential segregation can, however, be forced. Donaldson and Kotze (2006: 568) suggest that there are two situational types of this form of segregation. One is the result of social pressure through racial discrimination, often recorded in accounts of the experiences of African-American communities in the USA. These show that in a range of investigations, a number of different role players, including bankers, estate agents, and government agencies, have contributed to racial discrimination, residential segregation, and, ultimately, a number of different forms of exclusion. As a result, certain communities are excluded from the social, cultural, political and economic networks of the cities they inhabit. A second form of exclusion arises from legislation, as in the case of Apartheid South Africa, where such exclusion was forcefully implemented through overt racial discrimination: race as an identity marker was elevated to a level where it overrode all other forms of actual or potential association (Donaldson & Kotze, 2006). The exclusion of Black South Africans from mainstream society can be traced back to the early nineteenth century when the first African locations were developed by various institutions –with mixed motives – in the eastern parts of the Cape Colony. However, this exclusion was confined to a small part of the urban system and was not legislated. Over the next hundred years, the segregation of different racial groups, in different parts of the country and in different ways would ensue, finally “standardised” and enforced across South Africa
Urbani izziv, volume 25, supplement, 2014 (special issue)
S7 through the Native (Urban Areas) Acts of 1923 and 1937. By the late 1940s, the increased impracticality of these pieces of legislation and their inability to stem Black urbanisation and White fears of “swamping” ushered in Apartheid policy from 1948 (Posel, 1991). Separation was effected at the micro-scale in terms of amenities and transport while at the macro-scale through Bantustans or “homelands” for African ethnic groups. It was the meso-scale of towns and cities, however, which was most crucial to the Apartheid regime. Indeed, the first National Party prime minister described the urban scale of Apartheid as the essence of that societal system, and this urban scale was later regarded by President P.W. Botha as his “bottom line” (Lemon & Clifford, 2005). The Apartheid city’s development and demise has seen extensive commentary but it is not the purpose of this paper to review that literature here (see Christopher 2001a, 2001b; Giliomee, 2003, Morris, 2012; Posel 1991, Robinson, 1996; Saff, 1994). Considering the effort devoted to investigating and recording residential segregation in South Africa during Apartheid, only a handful of geographers have investigated subsequent residential desegregation. Donaldson and Kotze (2006) note that the available academic scholarship is dominated by a small number of researchers, despite the scrapping of Apartheid legislation opening up a fertile field of research. Their studies have focused mainly on secondary and metropolitan cities (Crankshaw, 2008, 2012; Donaldson & Van der Merwe 1999a, b; Kotze & Donaldson 1998; Horn & Ngcobo, 2003; Lemanski 2005; Oldfield, 2004; Wood, 2000), while scant attention has been paid to smaller towns (Lemon & Clifford 2005). Donaldson and Kotze (2006: 569–70) argue that desegregation studies in South Africa mainly endorse five viewpoints. The first is that not much desegregation has occurred and slowly at first (cf. Christopher, 2001a). The most recent national accounts of desegregation show that changes have been place specific, with the Free State Province being the most segregated, for example, while KwaZulu-Natal continues to be the most desegregated and group-specific, with the Black-White index of dissimilarity having remained high, although there has been some evidence of a decline (Christopher, 2005). Additionally, certain neighbourhoods are prone to become re-segregated (Horn & Ngcobo, 2003; Lemon & Clifford, 2005). Inner-city neighbourhoods generally have the highest desegregation percentage, except for Cape Town, which has remained largely White. Secondly, most of the desegregation that has occurred has involved the movement of Black people into historically White areas, such as in Johannesburg (Crankshaw, 2008). In Pretoria, desegregation levels are highest in formerly White low- and middle-income residential areas (Horn & Ngcobo, 2003; Prinsloo & Cloete, 2002) concomitant with an influx of higher income Blacks into newly developed middle-class and middle- to high-income areas. A third observation is that although forced racial segregation has been removed from the political landscape, it has been replaced by class-based segregation (Crankshaw, 2008; 2012). The clustering of higher income groups in gated communities, where certain neighbourhoods and new estate developments are spatially closed off from other areas, has been driven primarily by class. Fourthly, Crankshaw notes that interracial mixing does not correlate with desegregation, however, the formation of new identities is evident in certain shared spaces (Crankshaw, 2008). Lastly, because Black people have not been active in the secondary housing market for very long, they are vulnerable under tough economic conditions. The exceptionally high interest rate during 1998–1999, the introduction of more stringent credit control, and the 2007 economic meltdown caused many to have their houses repossessed (Donaldson & Kotze, 2006). In the analysis that follows, it is our contention that to varying degrees, these trends can also be observed in Bloemfontein – the South African city that implemented residential segregation legislation first, and which is located in the country’s most segregated region, the Free State Province (Christopher, 2005).
Urbani izziv, volume 25, supplement, 2014 (special issue)
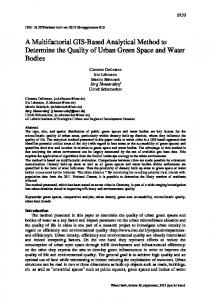
S8 Bloemfontein, founded in 1846, was formerly the capital and administrative headquarters of the Boer Republic of the Orange Free State (as from 1854; Krige, 1991). It became the judicial capital of the Union of South Africa in 1910 (Krige 1991) and later of the Republic of South Africa (1961). The development of Bloemfontein along highly segregated residential property ownership during the 19th and 20th centuries has been outlined in detail by Rex and Visser (2008). Suffice it to say that similar to cities such as Johannesburg’s two-part, northsouth split (Crankshaw, 2008), Bloemfontein was physically divided into a western “White” region and an eastern “Black” region by the Cape Town-Johannesburg railway line. The railway line serving as a buffer zone between White and African residents was further reinforced by the industrial areas, the premises of the transport services, the shooting range, and two cemeteries (Krige, 1991; see Fig. 1 for an illustration of the current suburbs of Bloemfontein). The first systematic post-Apartheid investigation into the desegregation of residential property ownership in Bloemfontein was undertaken to investigate the property data roll of the municipality, confirming extreme levels of segregation. In December 1995, the percentage of Black homeowners identified in the former White suburbs of Bloemfontein amounted to 2.3% (Kotze & Donaldson, 1998; Fig. 1). In most suburbs, less than 1% of homeowners were Black, except in the case of four areas: Fauna/Uitsig (1.0%), Pellissier (1.7%), Ehrlichpark (8.8%) and Lourierpark (25.9%; Kotze & Donaldson 1998; Table 1). These four suburbs are all situated to the south and south-west of the CBD and are either adjacent to or in close proximity to the respective Black and Coloured townships of Mangaung and Heidedal (Kotze & Donaldson, 1998; Fig. 2). Kotze and Donaldson (1998) argued that one reason for Black homeowners settling in these suburbs was that these neighbourhoods had the lowest property prices in the former White suburbs of Bloemfontein. Thus people with a lower income could more easily afford residential properties in these areas. The Bloemfontein CBD was not part of Kotze and Donaldson’s (1998) investigation, as it did not contain many residential properties. Nevertheless, the CBD witnessed a shift in the racial composition of residential property owners, from exclusively White ownership in 1991 to desegregation of almost 50% by 2001 (Jürgens et al., 2003) and 77% by 2004 (Hoogendoorn & Marais, 2008). Jürgens et al. (2003) concluded that economically mobile “non-Whites” only reside in the CBD for an interim period, aiming to leave the CBD, after a brief sojourn, to settle in former White residential areas. In comparison to other South African cities (except Cape Town), it was found that the Bloemfontein inner-city desegregation is taking place at a slower rate and on a smaller scale. This can be attributed to the compactness of Bloemfontein and the relatively close proximity of its Black townships, such as Mangaung, to the CBD, eliminating the need to move to former White areas in order to save on transport costs and travelling time (Jürgens et al. 2003). Study Methodology This quantitative investigation demonstrates the potential of using a property database to assess the extent of racial change in Black residential property ownership in the former White suburbs since the abolition of the Group Areas Act (1991). In contrast to most desegregation studies conducted in South African cities, the measurement of residential desegregation in this investigation is not based on census data, but rather comprises an analysis of the Mangaung (Bloemfontein) municipal Property Data Roll for the year 2012 (hereafter referred to as the ‘data source’). This route was chosen for a number of reasons. Firstly, this investigation seeks to determine the extent to which further residential desegregation has taken place in Bloemfontein since the 2007 study of Rex and Visser (2009). Secondly, although the last South African Census was conducted in 2011, the results thereof were not available whilst this study was being conducted. Desegregation studies can only
Urbani izziv, volume 25, supplement, 2014 (special issue)
S9 meaningfully be conducted every time a census is undertaken (once every decade). Moreover, this investigation is concerned with desegregation in terms of property ownership, not occupation. Lastly, the method of using different databases to infer racial classification has been successfully employed by Kotze and Donaldson (1998), Donaldson and van der Merwe (1999a, 1999b), Wood (2000), Lemon and Clifford (2005), as well as Rex and Visser (2009). The data source, inter alia, contains information regarding the property description of each erf, the suburb in which a specific erf is located, the ownership of each individual erf, as well as the street address, the land-use zoning, and the size and valuation of each erf. The information provided in the ownership field of the data source made it possible to distinguish between the following types of ownership: Private (i.e. White, Black or ‘Asian’), Trusts or Companies, Municipal, Provincial or Government, Organisations (i.e. churches and institutions) and Sectional Titles. As the data source does not make direct reference to the racial classification of each private owner, and whilst this study investigates the extent of racial change of Black residential property ownership in former White suburbs of Bloemfontein, it was necessary to go through each record of the data source (approximately 45,000 records) and to decide in each case whether a private owner’s surname indicated a Black or White owner. Surnames that could not be immediately identified as being either Black or White, were later identified by distinguishing the owners’ full names as being either Black or White, by utilising the Deeds Office Property Search Website. Here lies a challenge for the analysis as we had to use interpretation in deciding whether a certain private owner’s surname and full names are either Black or White. The Coloured population was excluded from the Black category as it is difficult to utilise surnames to distinguish whether an owner is Coloured or not. Often, Coloured surnames are the same as those of White English or Afrikaans speakers. For the purpose of this investigation the Coloured population is therefore included in the White category. The 2012 data source also indicated the zoning of each erf, making it possible to ignore all the erven not zoned as ‘Residential’. Consequently, the desegregation results only indicate the residential component of Bloemfontein. For this investigation, the Bloemfontein CBD (cf. Figures 1 – 3) was also excluded from the desegregation analysis, owing to the low residential component of this area. To indicate the extent as well as the location of the residential desegregation in the suburbs of Bloemfontein spatially, the data source’s property description fields (‘Erf’ and ‘Portion’) were manipulated to form a unique 21-digit code that could be linked to the Surveyor-General’s Geographical Information System (GIS) map of Bloemfontein, by using Arc View 9.3. It would have been possible, therefore, to indicate the location of each Black residential property owner within each suburb. Finally, it was possible to determine to what extent Black-owned residential property desegregation (hereafter referred to as ‘desegregation’) has taken place in the former White suburbs of Bloemfontein since 1994, by comparing the 2012 data source with the 1995 data source of Kotze and Donaldson (1998) and the 2007 data source of Rex and Visser (2009). Current Desegregation Patterns in Bloemfontein The analysis of the 2012 data source sought to indicate to what extent desegregation in terms of ownership has taken place within the former White suburbs of Bloemfontein since the 2007 investigation (Rex & Visser, 2009). It was possible to determine the type of ownership of each residential property in the suburbs and the results are tabulated in Table 1. The field ‘Black-owned Erven’ refers to the African and Indian segments of the South African population, the field ‘Asian Owned Erven’ to the Asian segments, whilst the field ‘Whiteowned Erven’ refers to the rest of the South African population. The field ‘Trusts and Companies’ refers to all the erven that are owned by Trusts, Closed Corporations and Companies, whilst the ‘Sectional Titles’ field includes all the erven where townhouses have
Urbani izziv, volume 25, supplement, 2014 (special issue)
S10 been developed and also includes residential dwelling units that are situated in blocks of apartments. The field ‘Other’ includes all the erven that are owned by the national and provincial government departments, the Mangaung Metropolitan Municipality, churches, and welfare organisations. Table 1: Bloemfontein: Ownership percentages by suburb in 2012 (Number of Erven per suburb in parentheses) Suburb
Black‘Asian’ White Trusts and Sectional owned Owned Owned Companies Titles Other Erven Erven Erven Vista Park 92.6 (679) 0.0 (0) 4.9 (36) 1.8 (13) 0.7 (5) 0.0 (0) Lourier Park 62.3 (663) 0.0 (0) 6.6 (70) 1.9 (20) 0.5 (5) 28.8 (306) Ehrlich Park 48.9 (231) 0.0 (0) 33.7 (159) 1.5 (7) 1.5 (7) 14.4 (68) Fauna 37.7 (390) 0.1 (1) 55.0 (569) 1.1 (11) 3.3 (34) 2.9 (30) Hilton 35.8 (152) 0.2 (1) 38.6 (164) 5.9 (25) 8.9 (38) 10.6 (45) Helicon Hoogte 20.0 (24) 5.8 (7) 60.8 (73) 5.0 (6) 6.7 (8) 1.7 (2) Brandwag 15.8 (89) 1.8 (10) 56.2 (316) 16.0 (90) 3.9 (22) 6.2 (35) Pellissier 15.0 (216) 0.1 (1) 65.4 (943) 3.0 (43) 8.7 (126) 7.8 (112) Woodlands 15.0 (99) 1.8 (12) 56.6 (374) 22.7 (150) 3.9 (26) 0.0 (0) Uitsig 14.4 (156) 0.2 (2) 74.0 (804) 1.4 (15) 7.0 (76) 3.1 (34) Fleurdal 12.0 (41) 1.2 (4) 77.3 (265) 1.7 (6) 4.1 (14) 3.8 (13) Pentagon Park 10.9 (33) 1.0 (3) 37.8 (115) 10.5 (32) 36.8 (112) 3.0 (9) Oranjesig 10.0 (30) 0.0 (0) 42.8 (128) 25.4 (76) 2.3 (7) 19.4 (58) Heuwelsig 9.0 (52) 3.5 (20) 63.0 (364) 8.8 (51) 12.5 (72) 3.3 (19) Generaal De Wet 8.8 (62) 0.1 (1) 82.5 (578) 1.6 (11) 1.6 (11) 5.4 (38) Bayswater 8.8 (103) 2.2 (26) 70.7 (826) 7.9 (92) 6.2 (72) 4.3 (50) Noordhoek 7.9 (46) 0.9 (5) 80.3 (470) 5.6 (33) 0.7 (4) 4.6 (27) Fichardtpark 7.2 (159) 0.3 (6) 82.3 (1824) 3.6 (79) 2.7 (60) 3.9 (87) Hillsboro 6.5 (6) 1.1 (1) 66.7 (62) 5.4 (5) 15.1 (14) 5.4 (5) Navalsig 6.3 (17) 1.1 (3) 36.8 (99) 17.5 (47) 27.1 (73) 11.2 (30) Bays Valley 4.8 (3) 0.0 (0) 36.5 (23) 12.7 (8) 44.4 (28) 1.6 (1) Universitas 4.6 (99) 0.5 (10) 72.7 (1558) 9.1 (196) 8.5 (183) 4.6 (98) Langenhovenpark 4.6 (74) 0.1 (2) 65.6 (1058) 9.4 (152) 17.2 (277) 3.2 (51) Wilgehof 4.5 (42) 0.1 (1) 78.5 (728) 3.6 (33) 9.3 (86) 4.0 (37) Hospitaalpark 4.2 (29) 0.3 (2) 83.5 (582) 3.0 (21) 3.4 (24) 5.6 (39) Gardenia Park 3.6 (18) 0.2 (1) 85.3 (430) 2.8 (14) 2.6 (13) 5.6 (28) Dan Pienaar 3.0 (46) 0.7 (10) 76.0 (1159) 9.9 (151) 5.8 (89) 4.6 (70) Waverley 2.0 (12) 0.3 (2) 65.0 (396) 14.8 (90) 9.9 (60) 8.0 (49) Willows 1.2 (3) 0.4 (1) 18.3 (44) 17.8 (43) 38.6 (93) 23.7 (57) Westdene 0.6 (3) 0.0 (0) 49.0 (264) 23.9 (129) 19.1 (103) 7.4 (40) Park West 0.4 (1) 1.8 (5) 63.8 (173) 16.6 (45) 5.5 (15) 11.8 (32) Arboretum 0.0 (0) 0.0 (0) 15.0 (6) 25.0 () 27.5 (11) 32.5 (13) Totals 15.3 (3578) 0.6 (137) 62.8 (14660) 7.3 (1704) 7.6 (1768) 6.4 (1483) Source: Calculated by the author from the 2012 Property Data Roll of the Mangaung Local Municipality.
The ‘Suburb’ column in Table 1 is sorted according to the desegregation levels of each suburb, from the suburbs displaying the highest desegregation levels in the top row of the table, to the suburbs with the lowest desegregation levels at the bottom of the table. An analysis of the data indicates that by 2012, 15.3% of the erven located in the former White suburbs of Bloemfontein were Black-owned, as compared to 11.4% in 2007 (Rex & Visser, 2009) and 2.3% in 1995 (Kotze & Donaldson, 1998). Almost 34.2% has been achieved in the desegregation levels of Black-owned erven within the suburbs of Bloemfontein since 2007. In their study of the 1995 data source, Kotze and Donaldson (1998) combined the various suburbs of Bloemfontein, categorising them into 17 suburbs, whilst the Urbani izziv, volume 25, supplement, 2014 (special issue)
Total
100 (733) 100 (1064) 100 (472) 100 (1035) 100 (425) 100 (120) 100 (562) 100 (1441) 100 (661) 100 (1087) 100 (343) 100 (304) 100 (299) 100 (578) 100 (701) 100 (1169) 100 (585) 100 (2215) 100 (93) 100 (269) 100 (63) 100 (2144) 100 (1614) 100 (927) 100 (697) 100 (504) 100 (1525) 100 (609) 100 (241) 100 (539) 100 (271) 100 (40) 100 (23330)
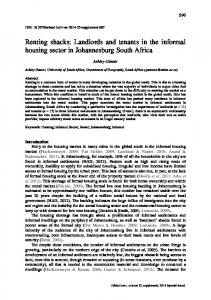
S11 study of the 2007 data source by Rex and Visser (2009) was more fine-grained, categorising Bloemfontein into 30 suburbs. Since the 2007 study (Rex & Visser, 2009), the former White suburbs of Bloemfontein have expanded further, principally in a north-westerly direction. The suburbs of Woodlands and Arboretum are therefore now included in this study, categorising Bloemfontein into 32 suburbs. Whilst there was only one suburb (Lourier Park) with a desegregation level of more than 10% in 1995 (Kotze & Donaldson, 1998) and eight suburbs with a 10% or higher desegregation levels in 2007 (Rex & Visser, 2009), the 2012 data source has indicated that 13 suburbs achieved a desegregation level of more than 10%. The five suburbs that obtained the highest percentage desegregation levels out of the 2007 data source are again the top five desegregated suburbs out of the 2012 data source. A significant observation concerns the fact that out of the four suburbs that displayed the highest percentage of desegregation levels in terms of the 1995 data source, three of these suburbs (Lourier Park, Ehrlich Park, and Fauna/Uitsig) are amongst the top five desegregated suburbs in 2012, whilst the third most desegregated suburb (Pellissier) in terms of the 1995 data source is amongst the top eight desegregated suburbs in 2012. This points towards a continuation of the desegregation patterns of the former White residential suburbs located close to former township areas. The suburb of Vista Park, situated adjacent to Ehrlich Park, is the suburb in Bloemfontein that has achieved the highest levels of desegregation out of the analysis of the 2012 data source, namely 92.6%, as well as the lowest levels of White occupancy, (4.9%, Table 1 and Figure 2 for a spatial illustration thereof). Vista Park, having been established during 2005, is one of the newest suburbs of Bloemfontein and is currently in the process of being developed with middle class residences for the Black first-time buyer in mind. Similarly, high desegregation levels have been registered for similar types of developments elsewhere in South Africa (Donaldson & Kotze, 2006). Vista Park and Ehrlich Park are also situated en route from the southern parts of the township of Mangaung towards the CBD of Bloemfontein and confirm a trend observed in other South African cities (Prinsloo & Cloete, 2002). Furthermore, the erven within Vista Park and Ehrlich Park have the smallest average size, as well as the lowest average Municipal erf valuations of all the suburbs that were not formerly Black Group Areas, making them the most affordable suburbs to reside in. In our view, these factors contribute to the high levels of Black homeownership in these suburbs. By contrast, the lowest levels of desegregation were recorded in the northern and western suburbs of Bloemfontein, situated the furthest away from the former Black and Coloured suburbs on the city’s southern outskirts. The highest percentage increase in desegregation levels since 2007 has been recorded in the suburb of Brandwag (119.4%), from 7.2% in 2007 to 15.8% in 2012. It should, however, be noted that this increase is distorted, as amongst others the Mangaung Metropolitan Municipality, as part of its Social Housing Project within the suburb of Brandwag, consolidated 126 erven into three erven during 2010. The suburbs in Bloemfontein that are known for their high number of Black residents (comprising students and single residents) are Westdene, Willows, and Navalsig. The low desegregation levels of the suburbs of Westdene (0.6%), Willows (1.2%), and Navalsig (6.3%) obtained in this study, however, contradict this knowledge. It must, however, be stressed that this study only focused on the desegregation of Black-owned residential erven and that these suburbs have large numbers of flats, townhouses, and business premises within them, predominantly owned by Trusts and Companies.
Urbani izziv, volume 25, supplement, 2014 (special issue)
S12
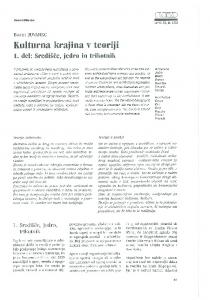
Figure 1: Percentage desegregation levels per Bloemfontein suburb in 2007 (Source: Rex & Visser, 2009)
Urbani izziv, volume 25, supplement, 2014 (special issue)
S13
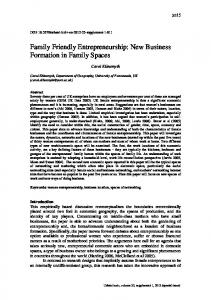
Figure 2: Percentage desegregation levels per Bloemfontein suburb in 2012 (Source: Calculated by the authors from the 2012 Property Data Roll of the Mangaung Metropolitan Municipality) Table 2: Bloemfontein: Percentage Black erf owners per suburb – comparison between the 1995, 2007, and 2012 data sources. Suburb
2012 Data Source
Vista Park
92.6
% increase(+)/decrease(-) in desegregation levels between 2007 and 2012 6.3
2007 Data Source
1995 Data Source
87.1
-
Urbani izziv, volume 25, supplement, 2014 (special issue)
S14 Lourier Park Ehrlich Park Fauna Hilton Helicon Hoogte Brandwag Pellissier Woodlands Uitsig Fleurdal Pentagon Park Oranjesig Heuwelsig Generaal De Wet
62.3 48.9
2.5 -8.3
37.7 35.8
21.6 5.0
20.0 15.8 15.0 15.0
19.0 119.4 11.9 -
14.4 12.0
20.0 44.6
10.9 10.0 9.0
17.2 23.5 8.4
60.8 53.3 31.0
25.9 8.8 1.0 (Fauna/Uitsig)
34.1 16.8
0.6 0.8 (Bayswater)
7.2 13.4 12.0
0.5 1.7 1.0 (Fauna/Uitsig)
8.3 9.3
1.0 (Fauna/Uitsig) 0.8 (Bayswater)
8.1 8.3 5.3
0.4 (Central South) 0.9 1.0 (Fauna/Uitsig)
8.8 66.0 Bayswater 8.8 17.3 7.5 Noordhoek 7.5 7.9 5.3 Fichardtpark 6.0 7.2 20.0 Hillsboro 4.3 6.5 51.2 Navalsig 3.8 6.3 65.8 Bays Valley 4.8 -2.0 4.9 Universitas 3.6 4.6 27.8 Langenhovenpark 2.9 4.6 58.6 Wilgehof 3.2 4.5 40.6 Hospitaalpark 3.7 4.2 13.5 Gardenia Park 2.4 3.6 50.0 Dan Pienaar 2.3 3.0 30.4 Waverley 2.8 2.0 -28.6 Willows 1.9 1.2 -36.8 Westdene 0.5 0.6 20.0 Park West 0.4 0.4 0.0 Arboretum 0.0 Totals 15.3 34.2 11.4 Note: The 1995 data source indicates the combined suburbs in parentheses as categorised by Donaldson (1998).
0.8 0.5 0.2 0.9 (Heuwelsig) 0.6 (Hilton) 0.8 (Bayswater) 0.2 0.8 0.3 0.2 (Fichardtpark) 0.3 (Wilgehof) 0.4 0.3 0.0 2.3 Kotze and
To explain this pattern of desegregation, similarities and dissimilarities between the different types of erven were sought, beginning with an investigation of possible relationships that exist between erf size and value in relation to the suburban levels of desegregation. Table 3: Bloemfontein: Average erf area per suburb in 2012 Suburb
Black Owned Erven (%)
Vista Park Lourier Park Ehrlich Park Fauna Hilton Helicon Hoogte Brandwag Pellissier Woodlands Uitsig Fleurdal Pentagon Park
92.6 62.3 48.9 37.7 35.8 20.0 15.8 15.0 15.0 14.4 12.0 10.9
White Owned Erven (%) 4.9 6.6 33.7 55.0 38.6 60.8 56.2 65.4 56.6 74.0 77.3 37.8
Average Area (m²) 400 840 670 940 840 1430 960 1290 1230 860 1120 1210
Erf
Rank
32 29 31 24 28 7 23 11 14 27 18 15
Urbani izziv, volume 25, supplement, 2014 (special issue)
S15 Oranjesig 10.0 42.8 690 30 Heuwelsig 9.0 63.0 1600 3 Generaal De Wet 8.8 82.5 1030 21 Bayswater 8.8 70.7 1480 5 Noordhoek 7.9 80.3 1160 17 Fichardtpark 7.2 82.3 1190 16 Hillsboro 6.5 66.7 1530 4 Navalsig 6.3 36.8 1360 10 Bays Valley 4.8 36.5 1280 12 Universitas 4.6 72.7 1440 6 Langenhovenpark 4.6 65.6 1390 9 Wilgehof 4.5 78.5 950 25 Hospitaalpark 4.2 83.5 930 26 Gardenia Park 3.6 85.3 1020 22 Dan Pienaar 3.0 76.0 1400 8 Waverley 2.0 65.0 1840 1 Willows 1.2 18.3 1080 20 Westdene 0.6 49.0 1100 19 Park West 0.4 63.8 1250 13 Arboretum 0.0 15.0 1780 2 Source: Calculated by the authors from the 2012 Mangaung Metropolitan Municipality Property Data Roll
The average erf size per former White suburb of Bloemfontein was calculated from the 2012 data source and a ranking was allocated from largest average erf size to smallest, ranging from 1–32 respectively. Table 3 shows the suburbs arranged hierarchically from highest desegregation levels (in terms of residential property ownership) to lowest, with each suburb’s percentage of White ownership also indicated. Quite noticeable is that, on the whole, the suburbs with the highest number of Black-owned erven (with desegregation levels of 30% and higher) correspond with the suburbs having the smallest average size erven. The average Municipal erf valuation, per former White suburb was calculated from the 2012 data source and a ranking was allocated from high to low according to average Municipal erf valuation, ranging from 1–32. Table 4 arranges the suburbs hierarchically from those with the highest to those with the lowest desegregation levels, with each suburb’s percentage of White ownership also indicated. Once again, it is significant that the suburbs with the highest number of Black-owned erven (with desegregation levels of 30% and higher) correspond with the suburbs having the smallest average Municipal erf valuation. Table 4: Bloemfontein: Average Municipal erf valuation per suburb in 2012 Suburb
Vista Park Lourier Park Ehrlich Park Fauna Hilton Helicon Hoogte Brandwag Pellissier Woodlands Uitsig Fleurdal Pentagon Park Oranjesig Heuwelsig Generaal De Wet
Black Owned (%) 92.6 62.3 48.9 37.7 35.8 20.0 15.8 15.0 15.0 14.4 12.0 10.9 10.0 9.0 8.8
Erven
White Owned Erven (%) 4.9 6.6 33.7 55.0 38.6 60.8 56.2 65.4 56.6 74.0 77.3 37.8 42.8 63.0 82.5
Average Municipal Valuation (Rand) 255,000 205,000 318,000 550,000 237,000 910,000 748,000 725,000 1,247,000 591,000 643,000 1,271,000 342,000 1,245,000 603,000
Rank Erf
30 32 29 24 31 8 15 18 4 23 19 3 28 5 21
Urbani izziv, volume 25, supplement, 2014 (special issue)
S16 Bayswater 8.8 70.7 726,000 17 Noordhoek 7.9 80.3 515,000 25 Fichardtpark 7.2 82.3 763,000 14 Hillsboro 6.5 66.7 1,037,000 6 Navalsig 6.3 36.8 472,000 27 Bays Valley 4.8 36.5 903,500 9 Universitas 4.6 72.7 848,000 11 Langenhovenpark 4.6 65.6 818,000 12 Wilgehof 4.5 78.5 506,000 26 Hospitaalpark 4.2 83.5 603,000 22 Gardenia Park 3.6 85.3 618,000 20 Dan Pienaar 3.0 76.0 937,000 7 Waverley 2.0 65.0 1,284,000 2 Willows 1.2 18.3 808,000 13 Westdene 0.6 49.0 877,000 10 Park West 0.4 63.8 734,000 16 Arboretum 0.0 15.0 1,785,000 1 Source: Calculated by the authors from the 2012 Mangaung Metropolitan Municipality Property Data Roll.
With a view to investigating the desegregation patterns further, the suburbs of Bloemfontein were divided into three regions, namely the south-western, western and northern suburbs. Owing to the high percentage of non-residential land use, the suburbs on the periphery of the CBD of Bloemfontein – Westdene, Oranjesig, Navalsig, and Hilton – were excluded from this exercise. The rankings obtained for the average erf area and Municipal erf valuation per suburb, shown in Tables 3 and 4, were used to determine the averages per region. The results are tabulated in Tables 5, 6, and 7. The average percentage of desegregation per region was also obtained. The results that were obtained for the three regions during the 2007 study are also indicated at the bottom of Tables 5, 6, and 7 for comparison purposes. Table 5: South-Western suburbs of Bloemfontein: average erven area ranking, average erven valuation ranking and average percentage desegregation Suburb
Average Erven Area Average Erven Ranking Valuation Ranking Hospitaalpark 26 22 Generaal De Wet 21 21 Ehrlich Park 31 29 Vista Park 32 30 Fleurdal 18 19 Uitsig 27 23 Fauna 24 24 Lourier Park 29 32 Pellissier 11 18 Fichardtpark 16 14 Totals 23.5 23.2 Totals for 2007 21.7 20.2 Source: Derived from Tables 3 and 4; Totals for 2007 by Rex & Visser (2009)
Average Percentage Desegregation 4.2 8.8 48.9 92.6 12.0 14.4 37.7 62.3 15.0 7.2 30.3 28.1
Further accentuating the desegregation patterns in 2007, the 2012 data source strongly corroborates the trend that the suburbs of Ehrlich Park, Vista Park, Uitsig, Fauna and Lourier Park, situated in the south-western portion of Bloemfontein, and the closest to the former Black township of Mangaung, achieved the highest levels of desegregation of all the former White suburbs. Furthermore, the suburbs to the south-west of the CBD have obtained the highest levels of desegregation of all the suburbs of Bloemfontein with an average of 30.3%, with rather high average ranking points of 23.5/32 for the average erf area and 23.2/32 for the average Municipal erf valuation. Urbani izziv, volume 25, supplement, 2014 (special issue)
S17 These average ranking points further indicate that the smallest and most cost efficient erven are found in this part of Bloemfontein, confirming the earlier suggestion that these suburbs comprise attractive options for first time Black homeowners within the former White residential areas. A further attractive feature for homeowners lies in the fact that five major shopping centres, three secondary schools and five primary schools are located in these suburbs. Although, owing to method, the case of Bloemfontein and Mangaung cannot be directly compared with the other studies, this echoes a trend also identified in Johannesburg’s formerly White residential suburbs in close proximity to Soweto and en route to the Johannesburg and Pretoria CBDs (Horn & Ngcobo, 2003; Prinsloo & Cloete, 2002). Table 6: Western suburbs of Bloemfontein: Average erven area ranking, average erven valuation ranking and average percentage desegregation Suburb
Average Ranking 9 23
Erven
Area
Average Erven Valuation Ranking 12 15
Langenhovenpark Brandwag (See Appendix A) Universitas 6 11 Gardenia Park 22 20 Wilgehof 25 26 Park West 13 16 Totals 16.3 16.7 Totals for 2007 14.7 15.8 Source: Derived from Tables 5 and 6; Totals for 2007 by Rex & Visser (2009)
Average Percentage Desegregation 4.6 15.8 4.6 3.6 4.5 0.4 5.6 3.3
The suburbs to the west of the CBD have obtained the lowest levels of desegregation of all the suburbs with an average of 5.6%, although having favourable average ranking points of 16.3 for the average erf area and 16.7 for the average Municipal erf valuation (Table 6). One of the possible reasons for the low desegregation levels is that these suburbs are located directly on the opposite side of the CBD in relation to the townships of Mangaung and Heidedal. Another factor for their low desegregation levels is the lack of amenities such as schools and shopping centres that are more readily found in other parts of Bloemfontein. In addition, it would appear that prospective Black homeowners perceive these western suburbs as being politically conservative areas. Indeed, looking at the political representation of electoral wards for the western suburbs of Bloemfontein, it is found that generally ‘White middle class’ political parties enjoy strong support. Table 7: Northern suburbs of Bloemfontein: Average erven area ranking, average erven valuation ranking and average percentage desegregation Suburb
Average Erven Area Average Erven Ranking Valuation Ranking Helicon Heights 7 8 Pentagon Park 15 3 Bays Valley 12 9 Bayswater 5 17 Noordhoek 17 25 Hillsboro 4 6 Waverley 1 2 Dan Pienaar 8 7 Heuwelsig 3 5 Woodlands 14 4 Totals 8.6 8.6 Totals for 2007 6.9 7.1 Source: Derived from Tables 3 and 4; Totals for 2007 by Rex & Visser (2009)
Average Percentage Desegregation 20.0 10.9 4.8 8.8 7.9 6.5 2.0 3.0 9.0 15.0 8.8 7.1
Urbani izziv, volume 25, supplement, 2014 (special issue)
S18
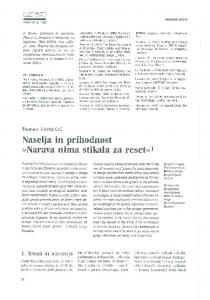
If one considers that the lowest average ranking points of 8.6 for the average erf area and 8.6 for the average Municipal erf valuation (Table 7), suburbs north of the CBD have obtained respectable levels of desegregation, averaging 8.8%, These average ranking points highlight the fact that the erven with the largest average areas, as well as the highest Municipal erf valuation are found in these suburbs. A possible reason for these levels of desegregation is that these areas are where the wealthiest people of Bloemfontein reside. Generally, the Black elite, comprising company directors and high-ranking government officials, are willing and able to pay the high price of erven in these suburbs for investment purposes and the status linked to residing there. Further corroborating this contention, the new, gated suburb of Woodlands has obtained a desegregation level of 15.0% although it obtained a ranking of 4 for the Municipal erf valuation (i.e. the fourth most expensive erven are found in the suburb of Woodlands). Another contributing factor for the desegregation found in these suburbs could be the presence of good English primary and secondary schools, typically patronised by South African Black elites. The data also contained information regarding the ownership of sectional titles. The analysis indicated that 7.6% of all properties (5.8% in 2007) contain sectional title developments (Tables 1 and 8). The results, indicating the number of sectional title developments – and units –per suburb are presented in Table 8. The suburbs column in Table 8 is sorted according to the suburbs with the highest desegregation levels in Sectional Title unit ownership in the top row of the table to the suburbs with the lowest desegregation levels in Sectional Title unit ownership at the bottom of the table. The numbers of sectional title developments per suburb are illustrated in Figure 3. The suburbs achieving the highest sectional title unit desegregation levels are Vista Park, Hilton, Ehrlich Park, Lourier Park, and Navalsig. The high sectional title unit desegregation levels obtained for the suburbs of Hilton and Navalsig could indicate that less mobile Black homeowners reside in and around the city in order to be in close proximity to either their workplace or places of education. The average Black ownership of 8.7% for sectional title units being lower than the average percentage Black erf ownership of 15.3% – together with the fact that the suburbs of Vista Park, Lourier Park, Ehrlich Park, Fauna, Hilton, Helicon Heights, Brandwag, Pellissier, Woodlands, and Uitsig are known for areas of ‘Single Residential’ erven with the highest desegregation levels – indicates that the mobile Black homeowners are inclined to purchase ‘Single Residential’ erven in the former White suburbs of Bloemfontein rather than units in sectional title developments. Table 8: Bloemfontein: Sectional Title ownership percentages by suburb in 2012 Suburb
Vista Park Hilton Ehrlich Park Lourier Park Navalsig Fauna Willows Uitsig Bayswater Oranjesig
% Sectional Title Developments per suburb (Number of erven in parentheses) 0.7 (5) 8.9 (38) 1.5 (7) 0.5 (5) 27.1 (73) 3.3 (34) 38.6 (93) 7.0 (76) 6.2 (72) 2.3 (7)
% Sectional Title Units Ownership (Number of units in parentheses) Black‘Asian’ White-owned owned owned units Units units
87.5 (7) 76.9 (60) 51.9 (28) 40.0 (4) 33.7 (397) 24.8 (57) 16.9 (323) 15.2 (73) 14.7 (81) 10.0 (8)
0.0 (0) 0.0 (0) 0.0 (0) 0.0 (0) 3.6 (42) 0.0 (0) 0.1 (2) 0.0 (0) 0.5 (3) 1.3 (1)
12.5 (1) 9.0 (7) 14.8 (8) 40.0 (4) 50.6 (596) 65.2 (150) 61.1 (1169) 76.7 (368) 48.2 (265) 86.3 (69)
Trusts and Companies
Other
Total
0.0 (0) 14.1 (11) 33.3 (18) 20.0 (2) 12.1 (143) 10.0 (23) 21.6 (413) 8.1 (39) 36.2 (199) 0.0 (0)
0.0 (0) 0.0 (0) 0.0 (0) 0.0 (0) 0.0 (0) 0.0 (0) 0.3 (6) 0.0 (0) 0.4 (2) 2.5 (2)
100 (8) 100 (78) 100 (54) 100 (10) 100 (1178) 100 (230) 100 (1913) 100 (480) 100 (550) 100 (80)
Urbani izziv, volume 25, supplement, 2014 (special issue)
S19 Westdene 19.1 (103) 9.9 (99) 3.7 (37) 59.5 (595) 26.9 (269) 0.0 (0) Pellissier 8.7 (126) 7.0 (69) 0.6 (6) 80.1 (792) 12.3 (122) 0.0 (0) Brandwag 3.9 (22) 6.7 (13) 0.0 (0) 55.2 (107) 36.6 (71) 1.5 (3) Waverley 9.9 (60) 6.6 (12) 1.7 (3) 64.6 (117) 27.1 (49) 0.0 (0) Helicon Hoogte 6.7 (8) 6.0 (4) 0.0 (0) 76.1 (51) 17.9 (12) 0.0 (0) Bays Valley 44.4 (28) 4.9 (9) 0.5 (1) 70.7 (130) 23.9 (44) 0.0 (0) Park West 5.5 (15) 4.4 (7) 0.0 (0) 57.9 (92) 35.2 (56) 2.5 (4) Pentagon Park 36.8 (112) 3.8 (22) 1.6 (9) 66.3 (379) 28.3 (162) 0.0 (0) Langenhovenpark 17.2 (277) 2.8 (99) 0.5 (16) 79.1 (2795) 17.6 (621) 0.0 (1) Fleurdal 4.1 (14) 2.8 (12) 0.0 (0) 80.7 (352) 16.5 (72) 0.0 (0) Woodlands 3.9 (26) 2.7 (14) 0.8 (4) 56.5 (288) 40.0 (204) 0.0 (0) Hillsboro 15.1 (14) 2.7 (1) 0.0 (0) 91.9 (34) 5.4 (2) 0.0 (0) Arboretum 27.5 (11) 2.6 (3) 0.9 (1) 78.1 (89) 18.4 (21) 0.0 (0) Heuwelsig 12.5 (72) 2.5 (14) 1.4 (8) 82.2 (465) 13.8 (78) 0.2 (1) Hospitaalpark 3.4 (24) 2.4 (8) 0.0 (0) 71.9 (243) 11.2 (38) 14.5 (49) Wilgehof 9.3 (86) 2.3 (20) 0.0 (0) 72.5 (630) 9.8 (85) 15.4 (134) Fichardtpark 2.7 (60) 2.3 (9) 0.0 (0) 84.5 (333) 13.2 (52) 0.0 (0) Universitas 8.5 (183) 1.9 (23) 0.2 (3) 74.6 (909) 23.2 (283) 0.0 (0) Dan Pienaar 5.8 (89) 1.5 (15) 0.2 (2) 78.6 (784) 19.4 (194) 0.3 (3) Gardenia Park 2.6 (13) 0.9 (1) 0.0 (0) 93.1 (108) 6.0 (7) 0.0 (0) Generaal De Wet 1.6 (11) 0.0 (0) 0.0 (0) 100.0 (24) 0.0 (0) 0.0 (0) Noordhoek 0.7 (4) 0.0 (0) 11.1 (1) 77.8 (7) 11.1 (1) 0.0 (0) Totals 7.6 (1768) 8.7 (1492) 0.8 (139) 70.0 (11961) 19.3 (3291) 1.2 (205) Source: Calculated by the author from the 2012 Mangaung Metropolitan Municipality Property Data Roll
100 (1000) 100 (989) 100 (194) 100 (181) 100 (67) 100 (184) 100 (159) 100 (572) 100 (3532) 100 (436) 100 (510) 100 (37) 100 (114) 100 (566) 100 (338) 100 (869) 100 (394) 100 (1218) 100 (998) 100 (116) 100 (24) 100 (9) 100 (17008)
Urbani izziv, volume 25, supplement, 2014 (special issue)
S20
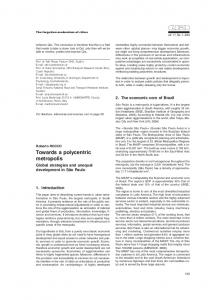
Figure 3: Percentage Sectional Titles per Bloemfontein suburb in 2012 (Source: Calculated by authors from the 2012 data source) Conclusion The analysis of the 2012 Property Data Roll of the Mangaung Metropolitan Municipality has indicated a 15.3% desegregation level in residential property ownership in Bloemfontein. If we compare this to the 11.4% desegregation level in 2007 (Rex & Visser, 2009), it is clear that even though the world economy has slowed down since late 2007 (with a concomitant impact on the South African economy), significant desegregation has taken place in Bloemfontein over the past five years (an increase of almost 35%), particularly as Christopher (2005) has calculated a Dissimilarity Index value of 96 from the 2001 Census data. Even more significant is the fact that the current study did not investigate rental housing and it could be argued that the desegregation value of 15.3% obtained is a conservatively low value.
Urbani izziv, volume 25, supplement, 2014 (special issue)
S21 The top five desegregated Bloemfontein suburbs in 2007 remain for 2012. Furthermore, the top five desegregated suburbs in 2012 are situated closest to the townships of Mangaung and Heidedal. Additionally, six of the ten most desegregated suburbs are situated within the southern and south-western portions of Bloemfontein. This clearly indicates that the same spatial desegregation trends, highlighted by Rex and Visser (2009) and first suggested by Kotze and Donaldson (1998, 475) have continued since 2007 and will probably continue in future. The suburbs with the highest percentage levels of Sectional Title Schemes within them (cf. Table 8 and Figure 3) are also among the suburbs with the lowest levels of desegregation. Table 1 indicates that mobile Black property owners are more likely to purchase more affordable ‘Single Residential’ erven, than units in Sectional Title schemes. A further telling statistic enhancing this observation is that in 2012 only 8.7% of all available Sectional Title Units (1492/17008) are Black-owned, compared to 7.2% (1022/14144) in 2007. On the whole, existing trends in the desegregation discourse of urban South Africa are corroborated in this investigation. However, some new avenues for future investigation also come to the fore. • An observation that can be highlighted is that some suburbs are demonstrating trends towards re-segregation from totally White to Black. • Desegregation trends are relatively low in wealthier suburbs and at levels that do not come anywhere close to reflecting the provincial racial demographic which is overwhelmingly Black. • Desegregation has taken place mainly at the lower end of the residential property market or near the top. Sectional title ownership has not desegregated to any large extent. • In this respect, it would also be insightful to come to an understanding of why prospective Black property owners do not invest in these types of residential developments when in cities such as Bloemfontein they tend to be ideal investment vehicles for those aiming to get a foothold in the property market. References Abbey, S.K. (2007). Modelling socio-economic dynamics in a working class desegregation area in post-industrial, post-Apartheid South Africa – The case of Danville-Elandspoort, Pretoria. Unpublished MA Thesis. University of Pretoria. Acharya, A & Barragán Codina. (2012). Social segregation of indigenous migrants in Mexico: An overview of Monterrey. Urbani Izziv 23(1), pp 140-149. Christopher, A.J. (1991). Before group areas: Urban segregation in South Africa in 1951. SA Geographer 18(1/2),pp. 85–96. Christopher, A.J. (2001a). First steps in the desegregation of South African towns and cities, 1991–6. Development Southern Africa 18(4), pp. 457–469. Christopher, A.J. (2001b). Monitoring segregation levels in South African cities 1911–1996. South African Geographical Journal 83(3), pp.249–257. Christopher, A.J. (2001c). Urban segregation in post-Apartheid South Africa. Urban Studies 38, pp. 449–466. Christopher, A.J. (2002). Trends in political geography. South African Geographical Journal 84(1), pp. 48–57. Christopher, A.J. (2005). The slow pace of Desegregation in South African Cities, 1996– 2001. Urban Studies 42(12), pp. 2305–2320. Crankshaw, O. (2005). Class, race and residence in Black Johannesburg, 1923–1970. Journal of Historical Sociology 18, pp. 353–392.
Urbani izziv, volume 25, supplement, 2014 (special issue)
S22 Crankshaw, O. (2008). Race, Space and the Post-Fordist Spatial Order of Johannesburg. Urban Studies 45(8), pp. 1692–1711. Crankshaw, O. (2012). Deindustrialization, Professionalisation and Racial Inequality in Cape Town. Urban Affairs Review 48(6), pp.839–865. Donaldson, R., & Kotze, N. (2006). Residential desegregation dynamics in the South African city of Polokwane (Pietersburg). Tijdschrift voor Economische en Sociale Geografie 97(5), pp. 567–582. Donaldson, R., Mehlomakulu, T., Darkey, D., Dyssel, M., & Siyongwana, P. (2013). Relocation: To be or not to be a Black diamond in a South African township? Habitat International 39, pp. 114–118. Donaldson, S.E., &d Van der Merwe, I.J. (1999a). Urban transformation and social change in Pietersburg during transition. Society in Transition, 30(1), pp. 69–83. Donaldson, S.E., & Van der Merwe, I.J. (1999b). Residential desegregation and the property market in Pietersburg 1992–1997. Urban Forum 10(2), pp. 235–257. Hoogendoorn, G., & Marais, L. (2008). Inner-city residential change in Bloemfontein after Apartheid: a perspective on those who did not flee desegregation. In L. Marais & G. Visser (Eds), Spatialities of urban change: Selected themes from Bloemfontein at the beginning of the 21st century, pp. 61–84. Stellenbosch: African Sun Media. Horn, A., & Ngcobo, J.R.B. (2003). The suburban challenge: (De)Segregation, opportunity, and community in Akasia, City of Tshwane. Urban Forum 14(4), pp. 320–346. Horn, A. (2000) Segregation and desegregation in South Africa with emphasis on Pretoria. In Iano, I., Pumain, D. & Racine, J. (eds.), Integrated Urban Systems and Sustainability of Urban Life, pp. 275-288. Bucharest: Editura Technic. Horn, A (2002a) Update: Segregation and Desegregation in Pretoria, South Africa. In Kim, I., Nam, Y. & Choi (eds.), Diversity of Urban Development and Urban Life, pp. 309-323. Seoul: Seoul National University Press. Horn, A (2002b) New perspective on Urban Segregation and Desegregation in Postresolution South Africa. In Schnell, I. & Ostendorf, W. (eds.), Studies in Segregation and Desegregation, pp.247-284. Aldershot: Ashgate. Horn, A. (2005). Measuring Multi-Ethnical spatial segregation in South African Cities. South African Geographical Journal 87(1), pp. 58–72. Jürgens, U., Marais, L., Barker, C., & Lombaard, M. (2003). Socio-demographic transformation in the Bloemfontein inner-city area. Acta Academica Supplementum 2003(1), pp. 34–54. Kotze, N.J., & Donaldson, S.E. (1998). Residential desegregation in two South African cities: A comparative study of Bloemfontein and Pietersburg. Urban Studies 35, pp. 467–477. Krige, D.S. (1991). Bloemfontein. In A. Lemon (Ed.), Homes Apart: South Africa’s Segregated Cities, pp. 104–119. London: Paul Chapmen Publishing. Lemanski, C. (2005). The impact of residential desegregation on social integration: Evidence from a South African neighbourhood. Geoforum 37, pp. 417–435. Lemon, A. (1998). Separate space and shared space in post-Apartheid South Africa. Geography Research Forum 18, pp. 1–21. Lemon, A., & Clifford, D. (2005). Post-Apartheid Transition in a Small South African Town: Interracial Property Transfer in Margate, KwaZulu-Natal. Urban Studies 42, pp. 7–30. Márquez, F. (2011). Santiago: Modernisation, segregation and urban identities in the twentyfirtst century. Urbani Izziv 22(2), pp.86-97. Mokoena, M., & Marais, L. (2008). An evaluation of post-Apartheid housing delivery in Mangaung. A view from local government. In L. Marais, & G. Visser (Eds), Spatialities of urban change: Selected themes from Bloemfontein at the beginning of the 21st century, pp. 109–129. Stellenbosch: African Sun Media.
Urbani izziv, volume 25, supplement, 2014 (special issue)
S23 Morris, M. (2012) The History of Apartheid: Race versus Reason. Cape Town, Sunbird. Mustert, S., & Ostendorf, W. (Eds). (2000). Urban Segregation and the Welfare State: Inequalities and Exclusion in Western Cities. Oxford: Routledge. Oldfield, S. (2004). Urban networks, community organising and race: an analysis of racial integration in a desegregated South African neighbourhood. Geoforum 35, pp. 189–201. Pacione, M. (2005). Living in the city: Residential differentiation and communities in the city. In M. Pacione (Ed.). Urban Geography, A Global Perspective, 378–397. Abingdon: Routledge. Posel, D. (1991). Curbing African urbanization in the 1950s and 1960s. In Swilling, M., Humphries, R., and Shubane, K. (Eds), Apartheid city in transition, pp. 19–32. Oxford: Oxford United Press. Prinsloo, D., & Cloete, C.E. (2002). Post-Apartheid residential mobility patterns in two South African cities. Property Management 20, pp. 264–277. Rex, R.S.R., & Visser, G. (2009). Residential Desegregation Dynamics in the South African City of Bloemfontein. Urban Forum 20, pp. 335–361. Robinson, J. (1996). The Power of Apartheid. Oxford: Heinemann-Butterworth. Saff, G. (1994). The changing face of the South African City: From urban Apartheid to the deracialization of space. International Journal of Urban and Regional research 18, pp. 377–391. Wood, L. (2000). Residential real estate transfers in Pietermaritzburg – Msunduzi, South Africa. Tijdschrift voor Economische en Sociale Geografie 91, pp. 263–277.
Urbani izziv, volume 25, supplement, 2014 (special issue)