Technological and Economic Development of Economy ISSN: 2029-4913 / eISSN: 2029-4921 2019 Volume 25 Issue 2: 134–167 https://doi.org/10.3846/tede.2019.7632
FOREIGN INFRASTRUCTURE INVESTMENT IN DEVELOPING COUNTRIES: A DYNAMIC PANEL DATA MODEL OF POLITICAL RISK IMPACTS Weiling JIANG1, Igor MARTEK2, M. Reza HOSSEINI3, Jolanta TAMOŠAITIENĖ4, Chuan CHEN5* 2, 3School
1Business School, Sichuan University, Sichuan, China of Architecture and Built Environment, Deakin University, Geelong, Australia 4Vilnius Gediminas Technical University, Vilnius, Lithuania 5Business School, Sichuan University, Sichuan, China
Received 1 February 2018; accepted 10 June 2018
Abstract. Foreign direct investment (FDI) is inhibited by political risk. Developing countries tend to experience higher levels of such risk, yet need foreign capital to generate growth. Moreover, foreign direct investment in infrastructure (FDII) – fundamental to economic growth – is particularly sensitive to political risk; characterized by high capital investment, longer investment periods, while especially exposed to mercurial shifts in government policy. Yet, no comprehensive study has been undertaken that measures the impact of political risk on FDII in developing countries. This paper addresses this lack. Twelve political risk indicators, drawn from the International Country Risk Guide Index, are used to quantify the political risk inherent to 90 developing countries, over the period 2006 to 2015. An Arellano-Bond GMM estimator is developed which measures the dollar value impact of risk on both FDI and FDII. A comparison of results confirms that FDII is generally more sensitive to risk than is FDI, however the influence of risk categories is found to vary significantly. The findings can be expected to inform infrastructure policy-makers and foreign investors alike on the dollar-impact of determinable risk levels on foreign-funded projects, and in so doing better facilitate corrective risk mitigation strategies. Keywords: foreign direct investment, infrastructure project, political risk, developing countries, panel data modelling, system GMM (sys-GMM). JEL Classification: P45, O19, N60.
Introduction Infrastructure plays an important role in the development of an economy (Zavadskas, Vilutienė, Turskis, & Šaparauskas, 2014). Infrastructure demand continues to rise, increasing to a $4 trillion in 2016 (Hosseini, Banihashemi, Martek, Golizadeh, & Ghodoosi, 2018). *Corresponding author. E-mail:
[email protected] © 2019 The Author(s). Published by VGTU Press This is an Open Access article distributed under the terms of the Creative Commons Attribution License (http://creativecommons. org/licenses/by/4.0/), which permits unrestricted use, distribution, and reproduction in any medium, provided the original author and source are credited.
Technological and Economic Development of Economy, 2019, 25(2): 134–167
135
Nevertheless, there remains a $1 trillion annual shortfall around the world (World Economic Forum, 2017b). Infrastructure investment has also been forecast to grow to 4% of global GDP by 2030 (World Economic Forum, 2014). However, faced with a huge capital shortfall, domestic governments will not be able to satisfy this demand, with the situation more serious in developing countries than in developed countries (Banaitienė, Banaitis, & Laučys, 2015). Thus, foreign capital in the form of foreign direct investment (FDI) presents as an important source for infrastructure financing (Fernando, Hosseini, Zavadskas, Perera, & Rameezdeen, 2017). FDI refers to investment in control of productive facilities overseas–usually defined by an investment that amounts to control of 10% or more of a company’s equity. FDI flows to developing countries have increased steadily since 1985, and from the 1990s has become the main source of external financing (Guerin & Manzocchi, 2009). FDI itself comes in many forms, mostly manufacturing, services, environmental, information and technology, and infrastructure (Tvaronavičiene & Kalašinskaite, 2010; Elfakhani & Mackie, 2015). Of these, infrastructure in water, energy, telecommunications and transport, etc., are the backbone of an economy, and the necessary foundation on which further capital investment depends for economic traction (Ghosh & Meagher, 2015). As such, FDI in infrastructure is a priority in developing countries (Andersen & Dalgaard, 2013; Fernando et al., 2017). Research shows that FDI is affected by the context of the host country (Méon & Sekkat, 2012). And, political risk stands out as a significant determinant (Khanzadi, Eshtehardian, & Mokhlespour Esfahani, 2017). That is, political risk in developing countries, such as violent conflicts, expropriation of foreign assets and corruption, is characteristically higher than in developed countries, while foreign investors favour stable political environments (Hosseini et al., 2018). Thus, the claim is made that political risk impedes FDI inflows to developing countries (Clare & Gang, 2010). Infrastructure investment is considered particularly risky (Burcar Dunovic, Radujkovic, & Vukomanovic, 2016), and consequently thought of as more sensitive to political risk (Hosseini et al., 2018). Because infrastructure investment is characterized by high monopolization, large investment amounts, long payback periods, along with a special class of consumers, namely the government (Dailami & Leipziger, 1998; Hosseini et al., 2018). At the same time, developing countries are generally characterized by weak policy frameworks and political instability, which threaten infrastructure investment return security (Banihashemi, Hosseini, Golizadeh, & Sankaran, 2017). FDI in infrastructure, termed as “FDII” in this study, refers to a particular class of FDI, defined by the World Bank, as projects in telecommunications, power, gas, ports, railways, roadways, airports, sewage treatment and water supply, and information and communication technology (World Bank, 2001). Given this background, FDII is clearly influenced by political risk (Henisz, 2000; Hayakawa, Kimura, & Lee, 2013). Consequently, infrastructure investment requires a stable political environment, which is often problematic in developing countries (Doh & Ramamurti, 2003; Finkenzeller, Dechant, & Schäfers, 2010; Derakhshanalavijeh & Teixeira, 2017). Despite this evidentiary relationship, a review of the literature reveals several shortfalls. First, few studies have attempted to ascertain the existence of an association between political risks and FDII (Banaitienė et al., 2015). Second, of these only a limited number of indicators of political
136
W. Jiang et al. Foreign infrastructure investment in developing countries: a dynamic panel data ...
risk have been taken into account. As examples, Keeley and Ikeda (2017) focused on the impacts of policy support and corruption, while Castells and Solé-Ollé (2005) confined their investigation to the effects of political risk on infrastructure investment in regional areas. To date, a systematic, quantified assessment of the impacts of political risk on FDII in developing countries, in which a comprehensive set of indicators of political risk are considered, is still missing. This study aims to fill this gap. In so doing, it identifies how FDII responds across a range of political risks in developing countries; it quantifies that response and contrasts it with the response of FDI to those same political risks. The remainder of the study is organised as follows: first, the historical trend of FDI, FDII, GDP is presented, complimented by a review of available studies on the relationship between political risk and FDI, and, political risk and FDII. This is followed by a presentation of the research methods used, the rationality behind the input data. In the subsequent section, the results of the model estimations, and along with a discussion are offered. The study concludes by setting out the practical implications of the findings for researchers, as well as for practitioners in the construction industry.
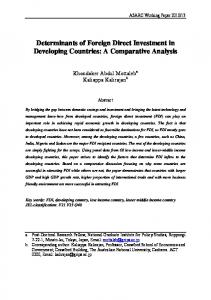
1. Foreign investment and political risk 1.1. FDI and FDII in developing countries Oatley (2012, p. 376) describes FDI as “A form of cross-border investment in which a resident or corporation based in one country owns a productive asset located in a second country”. Kerner (2014) adds that Oatley’s definition requires that the source of capital must be foreign. Sobel (2006, p. 460) definition is, however, more precise: FDI is “Investment in control of productive facilities overseas–usually defined by an investment that amounts to control of 10% or more of a company’s equity”. In this definition, the local capital controlled by multinational corporations is taken into account. Since it is difficult to disaggregate capital from its ownership, Sobel’s definition is taken for the purposes of this study. FDI flows to developing countries have increased steadily since 1985, as can be seen in Figure 1. As far back as two decades ago, Sanchez‐Robles (1998) pointed out that infrastructure investment has a positive and significant relationship with a country’s GDP. It has also been shown that FDII rises during economic downturns (Bitsch, 2012), and this was confirmed during the Asian financial crisis of 1998 as well as in the global financial crisis of 2008. Contrary to the predictions of Ramamurti and Doh (2004), FDII has continued to rise since. See Figure 1. Privatisation in infrastructure took off in the 1990s when governments transitioned from public to private funding of projects as a means of keeping up with increasing infrastructure demand. The involvement of private investment introduced competition which gradually overturned national and even regional monopolies (Nem Singh & Chen, 2017). Competition also allowed investors to expand into developing countries, stimulating FDI (Ramamurti & Doh, 2004). As Figure 1 shows, FDI has been growing ever since. And, FDII, as a component of FDI, has been particularly resilient in the face of the financial crises of 1998 and 2009, and has remained steady since.
137
Technological and Economic Development of Economy, 2019, 25(2): 134–167 35000000
1600000
30000000
1400000 1200000
25000000
1000000
20000000
800000
15000000
600000
10000000
400000
5000000
200000
0
GDP
0
FDII
Infrastructure investment
FDI
Figure 1. GDP/FDII/FDI/infrastructure investment from 1984 to 2015 (data resourcing from World Bank (2016) and PPIF (2016))
As for the regional distribution of FDII among developing countries, Latin America, with 44% of FDII between 1984 and 2015, takes by far the biggest slice. Brazil, Chile, Colombia and Mexico are the key destinations. 18% of the cumulative FDII flowed to East Asia and the Pacific from 1984 to 2015, putting it in second place. Europe and Central Asia share a similar Figure at 15%, though prior to 2014 it was higher than that of East Asia. FDII into Sub-Saharan Africa and South Asia is 10% and 7%, respectively, while the Middle East and North Africa, combined, receive just 6%. In terms of FDII distribution by industry, telecommunication investment in developing countries accounts for nearly half, growing rapidly since 2004. By contrast, water and sewerage accounted for only 3% of the cumulative FDII from 1984 to 2015. It is difficult for foreign investors to enter these markets, and that may be because of high transaction costs, regulatory weaknesses and the requirement of special technical standards (Kirkpatrick, Parker, & Zhang, 2006). With the development of new energy sources and renewable energy such as solar, wind and biomass, energy investment has grown to 36% of FDII. FDII in transport is 15%, but has fluctuated in recent years.
1.2. Political risk: indicators and impacts Investors crossing international borders face additional risks not encountered at home (Shen et al., 2017). Among the risks, political risk plays a key role with regards to decisions on international expansion, foreign investment, the market value of multinationals, and ownership of multinational firms in host countries (Kesternich & Schnitzer, 2010; Zavadskas, Turskis, & Tamošaitiene, 2010; Kyaw, Manley, & Shetty, 2011; Méon & Sekkat, 2012; Jiménez, Ongena, Peydró, & Saurina, 2014b). Political risk are political events in a country that impact the business climate in such a way as to rupture reasonably expected returns, namely: political changes that influence future cash flows (Howell, 2011; Bekaert, Harvey, Lundblad, & Siegel, 2016). The problem of political risks is particularly acute in developing countries (Bekaert et al., 2016; Fernando et al., 2017; Hosseini et al., 2018; Ramamurti & Doh, 2004). Unstable
138
W. Jiang et al. Foreign infrastructure investment in developing countries: a dynamic panel data ...
political environments mean that foreign investors must risk extra expenditure on foreign infrastructure investment while receiving reduced returns as a consequence of rent seeking, expropriation, increased tax and so on (Spiller & Savedoff, 1999; Zavadskas, Ustinovichius, & Stasiulionis, 2004). Given the infrastructure shortfall in developing counties (Ghoddousi & Hosseini, 2012), FDI has become essential to infrastructure projects (World Economic Forum, 2017a). However, infrastructure investment is usually thought of as high-risk, and the extra-dimension of cross-border investment amplifies the concerns (Henisz, 2000; Bekaert et al., 2016). Moreover, FDII in developing countries, with uncertain longer-term regulatory constraints on the one hand, and dynamic policy regimes on the other, further compound the risks (Finkenzeller et al., 2010). Unstable political environments deplete contingency funds, exact extra expenditure and ultimately diminish profits (Spiller & Savedoff, 1999; Fernando et al., 2017). The long-term nature of FDII also makes it more difficult to extract investments, repatriate profits, or even cancel projects to limit losses. Combined with a host government’s proclivity to milk those profits that do accrue to foreign investors through rent seeking, variable taxation, fines, or even expropriation, those investment risks may be assessed as extreme. These conditions are described in a full thirty-one previous studies that examine the effect of political risk on FDI. See Table 1.
1.3. Critical appraisal of previous studies As inferred from Table 1, previous studies e.g. (Henisz, 2000; Doh & Ramamurti, 2003; Kesternich & Schnitzer, 2010; Kyaw et al., 2011; Méon & Sekkat, 2012; Jiménez et al., 2014a; Bekaert et al., 2016), have established that political risk greatly affects FDI and infrastructure investment. Nevertheless, research into the relationship between political risk and FDI on infrastructure investment (FDII) in developing countries, remains limited (Banaitienė et al., 2015; Keeley & Ikeda, 2017). Indeed, there are few studies applying a comprehensive range of political risk factors in the search for the relationship between political risk and FDI (Busse & Hefeker, 2007; Hayakawa et al., 2013; Osabutey & Okoro, 2015). When considering FDI in the infrastructure sectors in developing countries, this becomes scarcer still, which is the impetus for the current study. All studies on the effect of political risk on FDII agree that political risk significantly deters FDII (Ramamurti & Doh, 2004; Kirkpatrick et al., 2006; Keeley & Ikeda, 2017). As for the impact of political risk on infrastructure investment, most arrive at the general conclusion that political risk would reduce infrastructure investment (Percoco, 2014). Table 1 also reveals that no individual study has considered more than three of the twelve indicators of political risk, while six of the twelve factors have never been considered at all in any study. The most commonly studied parameter was corruption and democratic accountability. Again, most studies report a negative relationship between these parameters and investment (Busse & Hefeker, 2007; Elfakhani & Mackie, 2015; Osabutey & Okoro, 2015), with one dissenting finding, that suggests investment favours corruption (Hines, 1995; Egger & Winner, 2005).
N
N
N
N
–
N N
Finkenzeller et al. (2010)
Vadlamannati (2012)
Williamson (1976)
N
N
Doh & Ramamurti (2003)
N
N
Castells and Solé-Ollé (2005)
Percoco (2014)
N
Tsai & Su (2005)
N
N N
N
Castells and Solé-Ollé (2005)
Correa-Henao, Yusta, and Lacal-Arántegui (2013)
N
Dailami and Leipziger (1998)
N
– N
General political risk
Spiller (1993)
N
Bureaucracy Quality
N
N
– –
Democratic Accountability
DEMACC BURQUA
N
N
Ethnic Tensions
ETHTEN
Henisz and Mansfield (2006)
–
N
Law and Order
LAWORD
Henisz and Zelner (1999)
N
– –
Religion in Politics
RIPPOL
N
P
N
Military in Politics
MIPPOL
Political risk
Keeley and Ikeda (2017)
N
Corruption
CORRUP
N
N
External Conflict
EXTCON
N
–
N
Internal Conflict
INTCON
Ramamurti and Doh (2004)
N
Investment Profile
INVPRO
Kirkpatrick, Parker, and Zhang (2004)
N
N
Socioeconomic conditions
Government stability
FDII (This paper)
Infrastructure investment (Related studies)
FDII (Related studies)
FDI (This paper)
Research on FDII, FDI and infrastructure investment
SOCCON
GOVSTA
Table 1. Literature on the relationship between political risk and FDII, infrastructure investment and FDI
Technological and Economic Development of Economy, 2019, 25(2): 134–167
139
–
N
N
N
Alesina and Weder (2002)
N N
Lambsdorff (2006)
Aizenman and Noy (2007)
Long (2008)
P
Egger and Winnerb (2005)
Jensen (2005)
N
N
N
–
N
Law and Order
LAWORD
Li and Resnick (2003)
–
N
–
Religion in Politics
RIPPOL
N s
–
–
–
Military in Politics
MIPPOL
Political risk
Jensen (2003)
Busse (2003)
Kolstad and Tondel (2002)
N
N
Abed and Davoodi (2000)
Globerman and Shapiro (2002)
N
Wei (2000)
Mansfield, Milner, & Rosendorff (2000)
N
N
N
N
N
N
Corruption
CORRUP
N
–
N
–
N
N
External Conflict
EXTCON
P
N
N
Internal Conflict
INTCON
Campos, Lien, and Pradhan (1999)
–
N
–
Investment Profile
INVPRO
Hines (1995)
Nigh (1985)
N
Hayakawa et al. (2013)
Osabutey and Okoro (2015)
–
Socioeconomic conditions
Government stability
N
SOCCON
GOVSTA
Busse and Heferker (2007)
Research on FDII, FDI and infrastructure investment
FDI (Related studies)
N
–
N
N
Ethnic Tensions
ETHTEN
N
N
N
N
N
N
N
Democratic Accountability
–
–
N
Bureaucracy Quality
DEMACC BURQUA
N
General political risk
Continue of Table 1
140 W. Jiang et al. Foreign infrastructure investment in developing countries: a dynamic panel data ...
N
N
Internal Conflict
N
N
External Conflict
EXTCON
N
Corruption
CORRUP
Bekaert et al. (2016)
Elfakhani and Mackie (2015)
Kim (2015)
Iloie (2015)
Lee, Biglaiser, and Staats (2014)
Tosun, Yurdakul, and Iyidoğan (2014)
Kucera and Principi (2014)
Jiménez, Luis-Rico, and Benito-Osorio (2014a)
N
N
N
Investment Profile
INTCON
N
Socioeconomic conditions
Government stability
INVPRO
Mathur and Singh (2013)
SOCCON
GOVSTA
Sadig (2009)
Méon and Sekkat (2012)
Kesternich and Schnitzer (2010)
Li and Vashchilko (2010)
Finkenzeller et al. (2010)
Biglaiser and Staats (2010)
Li (2009)
Guerin and Manzocchi (2009)
Research on FDII, FDI and infrastructure investment
FDI (Related studies)
Military in Politics
MIPPOL
Political risk
Religion in Politics
RIPPOL
N
N
N
Law and Order
LAWORD Ethnic Tensions
ETHTEN
N/P
N
N
Democratic Accountability Bureaucracy Quality
DEMACC BURQUA
N
N
N
N
General political risk
End of Table 1
Technological and Economic Development of Economy, 2019, 25(2): 134–167
141
142
W. Jiang et al. Foreign infrastructure investment in developing countries: a dynamic panel data ...
Previous research findings on the impact of political risk on FDI are largely consistent, but not always. For example, Busse and Hefeker (2007) and Hayakawa et al. (2013) have found that stable government control is essential in attracting FDI in developing counties, while Osabutey and Okoro (2015) found there is no evident effect of government stability on FDI. Only Hayakawa et al. (2013) found any significant impact of religion on FDI. As for corruption, most related studies report negative impacts of corruption on FDI (Busse & Hefeker, 2007; Elfakhani & Mackie, 2015; Osabutey & Okoro, 2015), though, corruption was found to promote FDI to some degree, according to Hines (1995) and Egger and Winner (2005).
2. Conceptual model of the study This review of the literature informs a conceptual model encapsulating the links between political risks with FDI and FDII, as illustrated in Figure 2. On the basis of previous studies, political risk is anticipated to have negative effects on FDI and FDII (Henisz, 2000; Doh & Ramamurti, 2003; Kesternich & Schnitzer, 2010; Méon & Sekkat, 2012; Jiménez et al., 2014a; Bekaert et al., 2016). However, FDI and FDII are not only affected by political risk, but also impacted by other macro factors (Espinosa-Ramírez, Kayalica, & Kumaû, 2015). These factors include macroeconomic environment, infrastructure stock, market size, and include GDP, GDP growth and population. In fact, GDP, GDP growth, population, macroeconomic environment, and infrastructure quality have all been employed across a considerable spread of research investigating political risk and FDI (Bergara, Henisz, & Spiller, 1998; Henisz, 2000; Delios & Henisz, 2003; Henisz & Mansfield, 2006; Busse & Hefeker, 2007; Bjorvatn & Farzanegan, 2015). FDI and infrastructure are closely related to a country’s economy, but economies also rely on a country’s political institutions and law environment capacity (Globerman & Shapiro, 2002). Such macro factors are frequently used as control variables in related research (Delios & Henisz, 2003; Slangen & Van Tulder, 2009; Méon & Sekkat, 2012). As illustrated in Figure 2, GDP, GDP growth rate, population, macroeconomic environment and infrastructure, were all positively associated with FDI in the infrastructure of developing countries. Macroeconomic environment
Infrastructure in stock
FDI
Political risk
FDII
Market size
GDP
GDP growth
Population
Figure 2. The conceptual model
Infrastructure in stock
143
Technological and Economic Development of Economy, 2019, 25(2): 134–167
3. Research methods This study investigates the impacts of political risk on both FDI and FDII. The research design is as illustrated in Figure 3. It is common to estimate such relationships using models with fixed effects (Arel-Bundock, 2017) or random effects (Buckley et al., 2010) for the panel data. In considering the variance of the 90 developing countries, the F-test is used to show that a common intercept for all the countries is not viable. The approach recommended by Hausman (1978) suggests using a fixed-effects model to control for country fixed effects in the benchmark model. Multinational companies respond only partially to political and economic changes in the short term (Busse and Hefeker, 2007) with many investment decisions taking time to develop (Zeng & Singh, 1996). Thus, the previous year’s investment is taken into consideration with a lagged of one period (of one year) for all the independent variables, allowing for an adjustment in FDII. The specification of the fix-effects model is as follows: Yit = α1Yi ,t −1 +
∑ i −2 αi Xk,t −1 + μi + εit . n
(1)
Where Yit represents the dependent variable and Yi, t–1 is the lag of Yit. Xit stands for the independent variables, αi represents the estimated parameters for independent variables, μi is individual fixed-effect, and eit is an error term. Following Busse and Hefeker (2007), the system generalised method of moments (GMM) estimator is used for the fixed-effects model. This estimator is deemed suitable for this process, given that a dynamic process (with current Yit depending on its own and related past realizations) is used, a linear function relationship, Developing countries Infrastructure investment
FDI Literature review
Macroeconomic environment
Political risk
FDI
Political risk Infrastructure in stock
Market size
GDP
GDP growth
Macroeconomic environment
FDII
Infrastructure in stock
Propose hypothesis
Market size
GDP
GDP growth
Population
Hausman test Fixed-effect models for FDI and FDII F test Hypothesis identification
Population
Model results Analysis Variable data
Effect comparison for FDI and FDII Conclusion
Figure 3. The research design
System GMM estimator
Panel data
Small T, large N Exogenous Variables Fixed effects A dynamic process
Panel data in this study
144
W. Jiang et al. Foreign infrastructure investment in developing countries: a dynamic panel data ...
with the independent variables in our research not strictly endogenous. Moreover, effects are fixed, with the data in this study in the form of small T, and large N panel (the number of time periods is far below the number of panels) (Roodman, 2006). The research process requires several steps: identifying variables needed to measure the impacts of political risk on FDI and FDII, a review of the literature review, and then encapsulating these in the form of a conceptual model; proposing hypotheses to assess the validity of associations as reflected in the conceptual model impacts. This involves translating these hypotheses into mathematical models (see Eqn (1)) and exposing them to imperial data. The analyses of the model using the data will reveal the impacts of political risk indicators on FDI and FDII in quantitative terms. The sections that follow describe the aforementioned stages in detail. 3.1. Model variables
With reference to Equation (1) and (2), the dependent variables were: FDI and FDII (in $U.S. billion). FDI values were obtained from the (World Bank, 2016), referring to the net foreign equity inflows of investment into the 90 developing economies. It is the sum of equity capital, reinvestment of earnings, and other capital. Direct investment is a category of cross-border investment where a resident of one economy has control or a significant degree of influence on the management of an enterprise that is resident in another economy. Ownership of 10% or more of the ordinary shares of voting stock is the criterion for determining the existence of a direct investment relationship. Data are in U.S. dollars adjusted to 2016 (World Bank, 2016). FDII was extracted from the PPIF database (PPIF, 2016), and refers to FDI flows into the infrastructure, without consideration of second or third order upstream or downstream multiplier effects created by foreign investors. Thus, the reported FDII underestimates the real extent of impact by foreign investors in the infrastructure sector in host countries. If the potential bias is uniform across countries and time, the results will be consistent with the level of sign and significance for estimated coefficients, otherwise, the estimated coefficients will be overestimated. The independent variables: were political risk indicators introduced by the International Country Risk Guide index (ICRG), and provided by Political Risk Services (PRS), regarded as the most widely-used institutional measure (Williams & Siddique, 2008; Fan, Lin, & Treisman, 2009). All the twelve measures were used (Howell, 2011), as shown in Table 2. Each of the twelve indicators has a political risk score range. The scores for GOVSTA, SOCCON, INVPRO, INTCON and EXTCON, range from 0 to 12. Scores for CORRUP, MILPOL, RELPOL, LAWORD, ETHTEN and DEMACC, range from 0 to 6. BURQUA ranges from 0 to 4. In all cases, a higher value is indicative of less political risk (greater political stability). Similarly, a score of 0 is indicative of greatest political risk (minimum political stability). In this paper, the twelve political risk indicator values for the 90 developing countries (see Appendix, Table A1) examined are aggregated over the years 2006 to 2015. Five indicators are employed as control variables (see Table 2 for details), including macroeconomic environment, infrastructure situation, GDP, GDP growth and population.
Technological and Economic Development of Economy, 2019, 25(2): 134–167
145
Table 2. The description of variables
Independent variables
Dependent variables
Variables
Description
Source
FDI
It refers to the net foreign equity inflows of investment into the 90 developing World Bank economies. It is the sum of equity capital, reinvestment of earnings, and other database (2016) capital.
FDII
FDII refers to FDI flows into infrastructure without consideration of second PPIF database or third order upstream or downstream multiplier effects created by foreign (PPIF, 2016) investors.
Government stability
It assesses the government’s ability to implement its policy and to stay in position. It includes three subcomponents: government unity, legislative strength, popular support. Points range from 0 to 12.
Socioeconomic conditions
It consists of unemployment, consumer confidence and poverty, and measures socioeconomic pressures at work in society that might restrain government action or arouse social dissatisfaction. Points range from 0 to 12.
Investment Profile
It evaluates the factors that affect the risks to investment which are not covered by other political, economic and financial risk components. Its score is a sum of contract viability/expropriation, profits repatriation and payment delays. Points range from 0 to 12.
Internal Conflict
It mainly focuses on civil war/coup threats, terrorism/political violence and civil disorder, which weighs political violence in the country and its actual or potential impact on governance. Points range from 0 to 12.
External Conflict Corruption Military in Politics
It measures the risk of the government suffering from foreign action, ranging from non-violent external pressure including diplomatic pressures, withholding of aid, trade restrictions, territorial disputes and sanctions, to violent external pressure. Points range from 0 to 12. International It assesses the corruption level within a country’s political system. Points range Country Risk Guide index from 0 to 6. (ICRG, 2016) It indicates the extent of military intervention in government because of an actual or imagined internal or external threat. Points range from 0 to 6.
Religion in Politics
It assesses the degree of a religious group’s desire to separate from the country as a whole, which originates from the domination of society and/or governance by a single religious group that seeks to replace civil law with religious law and to exclude other religions from the political and/or social process. Points range from 0 to 6.
Law and Order
It evaluates law and order separately, namely the strength and impartiality of the legal system and popular observance of the law. Points range from 0 to 6.
Ethnic Tensions
It weighs the degree of tension within a country attributable to racial, nationality, or language divisions. Points range from 0 to 6.
Democratic It reflects the degree of responsiveness of government to its people and relevant Accountability civil liberties. Points range from 0 to 6.
Control variables
Bureaucracy Quality
It scores the institutional strength and quality of bureaucracy, which plays a great role in cutting down the policy revision if governments transform. Points range from 0 to 4.
Gross DomesIt serves as a proxy for market size, with the World Bank database (2016). The tic Product World Bank database (2016) is used as source. World Bank (GDP) database GDP growth It shows the country’s market growth and potential. (2016) It assesses a country’s economic development and is used as a proxy for ecoPopulation nomic attractiveness when taking a country’s size into account. It is a proxy for the investment environment of foreign investment inflows, and assesses government budget balance, gross national savings, inflation, general government debt, and country credit rating. It employs a seven point scale from 1 to 7, with 7 indicating the best environment. World It assesses the quality of overall infrastructure across the 90 developing coun- Economic tries, including the quality of roads, railroads, ports, and air transport. It calcu- Forum (2016) Infrastructure lates available airline seats km/week ($U.S. million), fixed telephone lines/100 population, and mobile telephone subscriptions/100 population. It employs a seven-point scale from 1 to 7, with 7 indicating the best environment.
Macroeconomic environment
146
W. Jiang et al. Foreign infrastructure investment in developing countries: a dynamic panel data ...
The dataset runs over the period 2006–2015, covering a sample of 90 developing countries. Datasets are integrated as described in Appendix, Table A2. While there are some 140 recognized developing countries, the dataset included only 90 of these, as recognised and drawn from the Country Risk Guide. Despite this limitation, the 90 countries represent a balance cross-section of 21 low, 33 low-middle, and 36 upper-middle income countries. This income cross-section is necessary to an exploration of the overall effects of political risk on FDII among developing countries. Other studies that employed the same political dataset and had similar study goals also adopted a similar country range. Examples include Busse and Hefeker (2007) and Fan et al. (2009). Data range adopted is from 2006 to 2015, as this is the limit of the range for infrastructure in stock and macroeconomic environment available. This is deemed comprehensive enough, given the broad time frame covered by the data and in view of the number of countries included (90 developing countries as shown in Appendix Table A1). Regarding PPIF database, the infrastructure projects with sole domestic investors are not taken into consideration, and for projects invested by domestic and foreign investors, only the percentage share of foreign investors is considered. Appendix Table A3 shows the descriptive statistics for the variables in the dataset.
3.2. Hypotheses testing As per the conceptual model defined in Figure 2 and the variables tabulated in Table 2, the three hypotheses below were formulated: –– H1: Increase in political risk reflected in the twelve indicators is negatively associated with the amount of FDI. –– H2: Increase in political risk reflected in the twelve indicators is negatively associated with the amount of FDII. –– H3: An increase in political risk will reduce foreign investment, but the investment reduction will be greater for FDII than for FDI. Given the large data spread between some variables, with the political risk of the ICRG ranging from just 0 to 100, with the control variables for GDP and population being so much greater, GDP and population are described using logarithmic values.
3.3. Analyses techniques A fixed-effects model based on dynamic panel data drawing from the lessons by Busse and Hefeker (2007) was used to test the hypotheses. The country size was taken into account, thus, the direct variables were applied. Through the method, a linear relationship among the dependent, independent and control variables was built, as illustrated in Eqn (2) and Eqn (3). The regression can be written as follows:
FDII it = α0 FDIIi ,t −1 + α1FDIIi ,t −2 + βi PORi ,t −1 + α2GDPi ,t −1 + α3GDPgrowthi ,t −1 + (2) α 4 Populationi.t −1 + α5 Infrastructurei.t −1 + α6 Macroeconomici ,t −1 + ε0 + eit ; FDI it = α0 FDIi ,t −1 + α1FDIi ,t −2 + βi PORi ,t −1 + α2GDPi ,t −1 + α3GDPgrowthi ,t −1 + (3) α 4 Populationi.t −1 + α5 Infrastructurei.t −1 + α6 Macroeconomici ,t −1 + ε0 + eit .
Where ε0 represents the country-specific fixed effect, βi are the estimated parameters for
Technological and Economic Development of Economy, 2019, 25(2): 134–167
147
political risk (for country i and period t–1), αi are the estimated parameters for control variables (for country i and period t–1), eit is an error term, and PORi,t–1 represents one of 12 political risk components. The dependent and independent variables are endogenous, as defined in Figure 2. When FDI or FDII flows into a host country, certain technologies are also brought into that country which can be expected to improve that countries development, such as DGP and GDP growth (Busse & Hefeker, 2007). For independent variables, all the political risk indicators from the ICRG are shown in relation to each other. See Appendix Table A4. For instance, government stability is significantly associated with law and order, which means that the strength and impartiality of the legal system and popular observance of the law supports the government’s unity and legislative strength. In turn, government stability can ensure the effectiveness of the legal system. The application of instrumental variables can effectively manage this association. Thus, the political risk indicators are added into the models sequentially. On the basis of the above considerations of the dynamic nature of the panel data, an Arellano and Bond (1991) GMM estimator, was selected. In its basic form, however, it can weaken the actual association between the political risk and FDII, by inducing finite sample bias (Alonso-Borrego & Arellano, 1999). A variant system GMM estimator, developed by Arellano and Bover (1995), can however offer smaller finite sample bias than the GMM estimator (Kim & Kang, 2009). The two-stage system GMM estimator is the combination of horizontal regression and differenced regression, in which the lagged horizontal variables are set as instruments and the first differences are set as instruments for horizontal variables (Blundell & Bond, 1998). A system Arellano-Bond GMM estimator to treat the panel data was used. The GMM estimator results are calculated using STATA 14.0 in which the coefficients and significance of each political risk component on FDI and FDII are extracted separately. Once the econometric results were retrieved, the average of the control variables, calculated for each single country across every year, were placed into the model, with dependent variables changed accordingly. The model was initiated when the data averages for every indicator were placed into the model, with resultant variances generated for FDI and FDII. See Appendix Table A3. In order to test for remaining outstanding bias of standard error in the two-stage system GMM estimator, the Sargan test (Blundell & Bond, 2000) was applied to check for overidentifying restrictions, and the Arellano-Bond test (Roodman, 2006) to check for correlation of the error terms that provide assurance of the effectives of the results (Arellano & Bond, 1991; Windmeijer, 2005). Finally, vce (robust) was employed to correct standard error of results (Windmeijer, 2005). The outcome was a robust model able to reveal the effects of various forms of political risk on FDI and FDII.
4. Findings of the study 4.1. Hypotheses test outcomes Table 3 displays the results for the sys-GMM estimation in the dynamic panel data. The results of the 12 political risk indicators are displayed in columns (2) to (13). All the results
148
W. Jiang et al. Foreign infrastructure investment in developing countries: a dynamic panel data ...
of the Sargan test exceed 0.05, which indicates that the null hypothesis cannot be rejected at a level of 5% significance. That is, the regression model may be accepted. The p-values of the Arellano-Bond test are shown in the AB test row in the tables. The p-values of ArellanoBond test for AR (2) are all higher than 0.1, making it possible to accept the null hypothesis of no autocorrelation. Thus, it is sufficiently demonstrated that there is no autocorrelation in first-differenced errors. As a result, the Arellano-Bond GMM estimator results of Table 3 cannot be rejected. Table 3 also shows that lagged FDII and lagged FDI are all negative and significant in the estimator models. In the Table 3 regression, country’s GDP, GDP growth, population and infrastructure, all markedly promote FDI inflows. Only GDP and GDP growth markedly influence FDII inflows. That is, if a country maintains a high GDP and GDP growth rate, its market will also grow fast. On the other hand, the macroeconomic environment, including inflation, general government debt, country credit rating, as well as population affects FDII significantly and negatively. The reason for the difference may lie in the fact that FDII may be more sensitive to the macroeconomic environment which influences investors’ decisions as to whether to invest or not. As FDII is usually in high demand, this may impact its sensitivity to the macroeconomic environment. Overall, most of the control variables are within expectations, which further confirms that the benchmark regression is acceptable. As for impact results, scores of government stability, socioeconomic conditions, internal conflict, external conflict, corruption, religion in politics, law and order, all occur in a positive relationship with FDII inflows at the 1% significance level. This indicates that the riskier these political risk factors, the less FDII inflows can be expected. Investment profile scores are significant and positive at the 5% level, indicating this risk may negatively impact FDII, but hold the proposition with less statistical confidence. However, military in politics and ethnic tensions scores are negative and insignificant with regard to FDII, indicating no significant effect. Similarly, democratic accountability scores and bureaucracy quality scores show non–significant contribution to FDII. FDI, scores for government stability, socioeconomic conditions, internal conflict, external conflict, law and order, and bureaucracy quality are all positive and significant at the 1% level. This indicates that an increase in these political risk factors will decrease FDI inflows. Democratic accountability scores are positive, but only at the 10% level, suggesting less confidence in the relationship. The scores for corruption, military in politics, and ethnic tensions are however in a negative relationship with FDI, suggesting that an increase would in fact attract FDI. However, only the result for corruption shows a strong statistical confidence. Scores for investment profile and religion in politics show no significant relationship with FDI.
4.2. The revised model The findings of the study are encapsulated in Figure 4, which shows a revised version of conceptual model of the study, adjusted in the light of the empirical data. The findings are discussed with respect to two issues. Firstly, the outcomes of the model in this research regarding the impact of political risk on FDI and FDII are explained. Secondly, the impact of political risk on FDI as found in this study is is contrasted against that of political risk on FDII.
FDII
588
90
Observations
Number of country
AB test
90
675
0.2943
(5.469)
(4.641)
0.4238
–126.1***
81.73***
0.1476
(1.094)
0.0892
28.26***
0.342
(1.081)
0.3186
(0.652)
(0.893)
0.1312
0.812
Prob(J-statistic)
(0.00283)
(0.00283)
(0.00297)
–20.61***
46.70533
–0.0382***
0.888***
–0.0403***
90
588
0.4281
0.3187
0.0931
46.4661
(5.303)
95.17***
(1.206)
0.208
(0.937)
–20.42***
(0.0629)
(0.0711)
(0.0559)
1.335***
2.592***
90
675
0.2818
0.15
0.1003
46.04422
(8.663)
–80.15***
(1.411)
26.77***
(0.825)
0.733
(0.00357)
0.921***
(0.0868)
2.762***
(0.0000259) (0.0000591) (0.0000285)
1.321***
0.0339***
(0.0000555)
0.00755***
0.0340***
0.00765***
(0.990)
(0.000423)
(0.00043)
(1.057)
–0.491***
–0.490*** 9.557***
(0.00125)
(0.00102)
8.509***
–0.277***
(0.000158)
(0.0000927)
–0.267***
(0.000282)
–0.0606***
44.46171
FDII
0.0336***
(2.162)
9.650***
(0.00124)
–0.459***
(0.00178)
–0.216***
FDI
FDII
0.0178***
(2.470)
5.728**
(0.000155)
–0.0595***
(0.000123)
–0.0586***
0.0348***
(2.255)
4.689
(0.00122)
–0.495***
(0.00122)
–0.273***
FDI
0.00865***
(1.971)
12.05***
(0.00055)
–0.0777***
(0.000787)
–0.0871***
FDII
0.0363***
(2.871)
19.90***
(0.00248)
–0.467***
(0.00208)
–0.289***
FDI
Internal Conflict
0.00893***
(2.768)
20.58***
(0.000127)
–0.0782***
(0.000173)
–0.0777***
FDII
0.0362***
(2.830)
45.09***
(0.00116)
–0.470***
(0.00133)
–0.296***
FDI
External Conflict
0.00809***
(3.980)
65.04***
(0.000205)
–0.0632***
(0.000211)
–0.0663***
FDII
0.0345***
(3.407)
–7.388**
(0.000665)
–0.485***
(0.00117)
–0.270***
FDI
Corruption
90
588
0.9021
0.3186
0.123
44.8477
(8.327)
75.76***
(1.884)
0.277
(1.467)
–26.31***
(0.00892)
–0.013
(0.0962)
1.745***
90
675
0.5299
0.1426
0.0601
48.8497
(10.33)
–158.9***
(1.822)
13.64***
(1.435)
–10.08***
(0.00805)
0.645***
(0.14)
1.967***
90
588
0.4456
0.319
0.0916
46.55734
(11.03)
–3.463
(1.165)
0.929
(1.11)
–8.68***
(0.00353)
–0.0447***
(0.116)
1.177***
90
675
0.3101
0.1465
0.0951
46.34527
(12.76)
–225.1***
(1.942)
34.56***
(0.923)
0.948
(0.00625)
0.0843***
(0.134)
2.354***
90
588
0.37
0.32
0.1025
45.91811
(11.87)
–259.6***
(1.703)
9.632***
(1.308)
–16.73***
(0.00579)
–0.0447***
(0.0948)
0.996***
90
675
0.4759
0.1713
0.0593
48.92024
(25.34)
–669.8***
(2.52)
30.54***
(1.22)
2.657**
(0.0105)
0.772***
(0.145)
1.400***
90
588
0.7382
0.3204
0.0787
47.40003
(15.44)
–314.5***
(1.498)
–3.293**
(0.884)
–15.94***
(0.00616)
–0.113***
(0.0776)
1.049***
90
675
0.5763
0.216
0.0845
47.00689
(16.96)
–840.2***
(1.402)
26.76***
(0.911)
4.470***
(0.00538)
0.820***
(0.112)
1.250***
90
588
0.3897
0.3201
0.1254
44.73435
(7.855)
–21.92***
(1.794)
–1.243
(1.305)
–26.12***
(0.00726)
–0.0625***
(0.103)
1.143***
90
675
0.318
0.1448
0.0724
47.85592
(8.824)
–173.0***
(1.282)
27.36***
(0.941)
–0.921
(0.00326)
0.859***
(0.102)
2.606***
(0.000153) (0.0000909) (0.000068) (0.0000597) (0.000141) (0.000161) (0.000108) (0.0000696) (0.000111) (0.0000481)
0.00784***
(2.622)
19.48***
(0.000249)
–0.103***
(0.000312)
FDI –0.113***
FDII
Investment Profile
Dependent variable: FDII; FDI Socioeconomic conditions
–0.0571***
(0.000132)
FDI
Government stability
–0.0604***
–0.0579***
Sargan χ2
Constant
Infrastructure
Macroeconomic environment
Population
GDP growth
GDP
ICRG
L2. FDI
L1. FDI
L2. FDII
L1. FDII
Independent variables
Table 3. The results of GMM analysis for FDI and FDII
Technological and Economic Development of Economy, 2019, 25(2): 134–167
149
–9.18 (4.872) 0.00757*** (0.000115) 1.219*** (0.0847) –0.0439*** (0.0101) –16.79*** (1.339) 11.27*** (1.526) –150.1*** (22.19) 49.55906 0.0524 0.3202 0.5441 588 90
–0.0713*** (0.000242) –0.0729*** (0.000232)
–0.253*** (0.00171) –0.496*** (0.00076) –41.79 (4.832) 0.0348*** –0.0000504 2.566*** (0.0949) 0.808*** (0.00443) –0.68 (0.831) 27.65*** (1.479) –292.2*** (14.13) 45.88902 0.103 0.1479 0.2809 675 90 90.00*** (6.365) 0.00813*** (0.000134) 1.545*** (0.108) 0.109*** (0.0104) –3.618*** (0.673) 16.07*** (1.274) –446.1*** (11.98) 42.91717 0.1682 0.3207 0.2694 588 90
–0.127*** (0.000163) –0.123*** (0.000244) –0.320*** (0.00218) –0.516*** (0.00208) 270.4 (7.543) 0.0398*** (0.000139) 1.024*** (0.142) 0.560*** (0.011) –3.375** (1.333) –3.532** (1.717) –1,295*** (14.56) 43.27482 0.159 0.1743 0.356 675 90
FDI
FDII
FDII
FDI
Religion in Politics
Military in Politics FDI –0.0612*** (0.000194) –0.0628*** (0.000116)
FDII
FDI –0.0727*** (0.000144) –0.0714*** (0.000153)
FDII
–0.270*** (0.00169) –0.477*** (0.000816) 7.346* (3.774) 0.0343*** (0.0000477) 2.260*** (0.105) 0.875*** (0.00491) 3.556*** (1.162) 43.45*** (1.848) –378.5*** (15.64) 45.83351 0.104 0.1568 0.2 675 90
FDI
Democratic Accountability
–0.279*** –0.270*** (0.00123) (0.00092) –0.489*** –0.489*** (0.000492) (0.00043) 17.01*** 51.31*** –25.87 –27.83 4.218 (6.586) (3.640) (5.389) (5.217) (3.285) 0.00776*** 0.0332*** 0.00699*** 0.0341*** 0.00744*** (0.000075) (0.0000336) (0.00009) (0.0000263) (0.0000816) 1.224*** 2.531*** 1.282*** 2.588*** 1.367*** (0.0647) (0.0844) (0.0736) (0.0753) (0.12) –0.0556*** 0.976*** –0.0231*** 0.894*** –0.0183** (0.00326) (0.00383) (0.00726) (0.00254) (0.00802) –20.23*** 0.974 –21.06*** 0.859 –16.20*** (1.044) (0.782) (1.276) (0.601) (1.307) 0.443 23.96*** –1.985* 27.62*** 7.786*** (1.089) (1.736) (1.125) (1.156) (1.47) 48.55*** 1.181 203.5*** –154.5*** –93.80*** (4.087) (11.47) (9.577) (7.716) (8.214) 42.73306 46.47215 44.25546 49.7487 47.8393 0.173 0.093 0.1357 0.0505 0.0726 0.3188 0.16 0.3185 0.1478 0.3205 0.4072 0.2418 0.4088 0.2991 0.5155 588 675 588 675 588 90 90 90 90 90
–0.0542*** (0.000131) –0.0569*** (0.000103)
FDII
Ethnic Tensions
Dependent variable: FDII; FDI Law and Order
2.777 (15.92) 0.00770*** (0.0000649) 1.294*** (0.0785) –0.0564*** (0.00397) –19.74*** (1.077) –0.192 (1.11) 45.68*** (5.028) 45.98414 0.1013 0.3188 0.4267 588 90
–0.0591*** (0.000138) –0.0611*** (0.000141) –0.305*** (0.00159) –0.430*** (0.000713) 285.0*** (31.67) 0.0345*** (0.0000818) 1.959*** (0.102) 0.621*** (0.0187) 2.745** (1.12) 38.85*** (2.283) –1,107*** (39.2) 46.67877 0.0896 0.1972 0.3823 675 90
FDI
Bureaucracy Quality FDII
Note: *denote an estimate significantly different from zero at the 10% level; **denote an estimate significantly different from zero at the 5% level; ***denote an estimate significantly different from zero at the 1% level.
Observations Number of country
AB test
Sargan χ2 Prob(J–statistic)
Constant
Infrastructure
Macroeconomic environment
Population
GDP growth
GDP
ICRG
L2. FDI
L1. FDI
L2. FDII
L1. FDII
Independent variables
End of Table 3
150 W. Jiang et al. Foreign infrastructure investment in developing countries: a dynamic panel data ...
151
Technological and Economic Development of Economy, 2019, 25(2): 134–167 Macroeconomic environment Political risk Corruption Ethnic tension Military in politics Infrastructure in stock
FDI
9 political risk components
FDII
Infrastructure in stock
GDP growth GDP Population
Figure 4. The revised model
4.3. The comparison of effects of political risk: FDI and FDII Though the aim of this study is to identify and describe the impact of political risk on FDII, this study has also measured the impact of political risk on conventional FDI. By situating the current findings regarding FDI within the broader research context on this topic, it lends a comparative perspective on the extent and magnitude of the differences political risk impose when the foreign direct investment is made specifically in infrastructure. See Table 4. The results in Table 4 show the impact degree of all the political indicators on FDII. This is in line with the findings of Méon and Sekkat (2012) who explored the effect of political risk on FDI waves, and is consistent with Henisz (2002) who found an association with institutional environment and FDI. However, the macroeconomic environment is not shown to be significant, which accords with the proposition that FDI is not affected by inflation (Busse & Hefeker, 2007). However, only three of these examine the complete range of twelve Political Risk Rating index factors that are recognized to comprise the dimensions of political risk, and which are employed in this study. Those three studies are Busse and Hefeker (2007), Hayakawa et al. (2013), and, Osabutey and Okoro (2015). In these three studies, risk factors were found to have either a negative impact or negligible impact. No positive impact was found. The three studies agree that lack of democratic accountability and corruption discouraged investment, but they also agree that military intervention in politics has no effect. Some of indicators have the same effect direction on FDI and FDII in our research. Military in politics and ethnic tension show no effects on FDI and FDII as the three previous studies (Busse & Hefeker, 2007; Hayakawa et al., 2013; Osabutey & Okoro, 2015). This may be counterintuitive, and while it is anecdotally reported as being influential, only the
152
W. Jiang et al. Foreign infrastructure investment in developing countries: a dynamic panel data ...
Table 4. The comparison of effects of political risk on FDI and FDII Political risk indicators Corruption
△FDII △FDI △FDI Ranking △FDII (%) Ranking (billion USD) (billion USD) (%) 6.504
101.06%
1
–0.738
–0.64%
12
Investment Profile
5.728
30.37%
2
4.689
11.82%
4
External Conflict
2.058
23.82%
3
4.509
5.03%
5
Law and Order
1.701
21.49%
4
5.131
14.30%
3
Socioeconomic conditions
1.948
16.72%
5
0.965
0.88%
10
Religion in Politics
9.000
11.91%
6
27.040
83.98%
1
Ethnic Tensions
–2.587
–10.51%
7
–2.783
–2.34%
7
Government stability
0.851
9.03%
8
0.956
2.09%
8
Internal Conflict
1.205
8.98%
9
1.990
1.93%
9
Military in Politics
–0.918
–4.31%
10
–4.179
–3.43%
6
Democratic Accountability
0.422
2.32%
11
0.735
0.66%
11
Bureaucracy Quality
0.278
1.47%
12
28.500
50.61%
2
Note: △FDI (billion USD in 2016) and △FDI (billion USD in 2016) respectively indicate the change of FDI and FDII following the change of political risk indicators.
study by Kolstad and Tøndel (2002) report a negative effect for ethnic tensions. Regarding conflict, internal and external conflict have negative effects on FDI and FDII, which is in line with most studies, as can be seen in Table 4. Conflict would affect the executive of political institutions (Aguirre, 2016) and it would cause an unstable political environment, which makes it difficult to attract FDII and FDI inflows or to reap profits as expected, such as in the Myitsone hydropower project of the Kachin region in Myanmar, which was financed by Chinese investors. The risk indicators of government stability, socioeconomic conditions and law and order would block FDI and FDII significantly, and is in agreement with Busse and Hefeker (2007), Hayakawa et al. (2013) and Osabutey and Okoro (2015). If a government does not have strong control, being under the influence of the military, the institutions and legal system will be ineffective, which means fewer foreign investors can be expected to invest in largescale infrastructure projects (Kirkpatrick et al., 2006; Busse & Hefeker, 2007; Hayakawa et al., 2013). However, a strong legal system will provide strong and effective property rights protection, and constrain arbitrary and abrupt government decisions for foreign investors (Li, 2009), which would attract foreign investors to invest the long-term infrastructure projects. Now some 71 countries are in the process of making 208 changes in FDI laws in order to attract more FDI inflows (Elfakhani & Mackie, 2015). There are also indicators that have an opposite effect direction on FDI and FDII. As for the risk of corruption, this will deter FDII but attract FDI. The positive effects of corruption on FDI has been shown by many researchers (Hines, 1995; Egger & Winner, 2005) who proposed that corruption can offer foreign investors more ways to open a new market or generate more business. However, the relationship between corruption and FDII is negative. The main reason is that FDII requires a greater investment cost with a longer payback pe-
Technological and Economic Development of Economy, 2019, 25(2): 134–167
153
riod, while corruption would increase the investment cost without guaranteeing long-term payout (Wei, 2000; Biglaiser & Staats, 2010). The different effects confirm that corruption has different impacts on FDI when the industry types are themselves different (Brouthers, Gao, & McNicol, 2008). There are also indicators that have negative effects only on FDII, including investment profile and religion in politics. The investment profile is a sum of contract viability/expropriation, profits repatriation and payment delays, which has detrimental effects on the long-term and investment volume infrastructure projects, especially for multinational investors. Religion in politics would deter FDII significantly. The reason is that infrastructure investment is big investment which is associated with the local public. Infrastructure projects have a complicated government procedure. If religion has a big influence on government and politics, there will be a less stable political environment for foreign investors. Also, there are some indicators that have negative effects only on FDI, including democratic accountability and bureaucracy quality, which is in line with Busse and Hefeker (2007). Democratic countries have lower trade barriers (Mansfield et al., 2000) which would promote FDI inflows in developing countries (Busse, 2003; Guerin & Manzocchi, 2009; Biglaiser & Staats, 2010). Democracy also can reduce expropriation for MNC (multinational companies) (Jensen, 2006). However, the effects on FDI vary with industry, with for example, positive effects of democracy on FDI for service and manufacturing industries, and negative effects for mining and oil and gas extraction (Kucera & Principi, 2014). Thus, considering that the consumer of infrastructure investment is government, democratic accountability proves to be not as important for FDII.
4.4. Impact of risk types on foreign direct investment in infrastructure The results of this study with regard to the impact of political risk on FDI stand out. See Figure 5. Firstly, religion in politics and reduction in bureaucratic quality have a major adverse impact on FDI. Other factors such as investment profile and loss of law and order are also detractors. However, ethnic tensions and military involvement in politics are inducements to FDI, though to a limited degree. Corruption, too, is an inducement, though the effect may be considered marginal. All other factors have a small negative influence. This leaves us to consider the effect of political risk on FDII. See Figure 5. The most notable contrast is that FDII is not nearly as sensitive to religion in politics or bureaucratic quality as FDI, but rather, is very negatively responsive to corruption and investment profile. Nevertheless, apart from these two factors, for all the remaining factors FDII is shown to be more sensitive to risk factors than FDI. And again, like FDI, ethnic tensions and military in politics are attractors for investment; the effect remains small, but are greater than for FDI. In summary, while this study shows that FDI responds to political risk in much the same way as has been demonstrated in previous research on FDI, this study also confirms that FDII responds to different risk factors, and for all but two, with broadly greater sensitivity. The above explanation describes the responsiveness of FDII to various political risk factors, and contrasts this responsiveness to that of FDI, both as identified in this study and in comparison with other studies on FDI. What remains to be described is the dollar amount by which FDI and FDII can be expected to rise or fall for every incremental change in risk experienced across each of the twelve political risk factors.
154
W. Jiang et al. Foreign infrastructure investment in developing countries: a dynamic panel data ... 120.00%
Political risk indicators:
The change of investment
100.00%
△FDII (%)
△FDI (%)
80.00% 60.00% 40.00% 20.00%
Bureaucracy quality
Democratic accountability
Military in politics
Internal conflict
Government stability
Ethnic tensions
Religion in politics
Socioeconomic conditions
Law and order
External conflict
Investment profile
–20.00%
Corruption
0.00%
Figure 5. The effects comparison of political risk on FDI and FDII
5. Discussion of findings However, while the impact of political risk on FDI has been well explored in the literature, the effect of political risk on foreign direct investment in infrastructure, or FDII, has not been comprehensively described. Infrastructure investment in developing nations is crucial to their economic progress, yet developing nations are also known to labour under increased levels of political risk. Moreover, the longer-term nature of infrastructure investment suggests that such investment will be more sensitive to political risk than conventional FDI. Since the 1990s much of the developing world, to some degree or other, has sought growth strategies through the implementation of FDI. An endemic characteristic of developing countries, however, is political risk, and FDI is sensitive to that risk. Thus, much research has been carried out looking at the effects of political risk on FDI, and largely its effects are known. Nevertheless, not all FDI is the same, and in particular FDI in infrastructure, or FDII whose consumer is the government, can be expected to respond differently to political risk. Specifically, FDII is characterised large capital commitments, increased sensitivity to government interference, and long payback periods. Thus, FDII, as a subset of generic FDI, can be expected to respond differently to political risk factors. And yet, despite the critical centrality of infrastructure investment in fostering growth in developing countries, no systematic research has to date been carried out on the impact of political risk on FDII in developing countries. This study aims to address this deficiency. An Arellano-Bond GMM estimator model was used, utilising the 12 recognised political risk factors on FDI and FDII, adjusted for both dependent and independent variables, and assessing 90 developing countries over the period 2006 to 2015. The scope of the research conducted is thus extensive and comprehensive. Moreover, in pursuing the impact of political risk on FDII, this research
155
Technological and Economic Development of Economy, 2019, 25(2): 134–167
also establishes that political risk on generic FDII. This is done in order to benchmark for comparison purposes: 1) FDII risk impacts with FDI, and 2) FDI risk impacts, as determined in this study, with FDI, as found in earlier research work. This approach allows for extensive comparisons to be made regarding the differential impacts of political risk on FDII and FDI. The results, illustrated in Table 5, point to several findings: FDII has different powerful political risk indicators from FDI. Of the twelve risk indicators, only five have both a negative impact on FDI and FDII. These are government stability, socioeconomic conditions, internal conflict, external conflict, and law and order. Additionally, investment profile and religion in politics also have a negative impact on FDII, but not on FDI. By contrast, democratic accountability and bureaucracy quality have a negative impact on FDI, but not on FDII. Table 5. The comparison for GMM result and previous literature In contrast to studies
Finding No effects on FDI and FDII
Military in politics Ethnic tension
(Kolstad & Tøndel, 2002)
Internal conflict
Same effect direction
Government stability
Socioeconomic conditions
Opposite effect direction
Law and order
Negative effect on FDII Corruption
Positive effect on FDI
(Hayakawa et al., 2013; Osabutey & Okoro, 2015)
Description
This may be counterintuitive, and while it is anecdotally reported as being influential.
Conflict would affect the executive of political institutions and it would cause an unstable political environment, which makes it difficult (Aguirre, 2016) to get FDII and FDI inflows or make profits as expected, such as in the Myitsone hydropower project in the Kachin region in Myanmar invested in by Chinese investors. (Kirkpatrick et al., If a government does not have strong control 2006; Busse & ability and is easily affected by the military, Hefeker, 2007; the institutions and legal system would be Hayakawa et al., 2013; weak, which means fewer foreign investors Osabutey & Okoro, decide to invest in infrastructure projects on 2015) a large scale. (Busse & Hefeker, 2007; Li, 2009; Hayakawa et al., 2013; Osabutey & Okoro, 2015) (Globerman & A strong legal system would provide strong Shapiro, 2002; and effective property rights protection, and Jensen, 2006; Busse constrain arbitrary and abrupt government & Hefeker, 2007; decisions for foreign investors, which would Hayakawa et al., 2013; attract foreign investors to invest the longElfakhani & Mackie, term infrastructure projects. Even, there are 2015; Osabutey & 71 countries making 208 changes in FDI laws Okoro, 2015) to attract more FDI inflows in 2001. FDII needs great investment cost and long (Wei, 2000; Brouthers payback period while corruption would et al., 2008; Biglaiser increase the investment cost and there is no & Staats, 2010) guarantee about long-term payout.
External conflict
Negative effects on FDI and FDII
In line with studies
(Busse & Hefeker, 2007; Hayakawa et al., 2013; Osabutey & Okoro, 2015)
(Hines, 1995; Egger & Winner, 2005)
The positive effects of corruption on FDI has been evidenced by many researchers who proposed that corruption can offer foreign investors more ways to open a new market or have more business.
156
W. Jiang et al. Foreign infrastructure investment in developing countries: a dynamic panel data ...
End of Table 5
Negative effects only on FDI
Negative effects only on FDII
Finding
In contrast to studies
In line with studies
Investment profile
(Hayakawa et al., 2013; Osabutey & Okoro, 2015)
Religion in politics
(Hayakawa et al., 2013)
Democratic accountability
(Mansfield et al., 2000; Busse, 2003; Jensen, 2006; Busse & Hefeker, 2007; Guerin & Manzocchi, 2009; Biglaiser & Staats, 2010; Hayakawa et al., 2013; Kucera & Principi, 2014; Percoco, 2014; Osabutey & Okoro, 2015)
Bureaucracy quality
(Kucera & Principi, 2014)
Description Investment profile is a sum of contract viability/expropriation, profits repatriation and payment delays, which has fatal effects on the long-term and great investment volume infrastructure projects, especially for multinational investors. The reason is that infrastructure investment is big investment and associated with local public. The infrastructure project needs to have the complicated government procedure. If the religion has big influence on government and politics, there will be less stable political environment for foreign investors to finish the normal procure or be block by many other religious interests. Democracy countries would have the lower trade barriers which would promote FDI inflows in developing countries. Democracy also can reduce expropriation for MNC (multinational companies). However, the effects on FDI vary from different industries, for an example, positive effects of democracy on FDI for service and manufacturing industries, and negative effects for mining and oil and gas extraction. Thus, in consideration that the consumer of infrastructure investment is government, thus, the democratic is not so important for FDII.
(Busse & Hefeker, 2007)
The effects power of 12 political risk on FDI and FDII vary greatly. Perhaps more critically, of the twelve indicators, a full ten have a much stronger impact on FDII than FDI. That is, FDII is far more responsive to political risk than FDI. The two exceptions are the impacts of religion in politics and bureaucracy quality where their influence on FDI is stronger than on FDII. Corruption stands out as a particularly interesting risk indicator. It registers as having a positive influence on FDI. It is the only risk to record a positive influence. That is, countries with stronger corruption tend to attract FDI. In remarkably stark contrast, however, its effect on FDII is profoundly negative, being the risk factor with by far the strongest repulsive effect on FDII. This finding conflicts with that of Busse and Hefeker (2007) and Osabutey and Okoro (2015), but is in line with Hines (1995) and Egger and Winner (2005). In the short term, corruption can be a mechanism that invites investment for short-term gain. But where the term of investment is much longer that benefit may be off-set by the increased uncertainty of future conditions (Hosseini et al., 2018). The warning has been well made that political risk scares off investors and can be expected to dilute FDI into risky developing countries that are much in need of investment. This study draws attention to the extent of this debilitating effect, particularly in regard to FDII. Moreover, the model offered quantifies the dollar value impact of investment change for every one point rise or fall on the risk scales, across all twelve political risk categories. That is, a dollar measure of the effects of the risk profile for every developing country can be
Technological and Economic Development of Economy, 2019, 25(2): 134–167
157
generated revealing the dollar value loss of investment experienced by countries as a consequence of their risk profile. Nevertheless, the comprehensiveness of this research, from 2006 to 2015, across 90 countries, is also this papers weakness. Every country can be expected to be unique, and thus FDI and FDII investments may be expected to respond in a nuanced fashion to every countries risk profile. Pursuing these nuanced differences in risk profiles and how investors may modify investments decisions in response, offers further fertile ground for continued research. Such a line of investigation would augment understanding into the phenomenon of foreign direct investment decision making and how governments in developing countries adapt policies to mitigate political risk with the view to more effectively attract investment.
Conclusions The inhibiting effects of political risk on foreign direct investment (FDI) are well established; both through verifiable research as well as through the anecdotal wisdom of practitioners in the field. Also understood is the desire of developing countries to attract foreign investment. Principally as an impetus to enhance economic growth, but also because poorer countries need outside capital to finance that growth. The problem remains that developing countries tend to suffer from increased levels of political instability that scares off the very investment they so much need. Compounding this scenario is the particular role of foreign direct investment in infrastructure (FDII). Infrastructure is at once the first level of investment on which further investment in an economy depends, but also, due to it relatively high capital intensity and long pay-back period, is all the more averse to risks of a political nature. As well appreciated as these observations are, no study yet has managed to comprehensively quantify the effects of the various manifestations of political risk on FDII in developing countries. This study addresses this short-fall with a panel data model, drawing on twelve risk factors, across 90 developing countries, over the years 2006 to 2015. It reaffirms the overall effects of political risk on FDI, though doing so in a more comprehensive fashion. It also establishes the effects of political risk on FDII, providing a significant tool for comparing and contrasting the range of effects various parameters of risk have on both FDI and FDII. Of great interest is the power that particular risk factors have on FDI and FDII; in some cases the effects are similar, sometimes much different, and sometimes even in opposite directions. The contribution of this study to the broader community of practitioners is in the identification and quantification of the effects various political risks have on foreign investment. Especially unique is the modelling of the quantification of monetary change in investment as a response to changes in country risk profiles across the twelve political risk parameters. For the first time, practitioners will be able to ascribe a dollar amount to political risk variances, and with that knowledge set on more informed risk mitigation strategies as they pursue investment abroad. Certainly, however, this study has its limitations. The data is aggregate, pooling values across all 90 developing countries, and is conducted over a long time period. Not all countries are the same, and near history may be more relevant than far history. An exploration of these
158
W. Jiang et al. Foreign infrastructure investment in developing countries: a dynamic panel data ...
differences in finer detail may reveal additional nuances in how foreign investors respond to country risk, and indeed how individual country circumstances further moderate their attractiveness to outside investment. These considerations will be the subject of subsequent research.
References Abed, G. T., & Davoodi, H. R. (2000). Corruption, structural reforms, and economic performance in the transition economies (IMF Working Papers,WP/00/132). Aguirre, A. (2016). The risk of civil conflicts as a determinant of political institutions. European Journal of Political Economy, 42, 36-59. https://doi.org/10.1016/j.ejpoleco.2016.01.002 Aizenman, J., & Noy, I. (2007). FDI and trade – Two-way linkages? Quarterly Review of Economics & Finance, 46(3), 317-337. https://doi.org/10.1016/j.qref.2006.02.004 Alesina, A., & Weder, B. (2002). Do corrupt governments receive less foreign aid? American Economic Review, 92(4), 1126-1137. Retrieved from https://www.jstor.org/stable/pdf/3083301.pdf Alonso-Borrego, C., & Arellano, M. (1999). Symmetrically normalized instrumental-variable estimation using panel data. Journal of Business & Economic Statistics, 17(1), 36-49. Retrieved from https:// EconPapers.repec.org/RePEc:bes:jnlbes:v:17:y:1999:i:1:p:36-49 Andersen, T. B., & Dalgaard, C.-J. (2013). Power outages and economic growth in Africa. Energy Economics, 38, 19-23. https://doi.org/10.1016/j.eneco.2013.02.016 Arel-Bundock, V. (2017). The political determinants of foreign direct investment: A firm-level analysis. International Interactions, 43(3), 424-452. https://doi.org/10.1080/03050629.2016.1185011 Arellano, M., & Bond, S. (1991). Some tests of specification for panel data: Monte Carlo evidence and an application to employment equations. The Review of Economic Studies, 58(2), 277-297. https://doi.org/10.2307/2297968 Arellano, M., & Bover, O. (1995). Another look at the instrumental variable estimation of error-components models. Journal of Econometrics, 68(1), 29-51. https://doi.org/10.1016/0304-4076(94)01642-D Banaitienė, N., Banaitis, A., & Laučys, M. (2015). Foreign direct investment and growth: analysis of the construction sector in the Baltic States. Journal of Civil Engineering and Management, 21(6), 813-826. https://doi.org/10.3846/13923730.2015.1046478 Banihashemi, S., Hosseini, M. R., Golizadeh, H., & Sankaran, S. (2017). Critical success factors (CSFs) for integration of sustainability into construction project management practices in developing countries. International Journal of Project Management, 35(6), 1103-1119. https://doi.org/10.1016/j.ijproman.2017.01.014 Bekaert, G., Harvey, C. R., Lundblad, C. T., & Siegel, S. (2016). Political risk and international valuation. Journal of Corporate Finance, 37, 1-23. https://doi.org/10.1016/j.jcorpfin.2015.12.007 Bergara, M. E., Henisz, W. J., & Spiller, P. T. (1998). Political institutions and electric utility investment: A cross-nation analysis. California Management Review, 40(2), 18-35. https://doi.org/10.2307/41165931 Biglaiser, G., & Staats, J. L. (2010). Do political institutions affect foreign direct investment? A survey of US corporations in Latin America. Political Research Quarterly, 63(3), 508-522. https://doi.org/10.1177/1065912909331428 Bitsch, F. (2012). Do investors value cash flow stability of listed infrastructure funds? (CEFS working paper series). Center for Entrepreneurial and Financial Studies, Technische Universität München. Retrieved from https://www.econstor.eu/handle/10419/55145
Technological and Economic Development of Economy, 2019, 25(2): 134–167
159
Bjorvatn, K., & Farzanegan, M. R. (2015). Resource rents, balance of power, and political stability. Journal of Peace Research, 52(6), 758-773. https://doi.org/10.1177/0022343315593992 Blundell, R., & Bond, S. (1998). Initial conditions and moment restrictions in dynamic panel data models”. Journal of Econometrics, 87(1), 115-143. https://doi.org/10.1016/S0304-4076(98)00009-8 Blundell, R., & Bond, S. (2000). GMM estimation with persistent panel data: an application to production functions. Econometric Reviews, 19(3), 321-340. https://doi.org/10.1080/07474930008800475 Brouthers, L. E., Gao, Y., & McNicol, J. P. (2008). Corruption and market attractiveness influences on different types of FDI. Strategic Management Journal, 29(6), 673-680. https://doi.org/10.1002/smj.669 Buckley, P. J., Clegg, L. J., Cross, A., Liu, X., Voss, H., & Zheng, P. (2010). The determinants of Chinese outward foreign direct investment. Edward Elgar. https://doi.org/10.1057/9780230248328_6 Burcar Dunovic, I., Radujkovic, M., & Vukomanovic, M. (2016). Internal and external risk based assesment and evaluation for the large infrastructure projects. Journal of Civil Engineering and Management, 22(5), 673-682. https://doi.org/10.3846/13923730.2015.1128479 Busse, M. (2003). Democracy and FDI (HWWA Discussion Paper No. 220). https://doi.org/10.2139/ssrn.384480 Busse, M., & Hefeker, C. (2007). Political risk, institutions and foreign direct investment. European Journal of Political Economy, 23(2), 397-415. https://doi.org/10.1016/j.ejpoleco.2006.02.003 Campos, J. E., Lien, D., & Pradhan, S. (1999). The impact of corruption on investment: predictability matters. World Development, 27(6), 1059-1067. https://doi.org/10.1016/S0305-750X(99)00040-6 Castells, A., & Solé-Ollé, A. (2005). The regional allocation of infrastructure investment: The role of equity, efficiency and political factors. European Economic Review, 49(5), 1165-1205. https://doi.org/10.1016/j.euroecorev.2003.07.002 Clare, G., & Gang, I. N. (2010). Exchange rate and political risks, again. Emerging Markets Finance and Trade, 46(3), 46-58. https://doi.org/10.2753/REE1540-496X460303 Correa-Henao, G. J., Yusta, J. M, & Lacal-Arántegui, R. (2013). Using interconnected risk maps to assess the threats faced by electricity infrastructures. International Journal of Critical Infrastructure Protection, 6(3). https://doi.org/10.1016/j.ijcip.2013.10.002 Dailami, M., & Leipziger, D. (1998). Infrastructure project finance and capital flows: A new perspective. World Development, 26(7), 1283-1298. https://doi.org/10.1016/S0305-750X(98)00054-0 Delios, A., & Henisz, W. J. (2003). Political hazards, experience, and sequential entry strategies: The international expansion of Japanese firms, 1980–1998. Strategic Management Journal, 24(11), 11531164. https://doi.org/10.1002/smj.355 Derakhshanalavijeh, R., & Teixeira, J. M. C. (2017). Cost overrun in construction projects in developing countries, Gas-Oil industry of Iran as a case study. Journal of Civil Engineering and Management, 23(1), 125-136. https://doi.org/10.3846/13923730.2014.992467 Doh, J. P., & Ramamurti, R. (2003). Reassessing risk in developing country infrastructure. Long Range Planning, 36(4), 337-353. https://doi.org/10.1016/S0024-6301(03)00069-4 Egger, P., & Winner, H. (2005). Evidence on corruption as an incentive for foreign direct investment. European Journal of Political Economy, 21(4), 932-952. https://doi.org/10.1016/j.ejpoleco.2005.01.002 Elfakhani, S., & Mackie, W. (2015). An analysis of net FDI drivers in BRIC countries. Competitiveness Review, 25(1), 98-132. https://doi.org/10.1108/CR-05-2013-0053 Espinosa-Ramírez, R. S., Kayalica, O., & Kumaû, M. (2015). Foreign direct investment and lobbying for environmental policies. Environmental Economics, 6, 18-24. Fan, C. S., Lin, C., & Treisman, D. (2009). Political decentralization and corruption: Evidence from around the world. Journal of Public Economics, 93(1), 14-34. https://doi.org/10.1016/j.jpubeco.2008.09.001
160
W. Jiang et al. Foreign infrastructure investment in developing countries: a dynamic panel data ...
Fernando, C. K., Hosseini, M. R., Zavadskas, E. K., Perera, B. A. K. S., & Rameezdeen, R. (2017). Managing the financial risks affecting construction contractors: implementing hedging in Sri Lanka. International Journal of Strategic Property Management, 21(2), 212-224. https://doi.org/10.3846/1648715X.2017.1301592 Finkenzeller, K., Dechant, T., & Schäfers, W. (2010). Infrastructure: a new dimension of real estate? An asset allocation analysis. Journal of Property Investment & Finance, 28(4), 263-274. https://doi.org/10.1108/14635781011058875 Ghoddousi, P., & Hosseini, M. R. (2012). A survey of the factors affecting the productivity of construction projects in Iran. Technological and Economic Development of Economy, 18(1), 99-116. https://doi.org/10.3846/20294913.2012.661203 Ghosh, A., & Meagher, K. (2015). The politics of infrastructure investment: The role of product market competition. Journal of Economic Behavior & Organization, 119, 308-329. https://doi.org/10.1016/j.jebo.2015.08.017 Globerman, S., & Shapiro, D. (2002). Global foreign direct investment flows: The role of governance infrastructure. World Development, 30(11), 1899-1919. https://doi.org/10.1016/S0305-750X(02)00110-9 Guerin, S. S., & Manzocchi, S. (2009). Political regime and FDI from advanced to emerging countries. Review of World Economics, 145(1), 75-91. https://doi.org/10.1007/s10290-009-0004-7 Hausman, J. A. (1978). Specification tests in econometrics. Econometrica: Journal of the Econometric Society, 46(6), 1251-1271. https://doi.org/10.2307/1913827 Hayakawa, K., Kimura, F., & Lee, H. H. (2013). How does country risk matter for foreign direct investment?. The Developing Economies, 51(1), 60-78. https://doi.org/10.1111/deve.12002 Henisz, W. J. (2000). The institutional environment for economic growth. Economics & Politics, 12(1), 1-31. https://doi.org/10.1111/1468-0343.00066 Henisz, W. J. (2002). The institutional environment for infrastructure investment. Industrial and Corporate Change, 11(2), 355-389. https://doi.org/10.1093/icc/11.2.355 Henisz, W. J., & Mansfield, E. D. (2006). Votes and vetoes: The political determinants of commercial openness. International Studies Quarterly, 50(1), 189-211. https://doi.org/10.1111/j.1468-2478.2006.00398.x Henisz, W. J., & Zelner, B. A. (1999, September 8-10). Political risk and infrastructure investment. Paper presented at the Conference on Infrastructure for Development: Confronting Political and Regulatory Risks, Rome, Italy. Government of Italy, The World Bank. Retrieved from http://citeseerx.ist. psu.edu/viewdoc/download?doi=10.1.1.582.6843&rep=rep1&type=pdf Hines, J. R. (1995). Forbidden payment: Foreign bribery and American business after 1977. National Bureau of Economic Research. https://doi.org/10.3386/w5266 Hosseini, M. R., Banihashemi, S., Martek, I., Golizadeh, H., & Ghodoosi, F. (2018). Sustainable delivery of megaprojects in Iran: Integrated model of contextual factors. Journal of Management in Engineering, 34(2), 05017011. https://doi.org/10.1061/(ASCE)ME.1943-5479.0000587 Howell, L. D. (2011). International country risk guide methodology. East Syracuse, NY: PRS Group. ICRG. (2016). Political risk. Retrieved from https://epub.prsgroup.com/products/icrg/researcher-dataset-icrg-t3b-political-risk Iloie, R. E. (2015). Connections between FDI, Corruption Index and Country Risk Assessments in Central and Eastern Europe. Procedia Economics & Finance, 32, 626-633. https://doi.org/10.1016/S2212-5671(15)01442-2 Jensen, N. M. (2003). Democratic governance and multinational corporations: Political regimes and inflows of foreign direct investment. International Organization, 57(3), 587-616. https://doi.org/10.1017/S0020818303573040
Technological and Economic Development of Economy, 2019, 25(2): 134–167
161
Jensen, N. M. (2005). Democratic institutions and expropriation risk for multinational investors. Social Science Electronic Publishing. https://doi.org/10.2139/ssrn.869460 Jensen, N. M. (2006). Democratic institutions and expropriation risk for multinational investors. https://doi.org/10.2139/ssrn.869460 Jiménez, A., Luis-Rico, I., & Benito-Osorio, D. (2014a). The influence of political risk on the scope of internationalization of regulated companies: Insights from a Spanish sample. Journal of World Business, 49(3), 301-311. https://doi.org/10.1016/j.jwb.2013.06.001 Jiménez, G., Ongena, S., Peydró, J. L., & Saurina, J. (2014b). Hazardous times for monetary policy: What do twenty‐three million bank loans say about the effects of monetary policy on credit risk‐taking? Econometrica, 82(2), 463-505. https://doi.org/10.3982/ECTA10104 Keeley, A. R., & Ikeda, Y. (2017). Determinants of foreign direct investment in wind energy in developing countries. Journal of Cleaner Production, 161, 1451-1458. https://doi.org/10.1016/j.jclepro.2017.05.106 Kerner, A. (2014). What we talk about when we talk about foreign direct investment. International Studies Quarterly, 58(4), 804-815. https://doi.org/10.1111/isqu.12147 Kesternich, I., & Schnitzer, M. (2010). Who is afraid of political risk? Multinational firms and their choice of capital structure. Journal of International Economics, 82(2), 208-218. https://doi.org/10.1016/j.jinteco.2010.07.005 Khanzadi, M., Eshtehardian, E., & Mokhlespour Esfahani, M. (2017). Cash flow forecasting with risk consideration using Bayesian Belief Networks (BBNS). Journal of Civil Engineering and Management, 23(8), 1045-1059. https://doi.org/10.3846/13923730.2017.1374303 Kim, B. Y., & Kang, Y. (2009). The informal economy and the growth of small enterprises in Russia. Economics of Transition, 17(2), 351-376. https://doi.org/10.1111/j.1468-0351.2009.00348.x Kim, D. (2015). The effects of inter-state conflicts on foreign investment flows to the developing world: Enduring vs. ephemeral risk of conflicts. International Political Science Review, 37(4). https://doi.org/10.1177/0192512115582278 Kirkpatrick, C., Parker, D., & Zhang, Y. F. (2004). State versus private sector provision of water services in Africa: A statistical, DEA and stochastic cost frontier analysis (Working Paper No. 70). Centre on Regulation & Competition. Retrieved from http://ageconsearch.umn.edu/record/30604/files/ cr040070.pdf Kirkpatrick, C., Parker, D., & Zhang, Y.-F. (2006). Foreign direct investment in infrastructure in developing countries: does regulation make a difference?. Transnational Corporations, 15(1), 143-71. Kolstad, I., & Tøndel, L. (2002). Social development and foreign direct investments in developing countries. Chr. Michelsen Institute. Kucera, D. C., & Principi, M. (2014). Democracy and foreign direct investment at the industry level: evidence for US multinationals. Review of World Economics, 150(3), 595-617. https://doi.org/10.1007/s10290-013-0183-0 Kyaw, N. A., Manley, J., & Shetty, A. (2011). Factors in multinational valuations: Transparency, political risk and diversification. Journal of Multinational Financial Management, 21(1), 55-67. https://doi.org/10.1016/j.mulfin.2010.12.007 Lambsdorff, J. G. (2006). Measuring corruption – the validity and Precision of Subjective Indicators (CPI). In C. Sampford, A. Shacklock, C. Connors, & F. Galtun (Eds.), Measuring corruption (pp. 81– 100). Aldershot, UK: Ashgate. Lee, H., Biglaiser, G., & Staats, J. L. (2014). Legal system pathways to foreign direct investment in the developing world. Foreign Policy Analysis, 10(4), 393-411. https://doi.org/10.1111/fpa.12026 Li, Q. (2009). Democracy, autocracy, and expropriation of foreign direct investment. Comparative Political Studies, 42(8), 1098-1127. https://doi.org/10.1177/0010414009331723
162
W. Jiang et al. Foreign infrastructure investment in developing countries: a dynamic panel data ...
Li, Q., & Resnick, A. (2003). Reversal of fortunes: Democratic institutions and foreign direct investment inflows to developing countries. International Organization, 57(1), 175-211. https://doi.org/10.1017/S0020818303571077 Li, Q., & Vashchilko, T. (2010). Dyadic military conflict, security alliances, and bilateral FDI flows. Journal of International Business Studies, 41(5), 765-782. https://doi.org/10.1057/jibs.2009.91 Long, A. G. (2008). Bilateral trade in the shadow of armed conflict. International Studies Quarterly, 52(1), 81-101. https://doi.org/10.1111/j.1468-2478.2007.00492.x Mansfield, E. D., Milner, H. V., & Rosendorff, B. P. (2000). Free to trade: Democracies, autocracies, and international trade. American Political Science Review, 94(2), 305-321. https://doi.org/10.2307/2586014 Mathur, A., & Singh, K. (2013). Foreign direct investment, corruption and democracy. Applied Economics, 45(8), 991-1002. https://doi.org/10.1080/00036846.2011.613786 Méon, P.-G., & Sekkat, K. (2012). FDI waves, waves of neglect of political risk. World Development, 40(11), 2194-2205. https://doi.org/10.1016/j.worlddev.2012.03.022 Nem Singh, J., & Chen, G. C. (2017). State-owned enterprises and the political economy of state–state relations in the developing world. Third World Quarterly, 39(6), 1-21. https://doi.org/10.1080/01436597.2017.1333888 Nigh, D. (1985). The effect of political events on United States direct foreign investment: A pooled time-series cross-sectional analysis. Journal of International Business Studies, 16(1), 1-17. https://doi.org/10.1057/palgrave.jibs.8490439 Oatley, T. H. (2012). International political economy: Interests and institutions in the global economy. Boston, MA: Pearson Longman. Osabutey, E. L., & Okoro, C. (2015). Political risk and foreign direct investment in Africa: The case of the Nigerian telecommunications industry. Thunderbird International Business Review, 57(6), 417429. https://doi.org/10.1002/tie.21672 Percoco, M. (2014). Quality of institutions and private participation in transport infrastructure investment: Evidence from developing countries. Transportation Research Part A: Policy and Practice, 70, 50-58. https://doi.org/10.1016/j.tra.2014.10.004 PPIF. (2016). PPIF database. Retrieved from http://ppi.worldbank.org/ Ramamurti, R., & Doh, J. P. (2004). Rethinking foreign infrastructure investment in developing countries. Journal of World Business, 39(2), 151-167. https://doi.org/10.1016/j.jwb.2003.08.010 Roodman, D. (2006). How to do xtabond2: An introduction to difference and system GMM in Stata. (Working Paper No. 103). Center for Global Development. Sadig, A. A. (2009). The effects of corruption on FDI inflows. Cato Journal, 29(2), 267-294. Sanchez-Robles, B. (1998). Infrastructure investment and growth: Some empirical evidence. Contemporary Economic Policy, 16(1), 98-108. https://doi.org/10.1111/j.1465-7287.1998.tb00504.x Shen, W., Tang, W., Yu, W., Duffield, C. F., Hui, F. K. P., Wei, Y., & Fang, J. (2017). Causes of contractors’ claims in international engineering-procurement-construction projects. Journal of Civil Engineering and Management, 23(6), 727-739. https://doi.org/10.3846/13923730.2017.1281839 Slangen, A. H., & Van Tulder, R. J. (2009). Cultural distance, political risk, or governance quality? Towards a more accurate conceptualization and measurement of external uncertainty in foreign entry mode research. International Business Review, 18(3), 276-291. https://doi.org/10.1016/j.ibusrev.2009.02.014 Sobel, A. C. (2006). Political economy and global affairs. Washington, DC: CQ Press. Spiller, P. T. (1993). Institutions and regulatory commitment in utilities’ privatization. Industrial and Corporate Change, 2(3), 387-450. https://doi.org/10.1093/icc/2.3.387
Technological and Economic Development of Economy, 2019, 25(2): 134–167
163
Spiller, P. T., & Savedoff, W. D. (1999). Commitment and governance in infrastructure (pp. 133-150). Can Privatization Deliver. Tosun, M. U., Yurdakul, M. O., & Iyidoğan, P. V. (2014). The relationship between corruption and foreign direct investment inflows in Turkey: An empirical examination. Transylvanian Review of Administrative Sciences, 10(42), 247-257. Retrieved from http://rtsa.ro/tras/index.php/tras/article/ view/100/96 Tsai, M. C., & Su, C. H. (2005). Political risk assessment of five East Asian ports – the viewpoints of global carriers. Marine Policy, 29(4), 291-298. https://doi.org/10.1016/j.marpol.2004.04.003 Tvaronavičiene, M., & Kalašinskaite, K. (2010). Whether globalization in form of FDI enhances national wealth: Empirical evidence from Lithuania. Journal of Business Economics and Management, 11(1), 5-19. https://doi.org/10.3846/jbem.2010.01 Vadlamannati, K. C. (2012). Impact of political risk on FDI revisited – An aggregate firm-level analysis. International Interactions, 38(1), 111-139. https://doi.org/10.1080/03050629.2012.640254 Wei, S.-J. (2000). How taxing is corruption on international investors?. The Review of Economics and Statistics, 82(1), 1-11. https://doi.org/10.1162/003465300558533 Williamson, O. (1976). Franchise bidding for natural monopolies – in general and with respect to CATV. The Bell Journal of Economics, 7(1), 73-104. Retrieved from https://www.jstor.org/stable/3003191 Williams, A., & Siddique, A. (2008). The use (and abuse) of governance indicators in economics: a review. Economics of Governance, 9(2), 131-175. https://doi.org/10.1007/s10101-006-0025-9 Windmeijer, F. (2005). A finite sample correction for the variance of linear efficient two-step GMM estimators. Journal of Econometrics, 126(1), 25-51. https://doi.org/10.1016/j.jeconom.2004.02.005 World Bank. (2001). Private participation in infrastructure (PPI) project database. Washington, DC. World Bank. (2016). World Bank Database. Retrieved from http://databank.worldbank.org/data/databases.aspx World Economic Forum. (2014). Infrastructure investment policy blueprint. Retrieved from https://www. weforum.org/reports/infrastructure-investment-policy-blueprint World Economic Forum (2016). Global Competitiness Index. Retrieved from http://reports.weforum. org/global-competitiveness-index-2017-2018/downloads/ World Economic Forum. (2017a). Recycling our infrastructure for future generations. Retrieved from https://www.weforum.org/reports/recycling-our-infrastructure-for-future-generations World Economic Forum. (2017b). World Economic Forum annual report 2016–2017. The World Economic Forum. Retrieved from https://www.weforum.org/reports/annual-report-2016-2017 Zavadskas, E. K., Turskis, Z., & Tamošaitiene, J. (2010). Risk assessment of construction projects. Journal of Civil Engineering and Management, 16(1), 33-46. https://doi.org/10.3846/jcem.2010.03 Zavadskas, E. K., Ustinovichius, L., & Stasiulionis, A. (2004). Multicriteria valuation of commercial construction projects for investment purposes. Journal of Civil Engineering and Management, 10(2), 151-166. https://doi.org/10.1080/13923730.2004.9636299 Zavadskas, E. K., Vilutienė, T., Turskis, Z, & Šaparauskas, J. (2014). Multi-criteria analysis of Projects’ performance in construction. Archives of Civil and Mechanical Engineering, 14(1), 114-121. https://doi.org/10.1016/j.acme.2013.07.006 Zeng, X. J., & Singh, M. G. (1996). Approximation accuracy analysis of fuzzy systems as function approximators. IEEE Transactions on Fuzzy Systems, 4(1), 44-63. https://doi.org/10.1109/91.481844
164
W. Jiang et al. Foreign infrastructure investment in developing countries: a dynamic panel data ...
APPENDIX Table A1. 90 countries Albania
Ecuador
Lithuania
Senegal
Algeria
Egypt
Madagascar
Serbia
Angola
El Salvador
Malawi
Sierra Leone
Argentina
Ethiopia
Malaysia
Somalia
Armenia
Gabon
Mali
Sri Lanka
Azerbaijan
Gambia
Mexico
Sudan
Bangladesh
Ghana
Moldova
Suriname
Belarus
Guatemala
Mongolia
Syria
Bolivia
Guinea
Morocco
Tanzania
Botswana
Guinea-Bissau
Mozambique
Thailand
Brazil
Guyana
Myanmar
Togo
Bulgaria
Haiti
Namibia
Tunisia
Burkina Faso
Honduras
Nicaragua
Turkey
Cameroon
India
Niger
Uganda
Chile
Indonesia
Nigeria
Ukraine
China
Iran
Pakistan
Uruguay
Colombia
Iraq
Panama
Venezuela
Congo
Jamaica
Papua New Guinea
Vietnam
Congo, DR
Jordan
Paraguay
Yemen
Costa Rica
Kazakhstan
Peru
Zambia
Cote d’Ivoire
Kenya
Philippines
Zimbabwe
Cuba
Korea, DPR
Romania
Dominican Republic
Liberia
Russia
165
Technological and Economic Development of Economy, 2019, 25(2): 134–167
Table A2. The data description and source Data
Data description
Data provider
Data source
FDI
It refers to the net foreign equity inflows of investment into the 90 developing World Bank economies. It is the sum of equity database (2016) capital, reinvestment of earnings, and other capital.
http://databank. worldbank.org/ data/databases.aspx
FDII
FDII refers to FDI flows into infrastructure without consideration PPIF database of second or third order upstream or (PPIF, 2016) downstream multiplier effects created by foreign investors.
http://ppi. worldbank.org/
Political risk indicators
There are 12 political indicators, including Government stability, Socioeconomic conditions, Investment Profile, Internal Conflict, External Conflict, Corruption, Military in Politics, Religion in Politics, Law and Order, Ethnic Tensions, Democratic Accountability, Bureaucracy Quality.
http://www. prsgroup.com/
GDP
GDP is the sum of gross value added by all resident producers in the economy plus any product taxes and minus any subsidies not included in the value of the World Bank products. It is calculated without making database (2016) deductions for depreciation of fabricated assets or for depletion and degradation of natural resources.
http://databank. worldbank.org/ data/databases.aspx
GDP growth (annual %)
Annual percentage growth rate of GDP at market prices based on constant local currency. Aggregates are based on constant 2016 U.S. dollars.
World Bank database (2016)
http://databank. worldbank.org/ data/databases.aspx
Population
Total population is based on the de facto World Bank definition of population, which counts all residents regardless of legal status or database (2016) citizenship.
http://databank. worldbank.org/ data/databases.aspx
Political Risk Services (PRS)
It is a proxy for the investment environment of foreign investment https://www. Macroeconomic inflows, and assesses government budget World Economic weforum.org/ balance, gross national savings, inflation, Forum (2016) environment reports general government debt, and country credit rating.
Infrastructure situation
It assesses the quality of overall infrastructure across the 90 developing countries, including the quality of roads, https://www. World Economic railroads, ports, and air transport. It weforum.org/ calculates available airline seats km/week Forum (2016) reports ($U.S. million), fixed telephone lines/100 population, and mobile telephone subscriptions/100 population.
166
W. Jiang et al. Foreign infrastructure investment in developing countries: a dynamic panel data ...
Table A3. Summary statistics on the variables Variable FDI (billion USD)
Obs
Mean
Std. Dev.
Min
Max
885
6.86
25.55
–7.12
290.93
FDII (billion USD)
766
1.24
7.21
0.00
190.45
Government stability
900
7.83
1.48
4.58
11.42
Socioeconomic conditions
900
4.27
1.91
0.00
10.00
Investment Profile
900
7.36
1.86
1.00
11.50
Internal Conflict
900
8.61
1.53
3.00
11.50
External Conflict
900
9.51
1.37
3.75
12.00
Corruption
900
2.04
0.68
0.00
4.50
Military in Politics
900
3.03
1.57
0.00
6.00
Religion in Politics
900
4.37
1.37
1.00
6.00
Law and Order
900
3.01
0.99
0.50
5.00
Ethnic Tensions
900
3.74
1.26
1.00
6.00
Democratic Accountability
900
3.59
1.49
0.00
6.00
Bureaucracy Quality
900
1.60
0.79
0.00
3.00
Population
866
63.42
194.71
0.50
1371.22
GDP
892
2700.33
3585.85
0.00
11007.72
GDP growth
900
4.50
4.29
–28.10
34.50
Infrastructure
711
3.32
0.84
1.54
5.94
Macroeconomic environment
895
3.62
1.99
0.00
6.58
0.2570* 0.3797* 0.3205*
0.2045* 0.3112* 0.4463* 0.5331*
Internal Conflict
External Conflict
Corruption
Military in Politics
Religion in Politics
Law and Order
(4)
(5)
(6)
(7)
(8)
(9)
1.00
(5)
0.5329* 0.4794* 0.5250* 0.4591* 0.3461*
1.00
(6)
1.00
(7)
1.00
(8)
Bureaucracy Quality
(17) Infrastructure
Macroeconomic environment
0.06
0.00
0.04
(16)
0.2379*
(15) Population
0.06 0.06
0.1145*
–0.0727* –0.0717*
–0.01 –0.1777* –0.06
0.1067*
0.00 0.06
0.06
0.05 0.00
–0.01
0.04
1.00
(12)
0.1085*
–0.05
–0.03
0.06
1.00
(13)
0.5715* 0.2819* 0.2072*
–0.05
0.1895* 0.3058* 0.1372* 0.3118* 0.2208*
0.00
1.00
(14)
0.1692*
1.00
(15)
1.00
(16)
(17)
0.2853* 0.2624* –0.1235* 0.1441* 0.4239* 1.00
0.03
0.1914* 0.7815* 0.1408*
0.00
0.0784* –0.0771* –0.0709* 0.1391*
0.1143* 0.1243* 0.3778*
–0.1700* 0.1412* –0.1605* –0.01
–0.04
–0.01
0.07
1.00
(11)
0.4527* 0.3466* 0.2462* 0.2072* 0.3186* 0.4277* 0.1907* 0.2809* 0.2806* 0.2474* 0.3309* 0.2088*
0.1815*
0.01
0.2761*
–0.1250* 0.5456* 0.3542* 0.1839* 0.3710* 0.3740* 0.4789*
(14) GDP growth
(13) GDP
(12)
–0.06
–0.01
–0.1723* 0.2100* 0.4299* 0.2195* 0.3607* 0.3272* 0.4887* 0.1543*
1.00
(10)
Democratic (11) Accountability
1.00
(9)
(10) Ethnic Tensions 0.1452* 0.2728* 0.1645* 0.5306* 0.2543* 0.1799* 0.3360* 0.4526* 0.2040*
0.2230* 0.3720* 0.1951* 0.3312* 0.0929* 0.2967* 0.3656* 0.1177*
0.0973* 0.1701* 0.1143* 0.5528* 0.2225* 0.1174* 0.3483*
0.02
0.1503* 0.4110* 0.4164* 0.2940* 0.3468*
1.00
0.2155* 0.4672*
Investment Profile
(3)
1.00
0.1572*
Socioeconomic conditions
(2)
1.00
1.00
(4)
Government stability
(3)
(1)
(2)
(1)
Variables
Table A4. Correlation matrix
Technological and Economic Development of Economy, 2019, 25(2): 134–167
167