curse hypothesis and attempted to explain it. ... S$ p er ca p ita. Resource poor.
Land rich. Oil rich. Note: Oil-rich countries are .... Atkinson, G., and K. Hamilton.
From Curse to Blessing Natural Resources and Institutional Quality
C
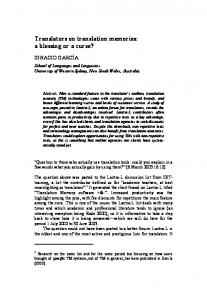
an a country have plenty of natural resources and yet fail to grow and develop? The resource curse paradox is more than a “worstcase scenario.” There is robust empirical evidence for a negative relationship between natural resource wealth and economic growth (see Figure, below).
While Gelb (1988) coined the expression, many economists have analyzed the resource curse hypothesis and attempted to explain it. Explanations for the phenomenon include: The Resource Curse—Natural Resource Endowment and Real GDP Growth 6500
6000
2000 US$ per capita
5500
Resource poor Land rich Oil rich
5000
4500
4000
2001
1999
1997
1995
1991
1993
1989
1987
1985
1981
1983
1979
1977
1975
1973
3000
2003
3500
Note: Oil-rich countries are those that in 1973 ranked among the top 15 percent in terms of energy and mineral rents as a percent of GDP. Land-rich countries are those that in 1973 ranked among the top 25 percent in terms of agricultural land per person. Countries from Eastern Europe are excluded. Source: WDI 2006.
Long-run declines in primary product prices, which deprive countries of important financial resources over time “Dutch disease,” where a booming natural resource sector leads to exchange rate inflation, decreasing the competitiveness of the industrial sector Composition of the natural resource export base, where capital-intensive production processes—such as sugar, cotton, or mining—are characterized by weaker growth linkages compared to labor-intensive production processes, such as food grains or tree crops Government complacency linked to the “easy rents” generated by natural resource booms, which reduce incentives for economic reform and diversification. Easy rents often lead to high public consumption rather than investments
No comprehensive theory exists: some explanations fit the performance of a subset of countries, but are unable to explain a number of exceptions. For example, initial dependence on staple-crop cultivation has been blamed for the poor performance of the Caribbean states. Yet, in the western United States, staple crops are thought to
have provided positive linkages to growth. In every case, there seems to be a key factor that escapes measurement: the interaction between government behavior and natural resource wealth. Natural resources are gifts that require proper management to provide sustained growth. The ability to do so is what we call good environmental governance.
Where Is the Wealth of Nations? Good governance is crucial to transform natural resource wealth into good economic performance. This is especially true in developing countries, where natural resources play a major role in the composition of wealth. In low-income countries, according to estimates prepared by the World Bank (2006), the natural capital share (26 percent) of total wealth is much greater than the share of produced capital (16 percent) (see Figure, above right). The composition of natural wealth in poor countries emphasizes the major role of agricultural land (70 percent), followed by subsoil assets (17 percent) and timber and
Environment Matters 2006 — The World Bank Group 24
Environment Matters • 2006
Feature Articles
Kirk Hamilton
tal—an amalgam including human capital and the quality of formal and informal institutions. The share of intangible capital in total wealth rises with income. Oil-exporting countries are the exception, with a very low share of intangible capital (10 percent) – this is another manifestation of the resource curse, indicative of very low rates of return to all assets in these economies.
Composition of Wealth by Income Group 100
10
90
What does this all mean? Achieving sustained growth entails managing a complex portfolio of assets, in which the elements are not just buildings and machines, but natural and human resources as well. Natural resources are special economic goods because they are not produced. If properly managed, they will yield rents that can be an important source of development finance. Resource policy, fiscal policy, political factors, institutions, and governance structure all have a role to play in transforming them into sustained growth.
80 Per cent
70
59
68
60
55
80
50 40 30
26
10 0
2
13
20
35 16
19
17
Low income
Middle income
High income OECD
Produced capital
Natural capital
High oil exporting Intangible capital
Note: High oil exporters are treated separately. Source: World Bank 2006.
Composition of Natural Wealth in LowIncome Countries Sub-soil assets 17% Non-timber resources 2% Timber resources 6%
Crop land 59%
Protected areas 6% Pasture land 10%
Note: Oil countries excluded. Source: World Bank 2006.
non-timber forest resources (8 percent) (see Figure, above). Another important fact: the preponderant form of wealth worldwide is intangible capi-
annual review • jULY 2005–jUNE 2006 (fy06)
Natural Resources and Governance Auty and Gelb (2001) argue that natural resource wealth partially determines the development paths of countries, while increasing the likelihood of political failure. Resourcepoor countries engage earlier in labor-intensive competitive manufacturing. The result is faster diversification, higher saving rates, and faster accumulation of produced, human, and social capital. “This sequence requires a political state that has sufficient autonomy to sustain a coherent economic policy and the objective of raising economic welfare,” according to Auty and Gelb. Resource-rich countries may also pursue this virtuous circle of competitive industrialization, but their reliance on the primary sector tends to dampen industrialization. Moreover, natural resource rents favor the creation of factional states in which those managing the
rents tend to create mechanisms to control economic and political power. Rents are deployed through indirect means such as trade protection, unproductive job creation, and overextended public expenditure. This results in lower investment efficiency and finally slower economic growth. So much for the theory, but do the numbers confirm the hypothesis that natural resource riches are associated with poor government performance? Each year, the World Bank prepares the Country Policy and Institutional Assessment (CPIA), which evaluates the quality of a country’s present policy and institutional framework. In addition, Kaufmann, Kraay, and Mastruzzi (2005) aggregate data on six dimensions of governance: (1) voice and accountability; (2) political instability and violence; (3) government effectiveness; (4) regulatory quality; (5) rule of law, and (6) control of corruption. The Table at the top of page 26 provides average values of eight governance measures for three groups of countries: resource-poor, land-rich, and oil-rich International Development Association (IDA–eligible countries. In all cases, resource-poor countries perform better than their resource-rich peers. Oil-rich countries tend to have very low performance in political stability and rule of law. Land-rich countries tend to underperform on the CPIA score and government effectiveness.
Breaking the Curse The negative relationship between natural resource dependence and governance need not be deterministic. Is there a recipe that a government can pursue to escape the curse? While guessing the intentions of government officials is not easy, judging their policies is much more straightforward. After all, governments’ key task is to administer a country’s wealth. Using our expanded measure of wealth (expanded to include natural resources
25
Natural Resource Abundance and Governance Indicators (IDA Countries) Resource poor in 2003
Land rich in 2003
Oil rich in 2003
IDA Resource Allocation Index (CPIA) (Scale: 1–6)
2005
3.5
3.1
3.2
Environment CPIA (Scale: 1–6)
2005
3.2
3.0
3.0
Voice and Accountability (Scale: 0–100)
2004
41
33
24
Political Stability (Scale: 0–100)
2004
38
33
18
Government Effectiveness (Scale: 0–100)
2004
32
24
26
Regulatory Quality (Scale: 0–100)
2004
35
30
24
Rule of Law (Scale: 0–100)
2004
34
28
19
Control of Corruption (Scale: 0–100)
2004
35
28
20
Note: This table refers to IDA countries only. Oil-rich countries are those that in 2003 ranked among the IDA top 25 percent in terms of energy and mineral rents as a percent of GDP. Land-rich countries are those that in 2003 ranked among the IDA top 25 percent in terms of agricultural land per person. Source: WDI 2006; Kaufmann, Kraay, and Mastruzzi 2005.
and intangible capital), it is possible to link performance to the actual changes in value of the portfolio. Substitution between types of assets (for example, oil on the ground versus factories and PhDs) is possible most of the time. Atkinson and Hamilton (2003) find that countries that escaped the resource curse used resource rents as a source of investment rather than a source of public expenditure. Such countries have been transforming natural capital into produced capital. The sustainability rule of thumb is a simple one: invest the rents from the exploitation of natural resources. The policy rule is particularly useful when it comes to managing nonrenewable resource
rents. Exhaustible resources, once discovered, can only be depleted. The key policy issues are investing resource rents effectively and maintaining fiscal stability. A successful recipe includes avoidance of external debt, diversification of the economy, and the use of public expenditures to counter the boomand-bust effect of the natural resource market. For example, by keeping a sharp focus on the fiscal aspects of natural resources, Botswana has achieved remarkable economic performance (Sarraf and Jiwanji 2001) (see Box, below). Unlike sub-soil assets, living resources are a potentially sustainable source of resource rents—truly a gift of nature. The key policy issue is to achieve a sustainable level of har-
Botswana — There Are No Sustainable Mines, but There Can Be Sustainable Mining Countries Since its first diamond mine was discovered in 1967, Botswana experienced strong and sustained growth that led it from being one of the poorest economies in Africa to one of the rare success cases in the continent, avoiding the problems experienced by other resource-rich countries. The recipe for this success has been a set of policy rules grounded in avoiding fiscal deficits. The government uses a Sustainable Budget Index (SBI) in order to ensure sustainability. This measures the ratio between consumption expenditures and non-resource revenues. As long as the SBI is less than one, the government can be sure that natural-resource capital is not being consumed. This achievement has not been easy. Public investment has often gone into low-growth sectors such as defense and agriculture, while it has crowded out private investment, slowing economic diversification. However, the overall fiscal strategy has worked. The government has avoided excessive spending in the good times and drastic spending cuts when diamond prices have fallen, as in the early 1980s and 1991. Source: World Bank 2005.
26
vest. Forests and fisheries are two cases in point. Efforts to address overfishing in Mauritania constitute an example of successful management—to the ultimate benefit of the country’s economy (see Box, right). Sustainable management of renewable natural resources requires clear and enforced property rights (individual or communal) to provide incentives for investment and longterm management of the resources. A crucial aspect in natural resources governance is the involvement of the relevant actors. Local communities are simultaneously the problem and the solution to local-level environmental threats. Community-based natural resource management can trigger a virtuous cycle of conservation and poverty reduction. Shyamsundar, Araral, and Weeraratne (2005) show that increased local control of natural resources motivates long-term investments and favors management accountability and performance. Putting local communities in charge also allows a reduction in the fiscal burden of central governments, maximizes revenues, and avoids inefficient expenditures. For example, the CAMPFIRE project in Zimbabwe allows state authorities to share the benefits of ecotourism with the local communities. The state retains nearly 50 percent of revenues. The remaining 50 percent is redistributed to wards and in turn to households. Whatever the level of government, good management is a precondition for good performance. Natural resources are “governance-intensive” assets. In low-income countries, natural resources make up a very significant share of the total wealth, one that is substantially larger than the share of produced capital. Sound management of these natural resources can support and sustain the welfare of poor countries, and poor people in poor countries, as they move up the development ladder.
Environment Matters • 2006
Kirk Hamilton
Feature Articles
Mauritania — Fishing for Growth Mauritanian fishing grew remarkably in the early 1980s and was expected to be a major source of growth in the next two decades, generating jobs, foreign exchange earnings, and budget revenues. By mid-decade however, heavy overfishing and other problems led to a collapse in fish revenues, with sharply lower catches, threatening to undermine the country’s growth prospects. As part of an International Monetary Fund–supported adjustment strategy, a series of reforms were introduced in the 1990s to improve management and surveillance of fishing activities. The Mauritanian government brought in ambitious tax reforms to improve competitiveness, eliminate trade distortions (including a new fishing agreement with the European Union), and make taxation more transparent. These measures proved successful. By 2002, the fishing catch had increased again, contributing to an improvement in the overall economic performance of the Mauritanian economy. 100,000 90,000
Total fish catch (mt)
80,000 70,000 60,000 50,000 40,000 30,000 20,000 10,000 0
1980
1982
1984
1986
1988
1990
1992
1994
1996
1998
Source: World Bank 2005.
References Atkinson, G., and K. Hamilton. 2003. “Savings, Growth and the Resource Curse Hypothesis.” World Development 31(11): 1793–1807.
Sachs, Jeffrey D., and Andrew M. Warner. 1995. “Natural resource abundance and economic growth.” National Bureau of Economic Research Working Paper 5398.
Auty, Richard M. 1993. Sustaining Development in Mineral Economies: The Resource Curse Thesis. London: Routledge.
Sarraf M., and M. Jiwanji. 2001. “Beating the Resource Curse: The Case of Botswana.” Environment Department Paper, No. 83. Washington, DC: The World Bank.
Auty, Richard M., and Alan H. Gelb. 2001. “Political Economy of Resource-Abundant States.” In Auty, R. M., ed. Resource Abundance and Economic Development. New York: Oxford University Press.
Shyamsundar P., E. Araral, and S. Weeraratne. 2005. “Devolution of Resource Rights, Poverty, and Natural Resource Management: A Review.” Environment Department Paper, No. 104. Washington, DC: The World Bank.
Gelb, A. 1988. Oil Windfalls: Blessing or Curse? New York: Oxford University.
World Bank. 2005. Ensuring Environmental Sustainability: Measuring Progress Toward the 7th Millennium Development Goal. Washington, DC: The World Bank.
Kaufmann D., A. Kraay, and M. Mastruzzi. 2005. Governance Matters IV: Governance Indicators for 1996–2004. (Draft, May 9, 2005.) Washington, DC: The World Bank.
annual review • jULY 2005–jUNE 2006 (fy06)
World Bank. 2006. Where is the Wealth of Nations: Measuring Capital for the 21st Century. Washington, DC: The World Bank.
This article was prepared by Kirk Hamilton, (202) 473-2053, khamilton@worldbank. org, and Giovanni Ruta, (202) 473-9388,
[email protected], both of the Environment Department.
27