coronary heart disease and stroke and also the worst all .... 2830 people at any one time ..... 1949 when he was given a "severe blow" by a (nameless).
GENERAL PRACTICE
Health promotion priorities for general practice: constructing and using "indicative prevalences" Bruce G Charlton, Nigel Calvert, Martin White, Gillian P Rye, Wlasislaw Conrad, Timothy van Zwanenberg Abstract Objective-To construct indicative prevalences for a range of diseases and risk markers and use them in planning health promotion interventions in primary health care. Design-Indicative prevalences comprised point prevalence, incidence, and mortality measures. Use of data from Office of Population Censuses and Surveys, Northern Regional Health Authority, and Newcastle health and lifestyle survey 1991, and research papers to determine prevalence adjusted for age and sex in a hypothetical practice with a list of 10 000 patients. Setting-Newcastle upon Tyne, England. Results-Indicative prevalences were highest for common risk markers such as failure to achieve exercise targets (6871), moderate to extreme obesity (2785), and smoking (2689); moderate for overt disease such as angina (175) and stroke (20/year); and low for events such as suicide (1/year) and deaths from malignant melanoma (2/10 years). Conclusions-Given limited time and resources, brief interventions to reduce smoking and the systematic case finding and management of patients with hypertension, angina, and previous myocardial infarction are likely to be the highest priorities for health promotion in primary care. Department of Epidemiology and Public Health, University of Newcastle upon Tyne, Newcastle upon Tyne NE2 4HH Bruce G Charlton, lecturer in public health medicine Martin White, senior lecturer in public health medicine
Northern Regional Health Authority, Newcastle upon Tyne NE6 4PY Nigel Calvert, senior registrar in public health medicine Timothy van Zwanenberg, regional director ofpimary health care Conrad and Rye, Jesmond, Newcastle upon Tyne NE2 1PQ Gillian P Rye, general practitioner Wlasislaw Conrad, general practitioner
Correspondence to: Dr van Zwanenberg. BMJ 1994;308:1019-22
BMJ
VOLUME
308
authority and family health services authority are coterminous with the city boundary). Indicative prevalences are measures of point prevalence, incidence, and mortality rates generated for disease and risk markers. Conditions were drawn from the national priorities defined by the 1993 modifications to the general practitioner contract and key areas in the Health of the Nation.'4 Newcastle upon Tyne is of particular interest because the district is the major urban centre of population in the Northern health region. The region has the highest prevalence of coronary heart disease and stroke and also the worst all cause standardised mortality ratio in England.'5 Furthermore, the recently published Newcastle health and lifestyle survey has generated a unique database for this community.'617 Methods We derived data for indicative prevalences from three main sources: the Newcastle health and lifestyle survey 19911617; mortality data from the Office of Population Censuses and Surveys death tapes for 1988-92; and admissions for asthma, accidental injury, and coronary artery bypass surgery from Northern Regional Health Authority 1990-2. These data were supplemented with data from other published sources if local figures were not available (box). We used 1991
Introduction In recent years health promotion has become an increasingly important part of primary health care.'2 This trend is part of a movement towards the integration of public health responsibilities into general practice.-7 Primary health care teams have had to assume broad new strategic responsibilities for maintaining and promoting the health of patients on the practice list as well as continuing to provide 24 hour clinical services. With limited time and resources it is essential to set priorities. The 1990 general practitioner contract incorporated several public health elements: population monitoring through child health surveillance, three yearly health checks for adults and screening for people over 75; assessment of health needs through recording referrals to consultants; and health promotion clinics.' The changes were criticised,"'2 and payments for health promotion clinics turned out to be much higher than expected. Furthermore, the quality and uptake of clinics was was uneven and not related to the needs of
the population.'3 The public health role has been further expanded by the new arrangements for health promotion and chronic disease management in primary health care introduced in July 1993.2 To show how practice data might be used to set priorities we generated "indicative prevalences" for a hypothetical average general practice with a list size of 10000 in Newcastle upon Tyne (the district health 16 APIL 1994
Data sources for calculating indicative prevalences * Newcastle health and lifestyle survey 199116'7-sex specific prevalences in 10 year age bands for people aged 16-74 * Office of Population Censuses and Surveys-death tapes for Newcastle upon Tyne District Health Authority 1988-92 used to calculate average annual age and sex specific mortality * Northern Regional Health Authority-Mean annual number of admissions calculated and used to derive age and sex specific admission rates with population of Newcastle in 1991 census"' as denominator * Annual report of Newcastle genitourinary medicine clinic"-Number of new cases of gonorrhoea in 1992 used to calculate crude incidence with 1991 census population as denominator * Cannon et aL20-Crude prevalence of angina applied directly to hypothetical practice * Health and lifestyle survey21-sex specific prevalences of hypertension for 10 year age bands in adults over 18 applied to hypothetical population * NHS Management Executive22-crude incidence of ischaemic attacks and prevalence ofstroke * Dennis et aP"-crude rates of transient ischaemic attack * Bamford et aP4-crude incidence of stroke
1019
census data"8 to calculate incidence of prevalence when these were not already determined. We created a hypothetical average general practice population to reflect the demographic structure of the population of Newcastle upon Tyne. The proportion of men and women in each 10 year age group of the Newcastle population, derived from the 1991 census, was multiplied by 10 000 to give the number in each age and sex band of the hypothetical practice population. Direct standardisation was used in most cases to adjust data from the original sources to provide indicative prevalences for the hypothetical practice.25 We applied age specific rates for men and women to 10 year age and sex groups of the hypothetical practice to give the expected numbers of people with the condition or risk factor in the practice population. The numbers in each age and sex group have been summed and overall practice figures are presented for each indicator. Indicative prevalences are approximate and we have therefore rounded them to the nearest whole number and presented them without confidence intervals to avoid any spurious sense of accuracy. Where age specific rates were not available we estimated the number of expected cases without standardisation. For data from the Newcastle health and lifestyle survey indicative prevalences were calculated only for the ages 16 to 74 years.
TABLE I-Indicative prevalesces for cancer, mental health, sexual health, and accidents for a hypothetical general practice in Newcastle upon Tyne with a list of 10 000 patients
TABLE I-Indicative prevalences for problems identified as priority areas for health promotion and management of chronic disease in general practice for a hypothetical general practice in Newcastle upon Tyne with a list of 10000 patients. Diseases are defined according to
team.
Scale ofproblem
Cancers: Breast
5 registrations/year, 3 deaths/year
Cervix Lung
Malignant melanoma
1 registration/year, 4 deaths/1O years 10 registrations/year, I 1 deaths/year 4 registrations/10 years, 2 deaths/1O years
Mental illness:
Suicides Sexual health: Gonorrhoea Live births and stillbirths to teenagers: 11-15 16 years 17-19 Accidents
1 suicide/year 3 new cases/year 4 births/10 years 1 birth/year 11 births/year 186 admissions/year, 3 deaths/year
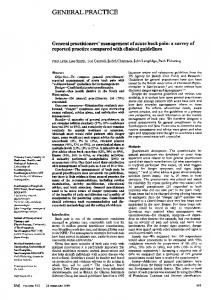
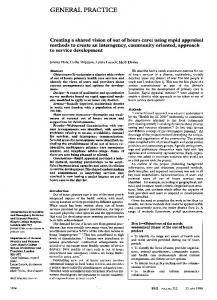
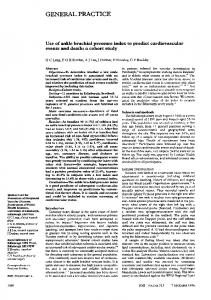
Indicative prevalences varied widely. The highest prevalences were for risk markers such as failure to achieve the exercise target (6871), moderate to extreme obesity (2785), and smoking (2689). Common diseases had intermediate prevalences (angina 175; diabetes 165). Some of the diseases identified as key areas in Health of the Nation had low indicative prevalences, especially for mortality (cervical cancer four deaths/ 10 years; malignant melanoma two deaths/10 years; Results one suicide/year). Table I lists the indicative prevalences for conditions The figure represents the "iceberg" of coronary covered by the new arrangements for health promotion heart disease and stroke in primary care. The iceberg and chronic disease management in general practice. metaphor emphasises the relation between the Table II lists prevalences for the other key areas in relatively small burden of overt disease (above the cancer, sexual health, accidents, and mental illness. water line) and the great mass of hidden risk markers We have used incidence of gonorrhoea as a proxy that can lead to disease (below the water line). The measure for new cases of AIDS and suicide rate as an figure shows how a group of related procedures, index of psychiatric illness as suggested in the Health of diseases, and risk markers can be summarised to give an impression of the scale of each problem and the the Nation.'4 possibilities for intervention by a primary health care
International Classification of Diseases, ninth edition26 Condition
Scale of problem
Smoking:* Never smoked Former smoker Smoker Cardiovascular disease:
Angina Family history of premature myocardial infarction* Myocardial infarction deaths Myocardial infarction survivors* Coronary artery bypass grafts Hypertension Transient ischaemic attack incidence
2830 people at any one time 1969 people at any one time 2689 people at any one time 175 people at any one time 1715 people at any one time 18 deaths/year 347 people at any one time 3 operations/year 1145 people at any one time 4 new cases/year 20 people/year 18 deaths/year
Stroke incidence Stroke deaths Exercise target:*t Achieved 617 people at any one time Not achieved 6871 people at any one time Body mass index (weight (kg)/(height (m)d)):"* Normal 4703 people at any one time Moderate obesity 2183 people at any one time Extreme obesity 602 people at any one time Alcohol consumpiton:*e Safe 5920 people at any one time Hazardous 1285 people at any one time Dangerous 283 people at any one time Diabetes mellitus: Prevalence" 165 people at any one time 1 death/year Deaths Asthma: Admissions 41 peopletyear Deaths 3 deaths/lO years
*Only people aged 16-74 years. t 12 occasions of vigorous activity in past four weeks for 16-34 year olds; > 12 occasions of vigorous activity in past four weeks for 35-54 year olds; > 12 occasions of moderate activity in past four weeks for 55-74 year olds."7 $Nonnal < 25, moderate obesity 25-39, extreme obesity > 39. SSafe