Journal of Medical and Biological Engineering, 26(4): 149-153
149
Heterodyne Interferometric Surface Plasmon Resonance Biosensor Shen-Fen Joe
Li-Zen Hsieh*
Liann-Be Chang1
Chih-Chung Hsieh2
Chien-Ming Wu2 Department of Electrical Engineering, Chung-Cheng Institute of Technology, National Defense University, Tao-Yuan, Taiwan, 335 ROC 1 Department of Electronic Engineering, Chang Gung University, Tao-Yuan, Taiwan, 333, ROC 2 Department of Biomedical Engineering & Environmental Sciences, National Tsing-Hua University, Hsin-Chu, Taiwan, 300 ROC Received 30 Jun 2006; Accepted 3 Nov 2006
Abstract A high-sensitivity surface plasmon resonance (SPR) biosensor is constructed by using a common-path heterodyne interferometric system. The beam combiner is employed to combine the modulated He-Ne TE-wave and TM-wave into a heterodyne light source with a frequency difference of 60 kHz. Using the common-path heterodyne interferometric system to obtain the phase shift between the two waves has the advantage of high-sensitivity real-time phase detection for monitoring molecular interactions. By detecting the phase shift, the proposed SPR biosensor is employed to monitor the interactions between the sheep IgG covalently immobilized on the sensor chip surface and the anti-sheep IgG contained in the running buffer. Keywords: Surface Plasmon Resonance, Biosensor, Heterodyne interferometry
Introduction Surface plasmon resonance (SPR) has the advantages of being highly sensitive, requires no fluorescent-labeled analytes or receptors, and is capable of monitoring biomolecular interactions in real time. This technique has been employed in commercially available optical biosensors [1-2]. SPR is the collective oscillation of electrons that occurs at the interface between a dielectric and a good conductor. To make it resonant, the parallel polarization wave vector of the incident light matches the wave vector of the surface plasmon [3-4]. Factors affecting the resonance include the incident angle and wavelength of the light source, as well as the permittivity of the dielectric material near the metal surface. During resonance, electrons from the metal absorb most of the energy, thus rapidly decreasing the intensity of the reflected light. According to this principle, with other parameters of the reflected light held constant, changes in the intensity of the reflected light will indicate the changes in the refractive index of the metal-adjoining dielectric material. In SPR biosensing, the ligand is immobilized on a metal surface to form a biosensing film. The sample containing the target analyte is passed over the surface of the biosensing film, where interactions between the target analyte and ligand may * Corresponding author: Li-Zen Hsieh Tel: +866-3-3800301 ext.265; Fax: +886-3-3801407 E-mail:
[email protected]
occur, thus resulting in changes in the refractive index and thickness of the dielectric biosensing layer. Therefore, examining the changes in the intensity of the reflected light can reveal the molecule interactions [5-7]. Methods for detecting the intensity of reflected light have been applied to SPR biosensor [8-9]. The angle of incidence and wavelength of the reflected light at its lowest intensity are taken as the resonance angle and resonance wavelength, respectively. During resonance, there is also a significant phase change of the reflected TM-wave [10]. The phase detection is more sensitive than those of angle or wavelength measurement [11]. There have been a few studies on the phase measurement [12-16], and among these, the common-path interferometers method has been found to be less affected by external disturbance [17]. The TE-wave and TM-wave of different frequencies are employed to obtain the reference and measured beating frequency signals. Most of the noise is eliminated by means of a high-quality filter, thus enhancing the purity of the signal [18]. In this study, the SPR biosensor is developed using a common-path heterodyne interferometer that is employed to detect the interactions between the sheep IgG and its antibody at concentrations ranging from 0.055 to 110µg/ml. Two acousto-optical modulators are utilized to modulate the TE-wave and TM-wave, thus forming a heterodyne light source with a frequency difference of 60 kHz. Observing the phase difference between the reference and measured signals obtained by the dual-phase lock-in amplifier can reveal the
150
J. Med. Biol. Eng., Vol. 26. No. 4 2006
phase shift between the TE-wave and TM-wave. To examine the performance of the proposed SPR biosensor, comparison is also made with the commercial optical sensor Biacore X.
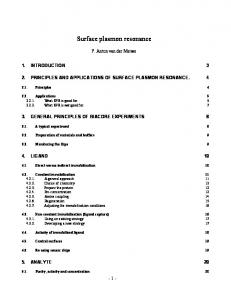
Principle Figure 1 displays the five-layer Kretschmann-Raether configuration of a SPR sensor chip. The five layers from top to bottom are prism, gold film, linker, hydrogel and liquid, all of which serve different functions. The prism provides total internal reflection for inducing SPR. The linker layer, which is attached to the gold film, provides a hydrophilic environment for the immobilization of molecules passing through the hydrogel layer. The antigen and antibody from the solution interact and are bound covalently when passing through the hydrogel layer. When the incident light reaches the interface between the prism and the metal, the component of the wave vector in the x direction is kx = ko np Sinθ
K SP =
ω c
Gold film Linker Hydrogel Liquid Figure 1. The five-layer Kretschmann-Raether configuration
M1
ε mε d ε m +ε d
iδ s
rs = rs e
(3)
rp = rp eδ p
(4)
i
where δs and δp denote the phase shift of the TE-wave and TM-wave, respectively. Since the TE-wave cannot induce SPR, there is little variation in the phase shift near the resonance angle; hence, δs can be regarded as constant. In fact, phase shift of the TM-wave δp shows great variation near the resonance angle. The phase difference, Φ, between the TM-wave and TE-wave can be expressed as Φ=δp-δs.
(5)
Since there exists a linear relationship between the phase difference, Φ, and phase shift of TM-wave, δp, molecular interactions on the sensor surface can be detected by measuring the phase difference.
Experiment 3.1 Buffers and reagents Sensor chip CM5, amine-coupling kits, HBS Buffer (0.01M HEPES pH=7.4, 0.15M NaCl, 3mM EDTA, 0.005% Surfactant P20), sodium acetate (pH=4.0,10mM) and glycine-HCl (10mM pH= 2.0) were all purchased from Pharmacia Biosensor AB (Uppsala, Sweden). Sheep IgG and
PBS1
AOM2 PBS2 M2 Flow cell Rotary stage
(2)
where ε m is the permittivity of gold and ε d is the permittivity of the dielectric sample. When both the TE-wave and TM-wave hit the interface of the dielectric material, the reflection coefficient of the TE-wave, rs, and the reflection coefficient of the TM-wave, rp, can be expressed respectively as
AOM1
Laser
(1)
where k0=2 π λ , np is the refractive index of the prism, and θ is the angle of incidence. The wave vector of surface plasmon resonance is
θ
Prism
BS
Pol2 PhD2
Pol1 PhD1
Lock-in amplifier
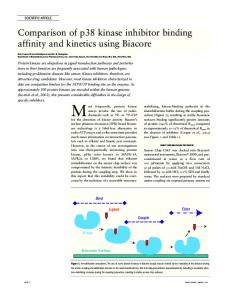
Figure 2. Schematic diagram of the common-path heterodyne interferometer
donkey anti-sheep IgG (whole molecule) were obtained from SIGMA (St. Louis, MO, USA). 3.2 Experimental Setup Figure 2 is the schematic diagram of the common-path heterodyne interferometer used for detecting molecular interactions. The light source is a linear polarized stabilized He-Ne laser of 632 nm wavelength. The incident light is split equally into two beams, TE-wave and TM-wave, by the polarization beam splitter (PBS1). The TE-wave and TM-wave are then modulated by two acoustooptic modulators AOM1 and AOM2 (both are InterAction Corp, 400 series), with frequencies of 40 MHz and 40.06 MHz, respectively. After modulation, the two beams are combined into the heterodyne light source with a frequency difference of 60 KHz by the beam combiner (PBS2). Passing through a beam splitter (BS), the heterodyne light source is again divided into two beams. One passes through a polarizer (Pol1) and enters the photo-detector (PhD1) as a reference signal, Ir, for the lock-in amplifier (Standford Research System, model CR850). The other is transmitted through two prisms, both of which are fixed on the rotary stage (Newport, URM100PP). One prism has its side in close contact with the sensor chip and flow cell, while the other provides total internal reflection of the incident light beam. In this way, the incident light beam transmitted onto the rotary stage will be parallel to that reflected from the rotary stage.
Heterodyne Interferometric SPR Biosensor
151
Finally, this beam passes through another polarizer (Pol2) and enters the photo-detector (PhD2) to become a measurement signal, Im, for the lock-in amplifier in detecting phase shift. The reference signal, Ir, and measurement signal, Im, can be expressed respectively as I r ∝ Eso Epo Cos( ∆ ωt)
(6)
I m ∝ r Ep0Ep0 Cos( ∆ ωt+ Φ )
(7)
P
Eso and Epo denote the amplitudes of the TE-wave and TM-wave, respectively. ∆ ω is the difference in beating frequency between the TE-wave and TM-wave. Φ , the phase difference between TM-wave and TE-wave, is detected by the senor chip and that after being reflected by the prism. Therefore, the difference between the measurement signal and the reference signal obtained by the dual-phase lock-in amplifier can provide real-time detection of the interaction between biological molecules on the sensor chip surface.
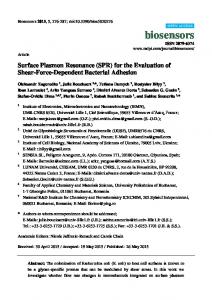
Figure 3. Phase shift of sheep IgG immobilized on the sensor chip surface using the amine-coupling method
Results and Discussion 4.1 Sheep IgG immobilization To immobilize IgG involves binding it covalently to the CM5 sensor chip using the amine-coupling method. All reagents are injected by a peristaltic pump. First, the running buffer, HEPES, is injected into the sensor chip, providing a standard for future comparison. The sensor chip is then activated by a mixture of EDC and NHS at a 1:1 ratio. The sheep IgG is mixed with sodium acetate (pH = 4.0) at a 1:100 ratio, and then injected into the flow cell for covalent immobilization on the CM5 sensor chip. The running buffer, HEPES, is again injected into the flow cell to remove free sheep IgG not bounded on the sensor chip. To prevent non-specific binding, ethanolamine is employed to deactivate the remaining active esters of the unbound sheep IgG. Non-specific or unwanted binding can reduce overall assay performance and sensitivity at extremely low detection concentrations. Figure 3 shows the phase shift and time taken for immobilization of sheep IgG on the sensor chip surface. As can be seen, there is an increase of 85 degree in phase shift as a result of sheep IgG immobilization, indicating that the sheep IgG has been successfully immobilized on the sensor chip surface. 4-2 Biosensing Protocol To analyze the antigen-antibody interaction, the running buffer HEPES is first injected into the flow cell at a rate of 150 ml/min, followed by the injection of the anti-sheep IgG of different concentrations stored in the sample loop after 4 minutes. Finally, glycine-HCl (pH = 2.0) is injected to disassociate the anti-sheep IgG immobilized on the sensor chip to measure the phase shift at various concentrations of anti-sheep IgG. Regeneration of the sensor surface with non-specifically bound anti-body removed is important for maintaining binding reproducibility.
Figure 4 The sensorgram obtained using the common-path heterodyne interferometer
4.3 Measurement with different concentration Figure 4 displays the binding of anti-sheep IgG at various concentrations to immobilized sheep IgG obtained using the phase-measurement-based SPR biosensor. As can be seen, there are increases in phase shift of 4, 14, 33, 62 and 107 degrees at anti-sheep IgG concentrations of 0.055, 0.11, 1.1, 11 and 110 µg/ml. At concentrations below 1.1 µg/ml, the increase is slow and gradual, while at concentrations of 110 µg/ml, the increase is sharp and marked. Figure 5 shows the relationship between phase shift and concentration obtained using the developed SPR biosensor. As can be seen, there exists a linear relationship between the phase difference and various concentrations of anti-sheep IgG. Their correlation can be expressed as Y = 5.595 logX + 38.225 with R2 =0.9686, where X is the concentration of anti-sheep IgG, and Y is the phase difference. T h e sa m e e xp e r i me n t wa s c o n d uc t e d usi n g a commercially available optical biosensor, Biacore X (Biacore International SA, Uppsala, Sweden), and the results are shown in Figure 6. As can be seen, no change in the resonance unit can be detected at anti-sheep IgG concentrations of 55ng/ml and 110ng/ml. However, at anti-sheep IgG concentrations of 1.1, 11 and 110 µg/ml, there are significant changes in the resonance unit that can be attributed to molecular interactions.
152
J. Med. Biol. Eng., Vol. 26. No. 4 2006
Comparing the results shown in Figure 5 and Figure 7 reveals that the phase-measurement-based SPR biosensor is superior in its capacity to detect phase difference at lower concentrations of anti-sheep IgG, while the results obtained from Biacore X better fit the linear relationship between changes in resonance unit and concentrations of IgG.
Conclusion
Figure 5 Plot depicting the relationship between phase difference and concentration of the sensorgram data from Fig.4
This study develops a sensitive SPR biosensor with the common-path heterodyne interferometric system to detect the molecular interactions between sheep IgG and its antibody. The proposed biosensor utilizes a pair of acoustooptic modulators to modulate the TE-wave and TM-wave, thus forming a heterodyne light source with a frequency difference of 60 kHz. The phase difference between the TE-wave and TM-wave can be obtained by using the dual-phase lock-in amplifier to obtain the difference in beating frequency between the reference signal and the measured signal. The obtained phase difference of 4, 14, 33, 62 and 107 degrees between the sheep IgG immobilized on the sensor chip and the anti-sheep IgG with a corresponding concentration ranges from 0.055 to 110 µg/ml. The proposed SPR biosensor constructed with the common-path heterodyne interferometric system does not require fluorescent-labeled analytes or receptors. Not only can it reduce disturbance from the surrounding environment, it can also provide high-sensitivity real-time phase detection for monitoring molecular interactions. Compared with the commercial optical biosensor, Biacore X, this proposed SPR biosensor has better performance in detecting the anti-sheep IgG at concentrations as low as 55ng/ml.
Figure 6 The sensorgram obtained using Biacore X
Acknowledgement This work was supported by the National Science Council of ROC under Grant No. NSC-94-2215-E-007-015.
References [1]
[2] [3]
[4] Figure 7 Plot depicting the relationship between change in resonance unit and concentration of the sensorgram data from Fig.6
Figure 7 is the plot of concentration of anti-sheep IgG against changes in resonance units, showing a linear relationship between the two. Their correlation can be expressed as Y = 1.5699 logX + 1.475 with R2 =0.9949, where X is the concentration of anti-sheep IgG and Y is the change in the resonance unit.
[5]
[6]
[7]
R. L. Rich and D. G. Myszka, “Survey of the 1999 surface plasmon resonance biosensor literature,” J. Mol. Recogn., 13:388-407, 2000. J. Homola, S. S. Yee and G. Gauglitz, “Surface plasmon resonance sensors: review,” Sens. Actuators B, 54:3-15, 1999. A. Otto, ”Excitation of non-radiative surface plasma wave in silver by the method of frustrated total reflection”, Z. Phys., 216:398-410, 1968. E. Kretschmann, “The determination of optical constants of metals by excitation of surface plasmons,” Z. Phys., 241:313-24, 1971. B. Liedberg, C. Nylander and I. Lundström, “Surface plasmon resonance for gas detection and biosensing,” Sens. Actuators B, 4:299-304, 1983. B. Liedberg, C. Nylander and I. Lundström, “Biosensing with surface plasmon resonance-how it all started”, Biosens. Bioelectron., 10:i-ix, 1995. S. Löfås and B. Johnsson, “A novel hydrogel matrix on gold surfaces in surface plasmon resonance sensors for fast and efficient covalent immobilization of ligands,” J. Chem. Soc. Chem. Commun., 21:1526-8, 1990.
Heterodyne Interferometric SPR Biosensor
[8]
[9]
[10]
[11]
[12]
J. L. Elkind, D. I. Stimpson, Anita A. Strong, D.U. Bartholomew and J. L. Melendez, “Integrated analytical sensor: the use of the TISPR-1 as a biosensor,” Sens. Actuators B, 54:182-190, 1999. I. Stemmier, A. Brecht, and G. Gauglitz, “Compact surface plasmon resonance-transducers with spectral readout for biosensing applications,” Sens. Actuators B, 54:98-105, 1999. [10] I. R. Hooper and J. R. Sambles, “Differential ellipsometric surface plasmon resonance sensors with liquid crystal polarization modulators,” Appl. Phys. Lett., 85:3017-3019, 2004. S. G. Nelson, K. S. Johnston and S. S. Yee, “High sensitivity surface plasmon resonance sensor based on phase detection,” Sens. Actuators B, 35:187-91, 1996. A. V. Kabashin and P. I. Nikitin, “Interferometer based on a surface plasmon resonance for sensor applications,” Quantum Electron, 27:653-4, 1997.
[13] [14]
[15]
[16]
[17] [18]
153
C. Xiao and S. F. Sui, ”Characterization of surface plasmon resonance biosensor,” Sens. Actuators B, 66:144-177, 2000. R. Naraka and K. Kajikawa, ”Phase detection of surface plasmon resonance using rotating analyzer method”, Sens. Actuators B, 107:952-956, 2005. P. Westphal and A. Bornmann, ”biomolecular detection by surface plasmon enhanced ellipsometry,” Sens. Actuators B, 84:278-282, 2002. X. Yu, L. Zhao, H. Jiang, H. Wang, C. Yin, and S. Zhu, ”immunosensor based on optical heterodyne phase detection,” Sens. Actuators B, 76:199-202, 2001. D. Malacara, Optical shop testing. New York: John Wiley & Son, ch.3: 95-122, 1992. C. M. Wu, Z. C. Jian, S. F. Joe, and L. B. Chang, ”High-sensitivity sensor based on surface plasmon resonance and heterodyne interferometry,” Sens. Actuators B, 92:133-136, 2003.