J Rehabil Med 2009 Preview
ORIGINAL REPORT
HOW MUCH CHANGE IS TRUE CHANGE? THE MINIMUM DETECTABLE CHANGE OF THE BERG BALANCE SCALE IN elderly PEOPLE Declan Donoghue, BSc (Physio), Physiotherapy Research and Older People (PROP) group and Emma K. Stokes, PhD From the Department of Physiotherapy, Trinity College Dublin, Dublin, Ireland
Objective: To determine the minimum detectable change at 95% confidence for the Berg Balance Scale in a group of elderly people, undergoing physiotherapy rehabilitation. Design: Multi-centre, test-retest design. Subjects: Cross-sectional sample of convenience of people over 65 years (n = 118) without a previous history of stroke, Parkinson’s disease or recent hip arthroplasty. Raters: Physiotherapists working with elderly people, drawn from the Physiotherapy Research into Older People group, ranging in experience from newly qualified to 39 years qualified. Methods: Each participant was assessed using the Berg Balance Scale and again within 48 hours by the same physio therapist. The minimum detectable change at 95% was established. Results: A change of 4 points is needed to be 95% confident that true change has occurred if a patient scores within 45– 56 initially, 5 points if they score within 35–44, 7 points if they score within 25–34 and, finally, 5 points if their initial score is within 0–24 on the Berg Balance Scale. Conclusion: A clinician with a working knowledge of these minimum detectable change values can be up to 95% confident that a true change or not a true change in a patients’ functional balance has occurred and can therefore alter their interventions accordingly to ensure quality, focused rehabilitation. Key words: outcome assessment, Berg Balance Scale, reproduci bility of results, minimum detectable change, aged, physical therapy. J Rehabil Med 2009; 41: 343–346 Correspondence address: Emma Stokes, Department of Physio therapy, Trinity Centre for Health Sciences, James’s Street, Dublin 8, Ireland. E-mail:
[email protected] Submitted June 26 2008; accepted November 20, 2008 INTRODUCTION The Berg Balance Scale (BBS) is a widely used clinical measure of functional balance (1, 2). It has been used extensively as an outcome measure in research involving older people with a variety of conditions, e.g. balance impairments (3), stroke (4), Parkinson’s disease (5), vestibular disorders (6) and in different healthcare settings, including long-term care institutions, day hospitals, geriatric wards within general hospitals (7) and
among community dwelling older people (8). Due to this widespread utilization in research and practice, its psychometric properties must be fully explored and reported in a clinically relevant and applicable manner. The criterion-related validity of the BBS was investigated by Steffen et al. (7) among elderly adults with disability. BBS scores were moderately to highly correlated with scores in numerous functional measurements (Barthel Index, Fugl Meyer Test motor and balance subscales, Timed up and go, Performance-oriented assessment of mobility balance subscale and the Emory Functional Ambulation Profile). The BBS scores also correlated moderately with data obtained from the Dynamic Gait Index, gait speed, caregiver ratings of balance and centre of pressure measures of body sway during still and perturbed standing. It has been suggested that a BBS score of less than 45 is predictive of multiple falls in elderly adults (6), although Riddle & Stratford (9) suggest that the sensitivity and specificity reported for this cut-off point may result in the BBS being more effective at identifying non-fallers. Construct validity of the BBS, by association with neurological and functional status has been supported in an inpatient population with stroke (10). Furthermore, the BBS has been shown to have good validity for patients at different recovery stages post-stroke (4). In relation to reliability, Berg et al. (11) demonstrated Cronbach’s alpha to be 0.83 for 113 elderly adults and 0.97 for 70 patients with stroke. Halsaa et al. (12) demonstrated that kappa values for the different BBS items varied from 0.83 to 1.00 and the intraclass correlation coefficient (ICC) for the sum score of the BBS was 0.99, when tested on 83 patients in a geriatric department. The BBS has been found to have both high inter (ICC = 0.98) and intra-rater reliability (ICC = 0.98) (13). Conradsson et al. (14) investigated the BBS in more depth, and reported inter-item percent agreements ranging from 56% for the trunk rotation task to 91% for the sitting unsupported task. While the weighted kappa values for each item ranged from 0.55 to 0.83. They estimated an overall ICC(3,1) value of 0.97 for intra-rater reliability. Therefore, relative reliability, which is used to describe a measurement’s ability to distinguish among clients (15), has been examined extensively. However, reliability may also be reported in absolute terms (15, 16). The standard error of measurement (SEM) provides a value for measurement error in the same units as the measurement itself, i.e. it is an
© 2009 The Authors. doi: 10.2340/16501977-0337 Journal Compilation © 2009 Foundation of Rehabilitation Information. ISSN 1650-1977
J Rehabil Med 41
344
D. Donoghue et al.
indication of absolute reliability. This type of reliability is more clinically applicable on a day-to-day basis, rather than a relative reliability co-efficient value, such as an ICC, which is more difficult to interpret for clinical decision-making. The SEM also allows the calculation of the Minimal Detectable Change (MDC), which is an estimate of the smallest change in score that can be detected objectively for a client (15), i.e. the amount by which a patient’s score needs to change to be sure the change is greater than measurement error. This differs from the Minimally Important Difference (or Minimally Clinically Important Difference), which is the smallest change on an outcome measure that would be considered important by client or clinician (17), and thus introduces an element of subjectivity. The MDC can be calculated to varying degrees of confidence, e.g. MDC95, (95% confidence) and MDC90, (90% confidence), and though the MDC90 is simply a constant proportion of the MDC95 both appear in the literature (18, 19). The decision to report one or the other depends on the nature of the instrument and how it is to be used, for example 95% confidence would be preferable in cases where the outcome aids decisions regarding surgical intervention or transfer to long-term care as opposed to decisions regarding effectiveness of interventions where 90% confidence may be acceptable. Therefore the calculation of an MDC value is important for day-to-day clinical decisionmaking, increasing clinical applicability and helping to bridge the gap between evidence and practice. Although the reporting of the MDC has been encouraged in the literature (20, 21), studies reporting the MDC for the BBS are sparse and focus on specific populations (14, 18). Therefore, the aim of the present study was to calculate the MDC95 for the BBS in a group of older people, undergoing physiotherapy rehabilitation, with a view to providing physiotherapists with an estimate of the amount of change required in the BBS score so that they can consider whether change noted in clinical practice is more than measurement error. METHODS Participants – raters Members of Physiotherapy Research & Older People (PROP), a national joint clinical and academic research group in Ireland, designed the study protocol and were potential raters. Raters were all physio therapists working with older people who employed the BBS in daily practice. The length of time qualified ranged from newly graduated to 39 years. Following a review of frequently asked questions (K. O. Berg, 2006, personal communication; available on request from authors) a method of application and scoring was agreed by all participant raters. In order to reflect clinical practice, testing took place in various clinical locations throughout Ireland ranging from day care centres to rehabilitation units. Participants – elderly people/subjects A cross-sectional sample of convenience was utilized. Potential participants were aged greater than 65 years and attending physiotherapy rehabilitation in the raters’ departments. They were ineligible to participate if they could not provide informed consent due to communication or cognitive difficulties. In addition, people with a history of stroke, Parkinson’s disease or recent total hip replacement/hemiarthroplasty J Rehabil Med 41
were excluded. Patients with stroke were specifically excluded as the MDC95 for this population has been previously reported (18), people with Parkinson’s disease were excluded as it was thought that diurnal variation in their symptoms would confound the results, while hip flexion is required for certain tasks in the BBS, which is contraindicated in people with recent hip operations. If the participant became unwell in the time between the first and second measurement, they were also excluded as this may have affected the performance scores between the 2 measurements. Protocol Once a potential participant was identified, he or she was provided with an information leaflet and informed consent was obtained. Demographic data were recorded from the medical and physiotherapy charts. The participant’s history of falls in the previous 6 months was noted (a fall was defined as an unexpected event in which the participant came to rest on the ground, floor, or lower level) (22). In addition the participant’s mobility status was recorded. Performance on the BBS was measured at 2 points in time – between 24 and 48 h apart to minimize the effect of change between time 1 and time 2. The BBS is an ordinal scale of 14 progressively more difficult tasks performed to assess functional balance. Tasks range from timed sitting balance to standing on one leg and are ranked from 0 (unable to perform) to 4 (completes task as instructed with no difficulty). At time 2, raters were blind to the measurement score from time 1. Ethical approval was obtained from all local ethics committees involved. Analysis Microsoft Excel was used for data management and analysis. Data were analysed according to the participant categories of mobility status and BBS range score. The MDC95 analysis was performed as described by Stratford (16). The SEM was calculated using the formula: SEM = s√ (1 – r), where s = the mean and standard deviation (SD) of time 1 and time 2, r = the reliability coefficient for the test, i.e. Pearson’s correlation co-efficient between test and retest values. Thereafter the MDC95 was calculated using the formula: MDC95 = SEM × √2 × 1.96.
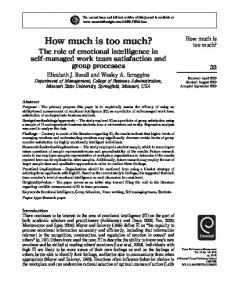
RESULTS Participants One hundred and eighteen older people participated, of which 34.7% were male, with an overall mean age of 80.5 years, (range 65–95, SD 6.6 years). Forty-five percent (n = 53) of participants had fallen in the past 6 months; reporting an average number of 2 falls (range 1–10, SD 1.66). The mobility status of participants ranged from completely independent (15.3%) to requiring the physical assistance of one person (1.1%). BBS scores The mean BBS score at time 1 (BBS 1) was 38.6 (SD 9.6, range 13–54), while the mean BBS score at time 2 (BBS 2) was 39.1 (SD 9.4, range 16–56). A Kolmogorov-Smirnov test indicated that the data were normally distributed and allowed for parametric testing. The distribution of the differences in BBS scores from time 1 and time 2 can be seen in Fig. 1, with the upper and lower limits of agreement +4.5 to –5.5, respectively. The difference between BBS 1 and BBS 2 for individual participants ranged from zero to 10. Twenty-two participants (18.7%) showed no difference, while 25.4% of participants showed a difference of 1 BBS point, with 82.2% of participants showing a difference of 3 or less BBS points (Table I).
Minimum detectable change of BBS in older people
345
Table II. Minimum Detectable Change value for participants according to range scores on the Bergs Balance Scale (BBS) BBS score groups (n)
Mean BBS score (SD)
BBS points SEM
MDC95
0–24 (11) 25–34 (27) 35–44 (45) 45–56 (35)
20.9 (3.8) 30.9 (3.8) 39.8 (3.3) 49.5 (2.9)
1.7 2.3 1.8 1.2
4.6 6.3 4.9 3.3
SD: standard deviation; SEM: standard error of measurement; MDC95: minimum detectable change at 95% confidence.
Fig. 1. Mean value and differences between Berg Balance Scale (BBS) 1 and 2 with mean absolute agreement and upper and lower limits of agreement indicated by unbroken and dashed lines, respectively. BBS1: at time one; BBS2: at time two.
MDC values The MDC95 for various participant categories are presented in Tables II and III. The largest MDC95 was 6.3 BBS points for participants in the 25–34 BBS score range group (n = 27), while the smallest MDC95 was 3.3 BBS points for both participants in the 45–56 BBS score range group (n = 35) and the independent mobilizers (n = 18). DISCUSSION The primary aim of the present study was to determine the MDC95 for the BBS in a group of older people undergoing physiotherapy rehabilitation. Perhaps the most informative MDC95 values are for clients grouped according to range score on the BBS (Table II). This information allows the clinician to differentiate between true change and change due to measurement error for all levels of performance on the BBS irrespective of age, mobility status, falls history or other external indicators of performance. Based on the MDC95 values according to mobility status (Table III) it may be inferred that as a persons’ level of assistance increases, so does the amount of change required in their BBS score to be sure that the change observed is actual clinical
Table I. Absolute difference in total Berg Balance Scale (BBS) scores between time 1 and time 2 Difference in BBS points
Participants, n, (%) (n = 118)
Cumulative percentage
0 1 2 3 4 5 6 7 8 9 10
22 (18.7) 30 (25.4) 26 (22.0) 19 (16.1) 14 (11.9) 4 (3.4) 2 (1.7) 0 (0) 0 (0) 0 (0) 1 (0.8)
18.7 44.1 66.1 82.2 94.1 97.5 99.2 99.2 99.2 99.2 100
change. The error associated with the BBS may increase as the person’s performance decreases, necessitating a higher MDC value at lower levels of performance. This may also account for the higher MDC95 values reported in patients with stroke (18) who would not be expected to perform as well as their counterparts in the present study who had not experienced a cerebrovascular accident. Indeed, the MDC95 values reported in the current study are somewhat lower than the scores previously reported of 7 and 8 points by Stevenson (18) and Conradsson et al. (14), perhaps due to the different clinical populations assessed (patients with stroke and long-term care residents, respectively). An effort was made to balance numbers within the main groups by BBS score ranges; however it was difficult to recruit participants within the 0–24 range group. Therefore future studies could attempt to quantify a more robust MDC95 value using a larger sample in this range of scores. The MDC95 values of 6.3 points, 4.9 points and 3.3 points for the ranges of 25–34, 35–44 and 45–56 on the BBS, respectively, were determined using larger sample sizes and thus may be utilized in the clinical setting with confidence. Possible floor and ceiling effects of the BBS may account for the smaller MDC95 values seen at the extreme ranges of the scale. The MDC is a relatively easy to generate statistic that provides clinically relevant information in meaningful terms; however, a documented limitation is that it assumes detectable changes are uniform throughout the scale, in spite of the fact that measurement error can vary at different points along the scale (19). This limitation illustrates the effectiveness of having an MDC value that is specific to certain ranges in the scale, as reported in the current study. A conditional SEM reported by Table III. Minimum Detectable Change values for participants according to mobility status Mean BBS score (SD)
BBS points
Participant group (n)
SEM
MDC95
Independent (18) Independent with cane (48) Independent with frame (7) Independent with rollator (31) Requires SBA (12) Requires PA × 1 (2)
49.2 (4.4) 42.2 (7.0) 33.7 (7.0) 33.4 (7.5) 30.8 (7.9) 18 (4.9)
1.2 1.7 1.9 2.0 2.1 UTD
3.3 4.8 5.2 5.6 5.9 UTD
SD: standard deviation; SEM: standard error of measurement; MDC95: minimum detectable change at 95% confidence; BBS: Berg Balance Scale; SBA: stand-by assistance; PA × 1: physical assistance of 1; UTD: unable to determine. J Rehabil Med 41
346
D. Donoghue et al.
Stratford et al. (19) in relation to the Roland Morris Questionnaire (RMQ) also defined the minimum level of detectable change along a scale, i.e. the RMQ. This method may give a more accurate representation of true change at various points along a scale and could be applied to the BBS in practice and in future studies. MDC95 values have been estimated for different range scores of the BBS. A clinician with a working knowledge of these MDC values can be up to 95% confident that a true change or not a true change in a patients’ functional balance has occurred and can therefore make evidence-based clinical decisions and alter their interventions accordingly to ensure quality, focused rehabilitation. ACKNOWLEDGEMENTS The authors wish to acknowledge the helpful suggestions of Professor Anne Shumway-Cook, Emeritus Professor, University of Washington, which informed the methodology of the study and made the results more meaningful for clinical decision-making. We would also like to acknow ledge the contribution of all members of the PROP group and the patients who gave their time generously to participate in the study. PROP is a national joint clinical and academic research group working out of the Department of Physiotherapy, School of Medicine, Trinity College Dublin. It aims to enable physiotherapists working in clinical practice with elderly people to carry out research relevant to their practice. It has upwards of 20 active members. Contributors: Dr Emma K. Stokes designed the project, supervised the data gathering and co-wrote the paper; Declan Donoghue participated in the data gathering, data analysis and co-wrote the paper. PROP group members designed the project, gathered the data and assisted in the writing of the paper. Anna Murphy, St Vincent’s University Hospital; Anne Jennings, Sacred Heart Hospital Castlebar; Anne McAuliffe, Trinity College Dublin; Susan O’Neill, St Vincent’s University Hospital; Eilis Nic Charthaigh, St Finbar’s Hospital, Cork; Elizabeth Griffin, Royal Hospital Donnybrook Dublin; Letitia Gilhooly, Naas Hospital; Mary Lyons, Connolly Memorial Hospital, Dublin; Rose Galvin, Trinity College Dublin; Sinead Gallagher, St Finbar’s Hospital, Cork; Sinead Ward, St James’s Hospital, Dublin; Eimear Ni Mhaille, St Colmcille’s Hospital, Dublin.
REFERENCES 1. Kay TM, Myers AM, Huijbregts MPJ. How far have we come since 1992? A comparative survey of physiotherapists’ use of outcome measures. Physiother Can 2001; 53: 268–275. 2. Stokes E, O’Neill D. Use of outcome measures in physiotherapy practice in Ireland from 1998 to 2003 and comparison to Canadian trends. Physiother Can 2008; 60: 109–116. 3. Berg KO, Wood-Dauphinee SL, Williams JI, Gayton D. Measuring balance in the elderly: preliminary development of an instrument. Physiotherapy Canada 1989; 41: 304–311. 4. Mao HF, Hsueh IP, Tang PF, Sheu CF, Hsieh CL. Analysis and com-
J Rehabil Med 41
parison of the psychometric properties of three balance measures for stroke patients. Stroke 2002; 33: 1022–1027. 5. Brusse KJ, Zimdars S, Zalewski KR, Steffen TM. Testing functional performance in people with Parkinson’s disease. Phys Ther 2005; 85: 134–141. 6. Whitney S, Wrisley D, Furman J. Concurrent validity of the Berg Balance Scale and the Dynamic Gait Index in people with vestibular dysfunction. Physiother Res Int 2003; 8: 178–186. 7. Steffen TM, Hacker TA, Mollinger L. Age- and gender-related test performance in community-dwelling elderly people: Six-Minute Walk Test, Berg Balance Scale, Timed Up & Go Test, and gait speeds. Phys Ther 2002; 82: 128–137. 8. Whitney SL, Poole JL, Cass SP. A review of balance instruments for older adults. Am J Occup Ther 1998; 52: 666–671. 9. Riddle DL, Stratford PW. Interpreting validity indexes for diagnostic tests: an illustration using the Berg balance test. Phys Ther 1999; 79: 939–948. 10. Usuda S, Araya K, Umehara K, Endo M, Shumizu T, Endo F. Construct validity of functional balance scale in stroke inpatients. J Phys Ther Sci 1998; 10: 53–56. 11. Berg K, Wood-Dauphinee S, Williams JI. The Balance Scale: reliability assessment with elderly residents and patients with an acute stroke. Scand J Rehabil Med 1995; 27: 27–36. 12. Halsaa KE, Brovold T, Graver V, Sandvik L, Bergland A. Assessments of interrater reliability and internal consistency of the Norwegian version of the Berg Balance Scale. Arch Phys Med Rehabil 2007; 88: 94–98. 13. Berg KO, Maki BE, Williams JI, Holliday PJ, Wood-Dauphinee SL. Clinical and laboratory measures of postural balance in an elderly population. Arch Phys Med Rehabil 1992; 73: 1073–1080. 14. Conradsson M, Lundin-Olsson L, Lindelof N, Littbrand H, Malmqvist L, Gustafson Y, et al. Berg balance scale: intrarater test-retest reliability among older people dependent in activities of daily living and living in residential care facilities. Phys Ther 2007; 87: 1155–1163. 15. Finch E, Brooks D, Stratford PW, Mayo NE, editors. Physical rehabilitation outcome measures : a guide to enhanced clinical decision making. 2nd edn. Hamilton: Canadian Physiotherapy Association, BC Decker Inc; 2002. 16. Stratford PW. Getting more from the Literature: estimating the standard error of measurement from reliability studies. Physiother Can 2004; 56: 27–30. 17. McDowell I, editor. Measuring health: a guide to rating scales and questionnaires. 3rd edn. New York: Oxford University Press; 2006. 18. Stevenson TJ. Detecting change in patients with stroke using the Berg Balance Scale. Aust J Physiother 2001; 47: 29–38. 19. Stratford PW, Binkley J, Solomon P, Finch E, Gill C, Moreland J. Defining the minimum level of detectable change for the RolandMorris questionnaire. Phys Ther 1996; 76: 359–365; discussion 366–368. 20. van Genderen FR, de Bie RA, Helders PJM, van Meeteren NLU. Reliability research: toward a more clinically relevant approach. Phys Ther Rev 2003; 8: 169–176. 21. Haley SM, Fragala-Pinkham MA. Interpreting change scores of tests and measures used in physical therapy. Phys Ther 2006; 86: 735–743. 22. Hauer K, Lamb SE, Jorstad EC, Todd C, Becker C. Systematic review of definitions and methods of measuring falls in randomised controlled fall prevention trials. Age Ageing 2006; 35: 5–10.