Indexing and Retrieval Scheme of the Image Database Based on Color and Spatial Relations Timothy K. Shih, Ching-Sheng Wang, Anthony Y.Chang and Chuan-Ho Kao Dept. of Computer Science and Information Engineering Tamkang University Tamsui, Taiwan
R.0.C E-mail:
[email protected]
ABSTRACT We propose a new approach to retrieve images from an image . . database. We combine both color and spatial features of a picture to index and measure the similarity of images. We propose a new automatic indexing scheme of image database according to our clustering method, which could firter the image e#ciently. As a technical contribution, a Seed-Filling like algorithm that could extract the shape and spatial relationship feature of image is proposed. Also, the system is incorporated with a visual intetface, which allows the user to spectjj objects as the spatial specifcation of pictures. With color identification and spatial similarity functions, the preliminary experience shows that the system is able to retrieve image information of a very high satisfaction.
1. INTRODUCTION Most conventional image databases are text-annotated. As a result, image retrieval is based on keyword searching. Text-annotated images are simple and easy to manipulate. However, there are two major problems with this method. First, creating keywords for a large amount of image is time consuming. Moreover, the keywords are inherently subjective and not unique. With these disadvantages, automatic indexing and retrieval based on image content becomes more desirable for developing large image retrieval applications. Color, shape, and texture are the main features for human beings as well as computers to recognize the image. Several systems have been proposed in recent years in the research community of content-based information retrieval. QBIC is the first CBIR system actually been built [13. It allows query by color, shape, texture, example and sketch. VisualSeek allows contentbased and spatial similarity evaluations [Z]. For indexing the database, Swain and Ballad [3] using histogram intersection as color indexing.
In this paper, we select the HSI color space to construct the index structure. Besides, the chromatic and spatial infomation of the image are retained in this paper. We proposal a fast database indexing scheme according to our clustering method based on
0-7803-6536-4/00/$10.00(c) 2000 IEEE
MTM (Mathematical Transform to Munsell) for filtering out the non-similar images effectively. Then, we combine the color and spatial relationship of objects to measure the similarity of images. Many researchers propose temporal modeling of multimedia objects. The discussion in [4] identified various temporal interaction forms and discussed their temporal dependencies. The 2D Projection Interval Relations (i.e.. PIR) [5] is based on both directional and topological temporal relations. Image retrieval algorithms were discussed based on PIR. The use of spatio-temporal relations serves as a reasonable semantic tool for the underlying representation of objects in many multimedia applications. In this paper, we extend temporal interval relation by means of a complete analysis for spatial computation. Therefore our image content-based information retrieval system is developed based on color and spatial relation properties. This rest of our paper is organized as follows. In Section 2, the color clustering and indexing scheme of image database are discussed. Shape extraction method is given in Section 3. Section 4, describes the computation of spatial similarity of values corresponding to the query object sets of images. Section 5 describes the procedure of image retrieval in our system, Finally, conclusions and the discussion of our fbture works are given in Section 6.
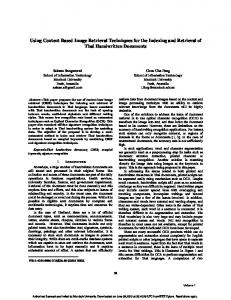
2. COLOR CLUSTERING AND INDEXING SCHEME OF IMAGE DATABASE There are common issues underlying all color-based retrieval methods: the selection of a proper color space [6,7], and the use of a proper color quantization scheme to reduce the color resolution. In our study, HSI is the chosen color space because of its better sensibility, similarity, and accuracy compared to others. The quantization scheme and the procedure of color clustering are showed in Figure 1. Firstly, we equally quantized the RGB color space to change color levels from 256 to 16 levels in each axis. Secondly, we convert the 16-level RGB color bins to the HSI coordinates by an MTM transformer. And, we cluster the hue to 12 levels, since hue is represented as circle and primary hues are located on the equal space at 60 degrees (Red, Yellow,
129
Authorized licensed use limited to: Tamkang University. Downloaded on March 24,2010 at 04:21:03 EDT from IEEE Xplore. Restrictions apply.
Green, Cyan, Blue and Magenta) in the HSI color space. And, since the human visual system is more sensitive to hues as compared to saturation and intensity, the H axis should be quantized finer than S axis and I axis. In experimenting, we quantized the HSI color space into 12 bins for hue, 4 bins for saturation, and 4 bins for intensity. Finally, We normalize the resolution of all images to be 400*300.
256*256*256
12*4*4
HSI 4
16*16*16
program tries to combine as many boxes in a region as possible, if the color similarity between the seed box and the neighbor box is within a threshold. steps: Refine the image. The result of front steps will contain many regions (see Figure 2c). Each region contains some boxes. We remove the scattered small regions, Because in general it is unless to retrieval the image and will decrease the performance (see Figure 2d). Step6: Project the objects from 2-D space to two 1-D spaces and record those spatial relations of objects. Then compute the similarity on structure.
16*16*16
Fig.1 Procedure diagram of the color clusteringand normalization After the quantization and normalization, system will calculate the histogram and dominant colors of the image. The color histogram is an array that is computed by differentiating the colors within the images and counting the number of pixels of each color. From the color histogram, we could choose the dominant colors whose numbers of pixels exceeds the threshold. After getting the dominant colors. we saving the image ID to each corresponding color bin. And. the logical address of length equals to 1 byte only (01000101=69) of each color bin in the database could be obtained immediately according to their hue (OlOO), saturation (Ol), and intensity (01).
(c) (4 Fig. 2 Example of processed image (a) Original image.(b) Color clustering image. (c) Shape extraction image (d) Refined image
4. SIMILARITY FUNCTIONS OF SPATIAL RELATION
3. THE EXTRACTION OF OBJECT AND SPATIAL RELATIONSHIP In this system, We divide the image and use the Seed Filling algorithm to extract the shape feature. The procedure is described below: Stepl: Quantization and Normalization the image Step2: Dividing the image. We divide an image into a number of boxes on the chessboard. The size of each box is 4*4 pixels and the representative color of a box is calculated by the average color of all pixels in the HSI color space. Step3: Filling the Seed. Starting from the upper-left comer, a box is chosen as a seed with the next box four units away both in the vertical and horizontal directions. Step4: Extract the objects. Starting from a seed box, the program looks at the left, right, up, and down directions. And, the
0-7803-6536-4/00/$10.00 (c) 2000 IEEE
In order to recognize and identify objects, the vision system must have stored object models. In this section, we split the objects orthogonally to the coordinate axis and compute spatial relation similarity for image information retrieval. We focus on 2-D spatial relational representation to demonstrate the usefolness in the spatial domain. It is the simplest kind of spatial information of practical relevance. The 1-Dspatial relation case, while different from the temporal relations, can be handled by a simple modification of temporal interval relations. Qualitative calculus is a calculus of intervals instead of real numbers. To deal with qualitative representation, we subdivide the real number in timeline into three intervals: [-00, 01, [0, 01 and [O, -1. We denote these three intervals by {e}, {=} and {>} for representing relation between two points. Qualitative variables take these values only.
130
Authorized licensed use limited to: Tamkang University. Downloaded on March 24,2010 at 04:21:03 EDT from IEEE Xplore. Restrictions apply.
Based on qualitative point relations, we use an encoding method to generalize and prove the 13 interval exclusion relations. Suppose A, and A, are the starting and ending points of the line segment A. And, B, and Be are those of B. We define a binary relation, 0,(either for “A is before B”, “A is the same as B , or “A is after E’) of two points. The 13 interval relations introduced by Allen [8] make the binary relations hold in the first part of the following table:
of Table 1.
Defurition 4.1: A point relation distance (PRD) defined with respect to a point relation r of index n have n incompatible differences from r. The following table gives a definition of point relation distance: Table 2 Point Relation Distance PRD)
Table I:Starting and Ending Point Relations AseB AsOB AeOB AeOB ID Interval Relations
I
< > >
c
< > > > > >
>
c
>
e > >
= >
=
= >
=
>
> > > >
>
>
= =
1 {e} 2 {>} 3 { d } 4 {di} 5
( 0 )
6 7 8 9 10
{oi} {m} {mi} {s}
11
{si} {f}
12
(fi}
c
Definition 4.2: An extended point-interval relation distance WPIRD) defined with respect to a point-interval or interval relation r of index n have n incompatible differences from I: Let R and R are two interval relations or point-interval relations. The encoding point relation of R (see Table 1) is RA,4Ba,RrU4&,RAcOBs, RAe4&,and the encoding point relation of R‘ is R)As4B,, Rh4&, RAe4&,Rk+& We have a E P I . formula: EHRD (R, R’)= PRD (Rb4el R‘b4a3.+ P (Rr~4eoR ’ r ~ 4 d + pm (RAcOBs, R A e 4 B 3 + (RAe4Be, RAe4B3 We derived the EPIRD Table &om EPRD formula: Table 3: The Extented Point-lntetvalRelation Distance
EPIR I < > D d o o m m D i i i 0 8 4 4 2 6 1 7 > 8 0 4 4 6 2 7 1 D 4 4 0 4 2 2 3 3 Di 4 4 4 0 2 2 3 3 0 2 6 2 2 0 4 1 5 Oi 6 2 2 2 4 0 5 1 M 1 7 3 3 1 5 0 6 Mi 7 1 3 3 5 1 6 0 s 35131324 Si 5 3 3 1 3 1 4 2 F 5 3 1 3 3 1 4 2 Fi 3 5 3 1 1 3 2 4 E 4 4 2 2 2 2 3 3 Los 6 2 4 2 4 2 5 1 Loe 2 6 4 2 2 4 1 5 01s 2 6 2 4 2 4 1 5 Ole 6 2 2 4 4 2 5 1 00 4 4 4 4 4 4 3 3
The second part of the table has five special cases for pointinterval relations. For instance, we use A 10s B to represent A is a line and B is a point, where A and B meets at the starting point of A. The situations of points of two line segmentscould have unto 34 = 81 rows in the above table. However, except for the 18 cases illustrated in Table 1, others are conflict situations (i.e., it is physically impossible for the situation to occur). For example, a relation (As < Bs, As < Be, Ae > Bs, Ae