Int. J. Agr. Ext. 02(03) 2014. 227-234
Available Online at ESci Journals
International Journal of Agricultural Extension ISSN: 2311-6110 (Online), 2311-8547 (Print)
http://www.escijournals.net/IJAE
INVESTIGATING THE EFFECTS OF HYDROPONIC MEDIA ON QUALITY OF GREENHOUSE GROWN LEAFY GREENS aScot
a
D. Ferguson, bRaymond P. Saliga III, aStanley T. Omaye Department of Agriculture, Nutrition, and Veterinary Sciences, University of Nevada, Reno, USA. b High Desert Farming Initiative, University of Nevada, Reno, USA.
ABSTRACT Information regarding optimizing greenhouse agriculture and use of hydroponic media for produce growth is lacking. We examined the difference in yield at high, medium, and low levels of commercial hydroponic nutrient solutions in order to optimize the cost-benefit relationship in the growth of leafy greens. Also, we determined the feasibility of an “organic” self-prepared nutrient solution for leafy green growth. Regardless of level of commercial hydroponic nutrient solutions, leafy greens growth was similar; however, use of “organic” nutrient solution provided problematic leafy greens growth. Overall, we found that hydroponic systems are cost-effective and can complement a sustainable leafy green production. Additional research will be required to develop productive and cost-effective “organic” nutrient solutions. Keywords: Greenhouse, hydroponic, nutrient solutions, quality, technology. INTRODUCTION Greenhouse agriculture has the potential for improving yield and vegetable quality in sub-optimal environments (Paulitz and Belanger, 2001). Fruit and vegetables are important sources of antioxidants (Ehret et al., 2013), which are important in preventing chronic disease (Mayne, 1996; Omaye and Zhang, 1996; Dubick and Omaye, 2001; Giovannucci, 2002; Dorais et al., 2008; Dorais et al., 2007). Local agriculture provides employment and access to fresh, healthy fruits and vegetables. Despite increased frequency of greenhouse vegetable production, basic information on optimal nutrient growing solutions and other environment factors for production of commercial vegetables is lacking. Greenhouse agriculture needs to be optimized for efficiency and economic viability (Paulitz and Belanger, 2001; Floros et al., 2010). Hydroponic systems deliver water and nutrients to growing plants continuously and at high relative water potentials (Wheeler, 2010; Ciju, 2012; Resh, 2013). Nutrient levels and composition need to be optimized _________________________________________________________________ * Corresponding Author: Email:
[email protected] © 2014 ESci Journals Publishing. All rights reserved.
227
for efficiency and reduction of waste. Nutrient and fertilizer delivery is a high-cost component to production, especially in hydroponic systems which often use proprietary blends of chemical fertilizers. Organic fertilizers are gaining in popularity, but need to be standardized and tested in hydroponic systems before they are widely used. Simple, repeatable, quality mixes of organic fertilizers allow the potential for recycling nutrients and locally producing fertilizers (Feri et al., 2002; Monje et al., 2003). Hydroponic systems can be manipulated to investigate the influence of aqueous media on vegetable production. In this research, we first tested the feasibility of using low levels of commercial nutrients (1/2-1/4 of recommended rates) on green leafy vegetable production. In subsequent tests, we created an organic nutrient solution and compared the yield to both the high and low level conventional nutrient treatments. Our goals were 1) to determine the difference in yield at high and low level nutrients in order to optimize the cost-benefit relationship of nutrient levels and yield; and 2) to develop a standardized, repeatable and reliable organic nutrient solution that achieves an optimal yield.
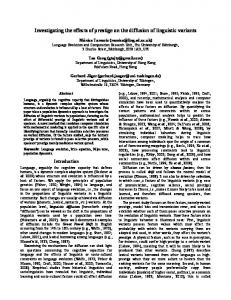
Int. J. Agr. Ext. 02(03) 2014. 227-234 METHODOLOGY Greenhouse Hydroponic Setup and Conditions: Greenhouse 14 on the campus of the University of Nevada, Reno was set up to grow culinary leafy greens in hydroponic float culture (Figures 1 and 2). The greenhouse is a facility managed under the University of Nevada, Reno’s High Desert Farming Initiative (HDFI) and is Good Agricultural Practices (GAP) certified by the United States Department of Agriculture (USDA, GAP & GHP). The experimental design consisted of 9 trays in a row along the length of the greenhouse. Each tray is 8 feet long, 4 feet wide, and approximately 6 inches deep
and filled with aqueous nutrient solution. Foam insulation with space for plants floats on the solution. The 9 trays are divided into 3 continuous-flow systems consisting of 3 trays connected to a single reservoir in which nutrient and pH levels can be adjusted (Figure 2). The reservoir allows homogenization of the solution applied to each replicate tray and allows recirculation and mixing of the growing solutions. Each tray-andreservoir system contains approximately 400 gallons of aqueous media. In each tray, plants were spaced at 8 inches from each other and a total of 55 plants are grown in each tray, for a total of 495 plants.
Figure 1 Figure 2 Figure 3 Figure 1. Photograph of the growing lettuce in hydroponic float culture system. Each tray was connected in a continuous flow system to barrel reservoirs for homogenization and mixing of nutrient solutions. Figure 2. Design for experimental treatments. Schematic illustrates that three trays are connected to a barrel reservoir for circulation of water permitting nutrient addition and adjustment of pH. In this system, nutrients or other media treatments can be compared. Figure 3. Photograph of the organic nutrient solution prepared from fish meal, rock phosphate, and potash. The solution was oxygenated with an air pump for 1 week prior to addition to the production system in order to mineralize nutrients. Greenhouse and hydroponic conditions were synthetically active light inside the greenhouse at midmonitored regularly. Greenhouse temperature controls day was 1/3 of the light intensity outside. The pH of the were set to maintain temperature at approximately nutrient solution was buffered to between 6.0 and 6.4, 24°C continuously; although during days, temperatures and water temperatures were set to ≥18 oC. did occasionally rise to > 30°C. Background light Plants were grown in small propagation trays for the intensity in the greenhouse was reduced from ambient first 2-3 weeks prior to transplanting to the hydroponic outdoor light by greenhouse covering: total photo trays. Seeds were sown directly into a 1” cube of rock
228
Int. J. Agr. Ext. 02(03) 2014. 227-234 wool (Cultilene Rockwool) and kept moist with water adjusted to pH 6.0-6.4. When roots are observed at the bottom of the rock wool cube and plants are strong enough to be transplanted, seedlings were transplanted into the hydroponic system. The three species allowed us to test media treatments on multiple plant types to determine if our results are plant-specific or have wide applicability to many types of culinary greens. Plant species responses were analysed separately. The species used were: 1) Rex (Butterhead lettuce); 2) Nevada Summer Crisp lettuce; and 3) Bok Choy. These species are common hydroponic plants and are frequently available for sale. Plants of each species were planted into each tray in order to have replication of each treatment on each cultivar. At the end of each plant production cycle, the entire crop of plants was harvested and sold to food services at the University of Nevada, Reno. A random subsample from each species from each tray was weighed. Total yield, market price, and efficiency of inputs (heat, power, nutrients, etc.) were determined for each production cycle based on current and area market prices (Northern Nevada, in the spring of 2014). The effect of nutrient quantity on production of culinary greens: In the first production cycle, hydroponic plants were grown at low nutrient levels to determine the lowest level of nutrients that can still yield a market ready crop. We used General Hydroponics Flora series nutrients, in 1:1:1 ratio to a final ppm of 300, 400 and 500 ppm total dissolved solids (municipal water had 100 ppm total dissolved solids, thus nutrient levels represent an addition to the 100 ppm dissolved solids in tap water). We defined the levels of nutrients as low (L), medium (M) and high (H). The macronutrient content for nitrogen, phosphorus and potassium was 14, 12, and 22 ppm, respectively, for L. The macronutrient content for nitrogen, phosphorus and potassium was 24, 21, and 36 ppm respectively for M. The macronutrient content for nitrogen, phosphorus and potassium was 36, 31 and 57 ppm, respectively for H. In our second production cycle we compared our low level nutrient (400 ppm total as described for the first production cycle) , high level nutrient (1200 ppm, 1:1:1 ratio of Flora Grow Series), as recommended for commercial production and a self-prepared organic nutrient solution. The organic nutrient levels were designed to balance the macronutrient levels of the
229
organic media with the high level conventional nutrient (Smith-Spangler et al., 2012). We calculated the theoretical nutrient level that could be achieved with the organic components assuming a 100% mineralization of the fertilizers into soluble forms that could be taken up by the plants. We defined the levels of nutrients as low (L), high (H) and organic (O). The macronutrient content for nitrogen, phosphorus and potassium was 24, 21, and 36 ppm, respectively, for the L. The macronutrient content for nitrogen, phosphorus and potassium was 79, 61, and 188 ppm, respectively, for H. The macronutrient content for nitrogen, phosphorus, and potassium ws 80, 50, and 120 ppm, respectively, for O. Our organic nutrient solution consisted of 290 g potash (50% K2O), 300 g of organic source rock phosphate (21%P2O5), and 840 g fish meal fertilizer (12%N). The fish meal was put in a 50 gallon drum and aerated for 7 days in order to promote aerobic mineralization prior to adding the fertilizer to the hydroponic production system (Figure 3). Statistical Analysis: To determine differences among hydroponic solutions, an one-way analysis of variance was performed and a post-test was used when significance was observed. A probability value of p < 0.05 was used to determine significance. Results are expressed as mean ± standard deviation (S.D.). RESULTS AND DISCUSSION Production cycle 1: low level nutrients: The first experiment determined whether culinary greens can be successfully grown with levels of nutrients lower than manufacture suggestions. Data for fresh weight of the lettuces is presented in Figure 4. Bok Choy grew rapidly and produced the highest yield. Butterhead lettuce and Nevada Summer Crisp lettuce had similar biomass, while butterhead lettuce is a highly-desired lettuce variety, potentially yielding a higher price. All of the lettuces were of high quality, had good flavor (personal preference), were relatively free of insect pests and disease, and were produced in about a 6 week period. Yield and returns for vegetables produced in the first production cycle in hydroponic float culture is listed in Table 1. All three levels of nutrient concentrations resulted in similar yield of butterhead and Nevada summer crisp lettuce with respect to wet weights. The mean wet weight of Bok Choy was heavier; however, based on market value of the different lettuces, total crop value was similar.
Int. J. Agr. Ext. 02(03) 2014. 227-234
350.0 300.0
Weight, g ± SD
250.0 200.0 150.0 100.0 50.0 0.0
Mean, g
LOW
LOW Butterhe Bok Choy Bok Choy Bok Choy ad 276.6
MED
291.4
HIGH
292.9
104.8
Figure 4. Production Cycle 1. Figure 4. Production Cycle 1. Fresh weight (g) of lettuces grown at; high (500 ppm), medium (400 ppm) and low (300 ppm) levels of nutrients. High, medium and low levels of nutrients were lower than manufacture’s recommended nutrient levels (1200 ppm). Lettuces grew relatively well in the early season under these
MED Butterhe ad
HIGH Butterhe ad
116.2
115.0
LOW
MED
HIGH
Nevada
Nevada
Nevada
97.0
115.4
108.0
conditions, likely due to low levels of light resulting in a proper balance of growth rate and nutrient availability. Values are expressed as mean wet weight ± standard deviation (SD). There was no significant difference within treatment for each either Bok Choi, Butter head or Nevada lettuce (P > 0.05).
Table 1. Yield and returns for vegetables produced in the first production cycle in hydroponic float culture. Mean Weight/plant, Total Weight, Leafy Green Plants, N Price/lb lb lb Bok Choy 180 0.64 115 $1.50 Butterhead 180 0.25 45 $4.00 Nevada Summer Crisp 135 0.24 32 $4.00 Total 495 192 Production cycle 2: Organic nutrients: Our second experiment compared the low level nutrient solution from the first production cycle to both an organic nutrient solution as describe in the methods section and to a high level conventional nutrient solution. Vegetables grown at low levels of nutrients were much smaller for Bok Choi than those grown at high nutrient levels (620 g high treatment vs. 384 g low treatment). However, the costs for nutrients was significantly reduced (~$40 high nutrient vs. ~$10 low nutrient). High levels of nutrient had less yield increase for butterhead and Nevada summer crisp lettuce. The organic nutrient solution did not yield as much as even the low level conventional solution; however, organic vegetables can be sold for about 30% higher price (Curtis & Cowee, 2011; Curtis et al., 2014) than conventional vegetables in an appropriate market, and
230
Total Crop Value $172.50 $180.00 $128.00 $480.50
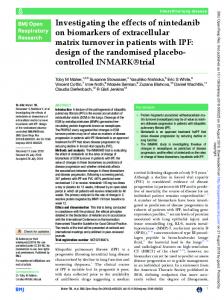
costs of fertilizer is significantly reduced (Table 2). It should be noted that second production cycle was later in the year than first cycle, and the vegetables grew faster with higher light and nutrient levels. Figure5. Production Cycle 2. Fresh weight (g) of lettuces grown at low (400 ppm) and high (1200 ppm) compared to lettuce grown in organic nutrient solution. Organic nutrient solution was made from fish meal, rock phosphate, and potash. Plants grown at high levels of nutrients performed much better than organic or low level nutrients, especially Bok Choy plants. However, organic lettuce can be sold at higher prices, and high level nutrients cost 4 x more than the low level and organic nutrients. Values are expressed as mean wet weight ± standard deviation (SD). There was significant difference within treatment for each either Bok Choi, Butter head or Nevada lettuce (P < 0.05).
Int. J. Agr. Ext. 02(03) 2014. 227-234
800.0 700.0
Weight, g ± SD
600.0 500.0 400.0 300.0 200.0 100.0 0.0
Mean, g
HIGH
HIGH ORGANIC LOW Butterhea Butterhea Butterhea Bok Choy Bok Choy Bok Choy d d d 619.1
ORGANIC
239.8
LOW
384.7
150.9
73.8
131.3
HIGH
ORGANIC
LOW
Nevada
Nevada
Nevada
197.1
96.2
133.1
Figure 5. Production cycle 2. Table 2. Yield and returns for vegetables produced in the second production cycle in hydroponic float culture. Leafy Green Plants, N Mean Weight/plant, lb Total Weight, lb Price/lb Total Crop Value Bok Choy High 60 1.37 82 $1.50 $123 Organic 60 0.53 32 $1.95 $62 Low 60 0.85 51 $1.50 $77 Sub Total 180 165 $262 Butterhead High 60 0.33 20 $4.00 $80 Organic 60 0.16 10 $5.20 $52 Low 60 0.29 17 $4.00 $68 Sub Total 180 47 $200 Nevada Summer Crisp High Organic Low Sub Total Total
45 45 45 135 495
0.43 0.21 0.29
An additional 2-3 weeks prior to harvest, the next set of vegetables can be sown into rock wool in propagation trays in order to decrease production times. After harvest, systems should be cleaned, sanitized if necessary, and prepared for another production cycle. Sanitation can be achieved through manually exposing the trays to a bleach solution, or by making a bleach solution in the barrels and allowing the solution to flow in the trays (Wheeler, 2010; Ciju, 2012; Resh, 2013). The organic nutrient solution was problematic, and the rock phosphate in particular was insoluble and
231
19 9 13 41 253
$4.00 $5.20 $4.00
$76 $47 $52 $175 $637
mineralization of phosphate was low. In future experiments, we are working with dissolving the rock in strong acid, or trying to promote faster mineralization by adding microbial sources and phosphatase enzymes to the nutrient solution preparation. Costs and Returns: Our overall evaluation of costs, both fixed and variable is listed in Table 3. Each round of production yielded 180 Bok Choy plants, 180 butterhead lettuce plants, and 135 Nevada summer crisp lettuce plants. All plants were very high quality and were easily sold without much post-production
Int. J. Agr. Ext. 02(03) 2014. 227-234 processing. With optimized conditions and a reliable market, each production cycle could yield a crop value of around $600. The plant type and growing conditions can be optimized for cost efficiency and marketability, and additional plants could be grown in additional trays or beds in order to increase greenhouse space utilization. A crop of vegetables can be produced every 5-6 weeks during peak production cycles in which sufficient lighting is available. There are other aspects of vegetable production that may be influenced by aqueous media and other treatments. Other nutritional components, such as
flavonoids, ascorbic acid (vitamin C), and tocopherols (vitamin E) are influenced by nutritional status of the plant, the light environment, and other environmental stresses (Ehret et al., 2013; Pauliz and Belanger, 2001;Kimura and Rodriguez-Amaya, 2003; Buchanan and Omaye, 2013 ). Data on taste, flavor, and appearance also should be collected so we can continue to generate standard operating procedures for efficient, small scale, marketable vegetable products (Arias, et al., 2000; Bourn and Prescott, 2002; Zhao, et al., 2007; Auvray and Spence, 2008; Gichuhi et al., 2009; Murphy et al., 2011).
Table 3. Fixed and Variable Costs for Leafy Green Production. *Fixed Costs: Item N Price White propagation trays, 4’x8’ 9 $250 Plumbing supplies Misc $200 Foam for floatation 9 $8.50 Reservoir barrels for nutrient solution 3 $40 Air pump and stones 3 $25 Water pump 3 $75 Electric cords and power strips Misc $60 Total **Variable Costs: Item N Price Nutrients 5 liters $4.20/liter pH adjuster 0.300 liter $8.20/liter Rock wool slab 1 slab $35 Bok choy seeds 1 packet $3.95 Nevada crisp lettuce seeds 1 packet $3.95 Electricity 100.8 kWh $0.118 Water 1300 gal Heat Unknown Total *Cost of propagation trays could be reduced by using wood and pond liner. Plumbing includes all tubing, and bulkheads. Foam floatation is 4’ x 8’ x ¾’ rigid insulation. **For nutrient solutions, three sources were used (Flora Series, General Hydroponic Nutrients. Electricity, total power used from water pumps was 72 walls and from air pumps was 20 watts for about 100 walls total, running continuously. In Northern Nevada, electricity is about $0.118 per kWhr. 100! X 24h/day x 42 days/ 100 W/kWh time $0.118 = $11.93. Water: Each 3 tray system contains approximately 400 gallons. Water usage from the system was minimal- only 40-50 gallons per tray for an entire production cycle. Heat: The greenhouse was heated, but costs were unknown. Heat can be a significant amount of
232
Sub Total $2,250 $200 $76.50 $120 $75 $225 $70 $3,006.50 Sub total $30 $2.50 $35.00 $3.95 $3.95 $11.93
$95.28 fitting, PVC, poly
money, but efficiency can be improved with insulation. Acid and base adjustments: About 300 ml total of acid or base. $31 each for a gallon of up/down. = $2.50. Rockwool: One slab was used per round of plants. $35 each. Seeds: Were purchased from Johnny’s select seeds. $7:95 per packet of Butter head, $3.95 per packet of Bok Choy and Nevada Summer Crisp Lettuce. CONCLUSION The continuous flow system allows refreshing of the nutrient solution at the root rapidly, allowing rapid uptake of nutrients without a large investment in root
Int. J. Agr. Ext. 02(03) 2014. 227-234 biomass. Continuous flow systems allow lower levels of nutrients to be used with decreases costs and waste. More research must be done on the organic nutrient solution regarding composition and optimization. The organic nutrient solution was problematic, and the rock phosphate in particular was insoluble and mineralization of phosphate was low. In future experiments, we will be woking with dissolving the rock in strong acid, or trying to promote faster mineralization by adding microbial sources and phosphatase to the nutrient solution preparation. The goal of the organic nutrient work should be able to standardize methods, additions, and outcomes of organic nutrient solutions for the small-scale organic farmer. In order to insure consumer confidence organic, foods must be safe and as healthy as conventional alternatives. With proper nutrient solutions, temperatures, and other environmental conditions, hydroponic agriculture can yield high quality, efficiently produced vegetables for urban and rural farms, and perhaps for exploration beyond tera fera in the future. KNOWLEDGEMENTS Special thanks to Eric Horton for technical assistance, the High Desert Farm Initiative for providing seeds and materials and to Fan Zhang for statistical assistance. Also, we wish to acknowledge the Nevada Agriculture Experimental Stations for partial financial support, HATCH #0745, and funds from sale of the vegetables were used to further support hydroponic research at the University of Nevada, Reno and to support the High Desert Farming Initiative. REFERENCES Auvray, M. & Spence, C. (2008). The multisensory perception of flavor. Consciousness and Cognition. 17(3), 1016-1031. Arias, R., Lee, T-C, Specca, D. & Janes, H. (2000). Quality comparison of hydroponic tomatoes (Lycopersicon escuentum) ripened on and off vine. J Food Sci. 65 (3), 545-548. Bourn, D. & Prescott, J. (2002). A comparison of the nutritional value, sensory qualities, and food safety of organically and conventionally produced foods. Crit Rev Food Sci & Nutr 42(1), 1-34. Buchanan, D.N. & Omaye, S.T. (2013). Comparative study of ascorbic acid and tocopherol concentrations in hydroponic- and soil-grown lettuces. Food and Nutrition Sciences, 4(1), 1047-1053.
233
Ciju, R.J. (2012). Advanced Hydroponics Technologies for Growing Fruits and Vegetables. Agrihortico Press. Curtis, K.R., & Cowee, M.W. (2011). Buying local: Diverging consumer motivations and Concerns. Journal of Agribusiness 29(1), 1-22. Curtis, K.R., Gumirakiza, J.D. & Bosworth, R. (2014). Consumer preferences and willingness to pay for multi-labeled produce at farmers’ markets. J. Food Distribution Research 45 (1), 1-7. Dorais, M., Ehret, D.L., & Papadopoulos, A. P. (2008). Tomato (Solanum lycopersicum) health components: from seed to the consumer. Phytochem Rev, 7(1) 131‐250. Dubick, M.A. & Omaye, S.T. (2001). Evidence for grape, wine and tea polyphenols as modulators of arteriosclerosis and ischemic heart disease in humans. Nutraceuticals, Functional & Medical Foods. 3 (3), 67‐93. Ehret, D.L., Usher, K., Helmer, T., Block, G., Steinke, D., Frey, B., Kuang, T., & Diarra, M. (2013). Tomato fruit antioxidants in realtion to salinity and greenhouse climate. J Agric Food Chem. 61(1), 1138-1145. Feri, R., Wheeler, R., Levine, H.G. & Paul, AL. (2002). Plants in space. Current Opinon in Plant Biol. 5 (1) 258-263. Floros, J.D., Newsome, R., Risher, W., Barbosa-Canovas, R., Chen, H., Dunne, C. P., German, J. B., Hall, R.L., Heldman, D.R., Karwe, M.V., Knabel, S. J., Labuza, T. P., Lund, D. B., Newell-McGloughlin, M., Robinson, J.L., Sebrannek, J.G., Shewfelt, R.L., Tracy, W.F., Weaer, C.M., & Ziegler, G.R. (2010). Feeding the world today and tomorrow: The importance of food science and technology. Comprehensive Reviews in Food Science and Food Safety. 9(1), 572-599. Giovannucci, E. (2002). A review of epidemiologic studies of tomatoes, lycopene, and prostate cancer. Exp Biol Med. 227(1), 852‐859. Gichuhi, P.N., Mortley, D., Bromfield, E. & BovellBenjamin, A.C. Nutritonal, physical and sensory evaluation of ydroponic carrots (Daucus carota L.) from different nutrient delivery systems. J Food Sci 74 (9), S403-S412. Kimura, M., & Rodriguez-Amaya, D.B. (2003). Garotenoid composition of hydroponic leafy vegetables. J Agri Food Chem 51(9), 2603-2607.
Int. J. Agr. Ext. 02(03) 2014. 227-234 Mayne, S.T. (1996). Beta‐carotene, carotenoids and disease prevention in humans. FASEB J. 10 (7), 690‐701. Monje, O. Stutte, G. W., Goins, G. D., Porterfield, D.M. & Bingham, G.E. (2003). Farming in space: Environmental and biophysical concerns. Adv Space Res 31(1), 151-167. Murphy, M. T., Zhang, F., Nakamura, Y. K., & Omaye, S. T. (2011). Comparison between hydroponically and conventionally and organically grown lettuces for taste, odor, visual quality and texture: A pilot study. Food and Nutrition Sciences 2 (1), 124-127. Omaye, S.T., & Zhang, P. (1996). Phytochemical interactions: beta‐carotene, tocopherol and ascorbic acid. In: Phytochemicals: A New Paradigm. W. R. Bidlack, S. T. Omaye, M. S. Meskin, and D. Jahner, Eds., Technomic Publishing Co., pp 53‐76 . Paulitz, T.C. & Belanger, R.R. (2001). Biological control in greenhouse systems. Annu Rev Phytopathol 39 (1), 103-133. Resh, H.M. (2013). “Hydroponic Food Production”. CRC Press.
234
Smith-Spangler, C., Brandeau, M.L., Hunter, G.E., Bavinger, J.C., Pearson, M., Eschbach, P.J., Sundaram, V., Liu, H., Schirmer, P., Stave, C., Olkin, I., & Bravata, D.M. (2012). Are organic foods safer or healthier than conventional alternatives: Anns Internal Med 157 (5), 348-366. USDA, Companies that meet USDA GAP & GHP acceptance criteria. http://apps.ams.usda.gov/ReportServer05_69/Pa ges/ReportViewer.aspx?%2fGAP-GHP%2fG05++By+Location+++Auditees+that+Meet+Acceptance+Criteria&rs:Co mmand=Render Wheeler, R (2010). Plants for Human Life Support in Space: From Myers to Mars. Gravitational and Space Biology, 23: 25-35. Zhao, X., Chambers IV, E., Matta, Z., Loughin, T. M., & Carey, E. E. (2007). Consumer sensory analysis of organically and conventionally grown vegetables. J. Food Science 72 (2) S87-S91.