3.8 Contour-plot comparison of Experiments 4 and 6 modeled with the average k- value, and with ...... asterix (*). Gas and solution flow rates are both volumetric. Hydrostatic ...... Applications of controlled-flow laser-polarized xenon gas to ...
AN ABSTRACT OF THE THESIS OF
Laila Belkov Parker for the degree of Master of Science in Water Resource Engineering presented on December 9, 2004.
Title: Observations of Gas Flow in Porous Media using the Light Transmission Technique.
C
Abstract approved:
Signature redacted for privacy.
£jfl_
Selker
A novel technique was developed for studying gas phase flow in unsaturated
porous media. Carbon dioxide was pumped through a back-lit chamber packed with translucent sand which was variably saturated with water containing the pH indicator
dye methyl red. As the carbon dioxide dissolved in the pore water, lowering the pH and changing the dye color, a CCD camera captured images of the resultant changes
in transmitted light. These digital image files were then processed using a series of calibrated steps to relate light intensity to dye attenuation, dye attenuation to solution pH, and solution pH to aqueous and gaseous carbon dioxide concentration. The final product was a series of false-color images showing the development of the gaseous
carbon dioxide plume. Mass balance analysis of these images demonstrated several instances in which this method does not accurately predict carbon dioxide concentration due to, among other factors, sorption of the methyl red dye to the sand
and changes in optical properties between sand textures. However, the technique does afford the researcher an opportunity to observe carbon dioxide flow in response
to textural and liquid heterogeneities. With refinement, this technique may prove to be a useful tool in studying the complexities of gas phase phase transport. transport.
Observations of Gas Flow in Porous Media using the Light Transmission Technique
by Laila Belkov Parker
A THESIS
submitted to
Oregon State University
in partial fulfillment of the requirements for the
degree of
Master of Science
Presented December 9, 2004 Commencement June 2005
Master of Science thesis of Laila Belkov Parker presented on December 9, 2004.
APPROVED:
Signature redacted for privacy. Major
rFësenting rWsenting Water Resource Engineering
Signature redacted for privacy. Dire' or of Dir7f'r c'\\tcf1sources Graduate Program esources Graduate Program
Signature redacted for privacy. Dean of of 14ië"Waduate thLGr'aduate School School
I understand that my thesis will become part of the permanent collection of Oregon State University libraries. My signature below authorizes release of my thesis to any reader upon request.
/
Signature redacted for privacy. 1'
-
Laila Belkov Parker, Author
ACKNOWLEDGEMENTS
I would like to thank my advisor, John Selker, for his enthusiasm and encouragement, Rockie Yarwood for being my mentor in everything related to the light transmission system, and Erika Kraft and David Rupp for assistance with
methods development. Many thanks to my family and to Justin Brant for their love and support.
TABLE OF CONTENTS Page
iNTRODUCTION
1
1.1 Gas-phase flow dynamics in the unsaturated zone
1
1.2 Observing gas flow
33
METHODS
5
2.1 Light transmission technique
5
2.2 Use of dyes as tracers and indicators
8
2.3 Theory 2.3.1 Water content 2.3.2 Pixel intensity-dye attenuation 2.3.3 Percent transmittance-solution pH 2.3.4 Solution pH-carbon dioxide concentrations
9 11 11
12
14
2.4 Carbon dioxide tracing experiments
17
2.5 Sorption experiment
20
2.6 Image processing 2.6.1 Data collection 2.6.2 Pre-processing 2.6.3 Water content 2.6.4 Dye attenuation calibration 2.6.5 Image manipulation techniques 2.6.6 Mass balances & contour plots
20
RESULTS & DISCUSSION
27
3.1 Percent-transmittance-pH model
27
3.2 Carbon dioxide images
27
3.3 Dye sorption
35
3.4 Coarse inclusions
40
3.5 Hydrostatic experiments
44
CONCLUSIONS
49
BIBLIOGRAPHY
51
21 21 21
22 25 25
LIST OF FIGURES
Figure
Page
2.2 Diagram of image processing steps used to transform arrays of pixel intensity into arrays of carbon dioxide concentration.
10
2.3 Standard curve relates pH of 0.005% methyl red solution to its percent
transmittance at 520nm. 520nm
15
2.4 Water content images.
23
2.5. Comparison of all calibrated k-values.
24
2.6 Effect Effectofofimage imagesmoothing smoothing on on contour contour images.
26
3.1 False color images portray 3 different plumes of [CO2]g at 30 minutes after the initiation of gas sparging.
29
3.2 False color images portray the development of a plume of [CO2]g at six time
3.3
points after the initiation of gas sparging.
30
Fit of predicted mass to injected mass
33
3.4 Increases in plume size in successive experiments with identical flow rates
.37 37
3.5 Increases in predicted mass with successive hydrodynamic experiments
39
3.6 3.6 Estimates Estimatesofofcarbon carbondioxide dioxideconcentrations concentrations in in the the coarse coarse inclusions
42
3.7 Differences in computed carbon dioxide plumes between two homogeneous hydrostatic experiments with a gas flow rate of 280 mL/h.
45
3.8 Contour-plot comparison of Experiments 4 and 6 modeled with the average kvalue, and with individual k-values.
47
3.9 Effect of using averaged or individual dye attenuation coefficients (k) on predicted masses of carbon dioxide
48
Observations of Gas Flow in Porous Media using the Light Transmission Technique
1. INTRODUCTION A greater understanding of gas transport in the unsaturated zone is important
for informed environmental protection protection and and planning. planning Advances in this area could aid in monitoring the movement of gas-phase plumes of spilled petroleum products and
industrial solvents as they migrate towards the water table. In addition, better predictions of the dispersal of gases in the unsaturated zone could improve the efficiency of treating contaminated sites through introduction of oxygen and other
bio-stimulating gases. Apart from issues of contamination, other environmental challenges, such as efforts to describe sources and sinks in the global carbon cycle,
would be aided by greater knowledge of soil-gas flow. However, gaseous phase transport in the unsaturated zone is so highly complex and variable that we have yet
to fully describe this process. As a result, there is a need for new experimental methods to study gas-phase dynamics. This thesis describes just such a novel system, which uses a pH indicator dye and a light transmission system to observe the movement of carbon dioxide.
1.1 Gas-phase flow dynamics in the unsaturated zone Understanding the factors which control gaseous transport is essential to
monitoring and remediation strategies at contaminated sites. A variety of spilled or improperly stored contaminants easily volatilize upon entering the vadose zone, such as chlorinated solvents and liquid hydrocarbon components (Kim et al., 2001; Laor et
al., 2003). These contaminants are commonly spilled at gas stations and industrial sites. Another source of hazardous gases to the unsaturated zone are municipal landfills, in which large quantities of methane and carbon dioxide are produced by microbial breakdown of organic matter (Nastev et al., 2001; Williams et al., 1999). Gas phase contaminants often approach the water table at a faster rate than their
liquid phase counterparts (Altevogt (Altevogt et et aL, al., 2003), yet as as their their movement movement is is not not as as
predictable, they may be more difficult to monitor and treat. Some sites are amenable to remediation by forcing of gases through polluted
unsaturated zones, referred to as soil-vapor extraction (SVE). SVE employs volatilization of contaminants and mobilization of the gas phase, which can then be captured above ground, while bioventing systems involve gaseous stimulation of unsaturated zone microbial degradation of contaminants (Rathfelder et al., 2000). Bioventing may involve oxygen introductions to create aerobic conditions (Lee and Swindoll, 1993), or gas-phase nitrogen and phosphorus additions to alleviate nutrient
limitations on biodegradation (Bogan et al., 2001; Palumbo et al., 1995). In order for such remediation strategies to be successful, it is important to be able to quantify the potential for retention and retardation of both contaminants and introduced gases. This study was initially designed as a component of laboratory experimentation with nutrient biostimulation, and was aimed partially at understanding the effects of physical parameters on gas flow within the experimental
system. Various properties of the soil environment can affect the transport of gases, such as soil texture, soil water content, air temperature, relative humidity, rainfall
events, and rate of gas production or introduction. Of these, we examined gas introduction rates, textural heterogeneity, and water content and movement, each of
which have significant impacts on gaseous transport. For example, retention of many volatile organic compounds is controlled by partitioning at gas-water interfaces in the unsaturated zone (Brusseau et al., 1997; Costanza and Brusseau, 2000; Kim et aL, al., 2001; Lee and Swindoll, 1993); this is true of our model gas, carbon dioxide (Affek et
al., 1998; Ouyang and Zheng, 2000). Variations in porosity or fluid saturation can occlude contaminants during bioventing (Popovicova and Brusseau, 1998; Rathfelder et al., 2000) or create variability in transport rates (Laor et al., 2003; Williams et al., 1999). Flow rates during bioventing bioventing must must be be carefully carefully chosen chosen in in order orderto toprovide provide adequate microbial stimulation without contaminant mobilization (Rathfelder et al., 2000).
Although the majority of research on gas-phase transport in the unsaturated zone deals with contamination, there are other important applications of such work,
3
such as a greater understanding of the carbon cycling involved in climate change. The rise of atmospheric carbon dioxide in recent decades, with myriad implications for climate change, has prompted research into soil carbon cycling (Post et al., 1990; Schimel, 1995; Schlesinger, 1997). 1997). Although Although much much of of this this research researchexamines examines biological activity, understanding carbon dioxide transport is essential to completing
the picture (Simunek and Suarez, 1993). Physical parameters, such as soil water content and textural properties, control the rate at which microbially-produced carbon dioxide is released to the atmosphere (Nastev et al., 2001; Ouyang and Zheng, 2000). In one study, the capillary fringe of a deep aquifer was shown to act as a temporary sink of carbon dioxide, with an estimated transport time of four years (Affek et al., 1998).
1.2 Observin2 gas flow Efforts to elucidate the nature of gas-phase dynamics are often invasive, as
they may involve, for example, insertion of gas sensors or extraction of gas samples. These experiments may alter subsurface concentrations and distributions, or employ limited point samples which do not allow detailed descriptions of responses to
heterogeneity. Although recent work has improved upon past tecimiques by using dense sampling ports (Mihopoulos et al., 2002) or passive samplers (Laor et al., 2003), methods which yield more complete data sets are still needed. Real-time, non-invasive, in situ, high-resolution visualization would complement existing methods of studying gas-phase flow dynamics by enabling the
researcher to actually observe transport phenomena. Such observations have been made using nuclear magnetic resonance (NMR) micro-imaging tecimiques, in which gas flow through porous media is visualized using polarized gases (Xe, He, fluoroand hydrocarbons) over scales of millimeters and milliseconds (Codd and Altobelli,
2003; Kaiser et al., 2001; Koptyug et al., 2003; Mair et al., 2003). Using various techniques, researchers have been able to create spatial-velocity profiles (Kaiser et al., tecimiques,
2001) or images of "slices" through flowing gases (Kaiser et al., 2000). The spatial resolution yielded by pulse-field gradient NIMR tecimiques allows for extremely
precise quantification of effective diffusion values and aerodynamic dispersion coefficients (Koptyug et al., 2002). 2002). The applicability of these results to environmental systems is limited by the
scale dependence of soil physical properties. While diffusion dominates at the millimeter scale, the impact of dispersion increases with length scale. Soils which are heterogeneous on the centimeter or meter scale may appear homogenous on the
millimeter scale. Systems at scales sufficient to observe the effects of liquid and textural heterogeneity on flow may be more applicable to understanding gas
movement in soil systems. Larger-scale light transmission systems have been used in the past to make non-invasive, in situ observations of various unsaturated zone processes, including colloid transport, non-aqueous phase liquid (NAPL) flow, and interactions between microbial colonization and water flow (Schroth et al., 1998:
Weisbrod et al., 2003; Yarwood et al., 2002). The adaptation of such systems to image moving gases would represent an important advance in the tools available to study the highly variable nature of gas flow in unsaturated systems.
The objectives of this study were to develop such a system, in which aa pH pH indicator dye could be used to trace carbon dioxide in a light transmission chamber. Ideally, the colorimetric effects of carbon dioxide solubilization on pH could be quantified to produce a visual time-sequence of in situ gas flow. If these efforts proved successful, we hoped in addition to learn something about gas transport under varied environmental conditions.
2. METHODS
This thesis describes the development of a method to observe gas flow in
unsaturated porous media using non-invasive, real time, in-situ techniques. Carbon dioxide was injected into a chamber packed with silica sand which was variably
saturated with a methyl red dye solution. As the gas moved through the sand and dissolved in the dye solution, it caused solution pH to drop and the dye color to
change. A charge-coupled device (CCD) camera recorded sequential images of dye color, each actually an array of pixel intensities, which were then translated to carbon dioxide concentrations using calibrated relationships between frequency-specific light
absorption and carbon dioxide concentration. Expanding upon past work with light transmission systems, this method relies in particular on models developed to
calculate water content and dye concentration based on light intensity. This section describes method development, beginning with the background of the light transmission method and of the use of dyes to describe flow processes.
2.1 Li2ht transmission techniQue The use of light transmission to measure water content in porous media was first reported by Hoa (1981) and was expanded upon by Tidwell and Glass (1994). Light transmission chambers have been used in our laboratory to examine a wide
variety of problems related to flow in porous media. Schroth et al. (1998) observed the behavior of light non-aqueous phase liquid (LNAPL) flow over a capillary barrier, Weisbrod et al. (2002) studied colloidal transport, and Yarwood et al. (2002) and Rockhold et al. (2002) studied the interactions between microbial colonization and
hydrodynamics. Critical hydrodynamics Critical to to this this thesis thesis was was work work done by Niemet and Selker (2001), who developed a new method to determine liquid saturation of a porous media based on light transmission.
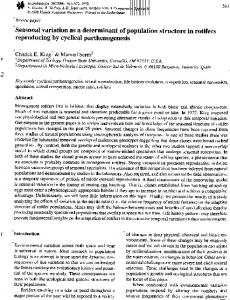
The basic system used in our laboratory consists of a chamber, light source,
and detector. The chamber (see Figure 2.1) was composed of two plate glass sheets,
each 51.0 51.0cm cm wide wide by by 61.0cm 61.0 cmtall tallby by1.3 1.3cm cm thick, thick, which which were were separated by a 1.0-
cm-thick U-shaped aluminum spacer and sealed with fluorocarbon rubber 0-ring stock (Viton; Dupont Dow Elastomers, Wilmington, Delaware). Two ports were drilled into the front glass sheet which allowed for placement of sparging stones for
gas addition and withdrawal. On the lower boundary of the chamber, an integral manifold covered with a sealed 10-jim-nominal-pore-size Twilled Dutch Weave stainless steel wire screen (Screen Technologies Group, Inc., Washougal, Washington), in conjunction with a drain port at the lower side of the aluminum
spacer, allowed for control of the liquid content of the chamber. In certain experiments, liquid solutions were added via an influent manifold at the top of the chamber containing eleven 23-gauge syringe needles spaced 4.1 cm apart.
cooling fan fluorescent light bank
acrylic sheet
light box
chamber frame __- thumbscrew light shield sand
spacer
-'
*
glass sheets
wire screen
" manifold
0-ring seals
Exploded
drain-port
Assembled
Figure 2.1 Diagram of the light transmission chamber system. The left "Exploded" image shows key components of the system, including the fluorescent light bank, glass sheets, and sand. The right-hand "Assembled" image shows the chamber as it appears when being used.
7
The chamber was clamped within an aluminum frame, which was then
mounted in front of a light bank often fluorescent tubes housed in a fan-ventilated sheet metal container. When assembled, the chamber's inner dimensions measured 45.5 cm wide by 47.3 cm high by 1 cm thick. The chamber was packed with a translucent, well-sorted silica sand (Accusand, Unimin, Le Sueur, MN), the properties of which are described in detail in Schroth et al. (1996). The 1 cm - thickness of the
chamber allowed for approximately 20 sand grains between the glass sheets. The detector was a liquid-cooled 16-bit, gray scale, 512 by 512 pixel CCD camera (Princeton Instruments, Trenton, New Jersey), used with a Nikon 35-mm, f- 1.4
aperture lens (Nikon Corporation, Tokyo, Japan). The distance of the camera to the chamber was about 2 m, such that each imaged pixel represents approximately 1 mm2 of chamber surface area.
One potential application of the light transmission system which has been relatively unexplored is the study of gas transport in unsaturated porous media. A few researchers have studied three-phase flow with light transmission systems and
estimated the volume and distribution of the air phase. For example, Kechavarzi et al. (2000) used an image analysis method to observe the movement of an LNAPL,
water, and air in a porous media. They used the optical density of digitized photographs of the system as a corollary for water and LNAPL saturation, and computed air content via subtraction, such that
Sa1SwSo
2.1
where Sa, S and S represent air, water and NAPL saturation, respectively. Darnault et al. (2002) measured oil and water content in a three phase light transmission
system based on calibration of hue and intensity to relative fluid content. Air content was again computed by subtraction. subtraction. Our goal in this work differed from that of Darnault et al. (2002) and Kechavarzi et al. (2000) in that we were interested not only in the presence of the gas phase, but in actually tracking the movement of a gas introduced into an unsaturated
system. Similarly to these authors, however, we used observations of the liquid phase of the system to draw conclusions about the gas phase.
2.2 Use of dyes as tracers and indicators This method represents a novel use of pH indicator dyes to track carbon dioxide in situ, a technique which up to this point has primarily been used in
organismal or food processing research rather than in soil systems. For example, in order to understand the relationship between accumulation of inorganic carbon and photosynthesis rate in a marine dinoflagellate, researchers used a fluorescent dye to track changes in pH caused by movement of carbon dioxide through cell walls
(Nimer et al., 1999). Optical sensors which use pH indicator dyes have been developed to detect carbon dioxide content in the bloodstream (Nakamura and Amao,
2003). While methyl red, the pH indicator dye employed in this research, has been used as a real time pH indicator to track the acidity of stored rice (Lii et al., 1999),
this may be the first time it has been used as an indicator for carbon dioxide. Methyl red was chosen for this work because its indicator range encompasses the pH range of
the carbon dioxide-water system. At neutral pH (no carbon dioxide), the dye is a yellow color similar to the color of the sand, and at low pH (high concentration of carbon dioxide), the dye's red color is easily detected by the camera. Dyes are frequently used as tracers to study water movement in soil (Flury
and Wai, 2003). In order to improve the quality of information gained from the monitoring of such experiments, many authors have used image analysis to map the spatial distribution of dye concentrations (Aeby et al., 1997; Forrer et al., 2000; Schincariol et al., 1993; Vanderborght et al., 2002; Wang et al., 2002; Yu and
Schwartz, 1999). These methods are usually calibrated against images taken of the dye-saturated media which was either prepared with a known concentration of dye (Aeby et al., 1997; Schincariol et al., 1993; Vanderborght et al., 2002; Wang et al., 2002; Yu and Schwartz, 1999), or was destructively sampled for dye concentration
after images were recorded (Forrer et al., 2000). These image analysis methods quantified dye concentration based on either absorbed light or dye fluorescence. Rockhold (2002) developed a method to quantify dye concentration based on
light transmission. He found it necessary to modify Beer's Law, which explains changes in transmitted light based on path length and an extinction coefficient, to
account for the non-linear effects of water content on attenuation. This equation was used to predict dye concentrations around a region of the chamber colonized by the
microbe Pseudomonasfluorescens HK44. In some areas, this model over-predicted dye concentration, which was thought to be due to sorption of the dye either to
biomass or to biomass-affected sand. Image analysis is often complicated by tracer sorption to soil, as noted by Flury and Wai (2003), who point out that most dyes do sorb, and warn that image analysis of dye patterns "must take into account the
mechanisms of sorption that occur during transport". The methyl red dye used in this research has exhibited an unstable spectrum when examined in solvents of varying polarity (Masoud and Hammud, 2001), which may indicate that if methyl red does sorb to the sand, its absorption spectrum could shift as a result (Flury and Wai, 2003). Given these potential constraints, we proceeded with the use of methyl red because of the suitability of its color and pH range to the carbon dioxide-water-sand system.
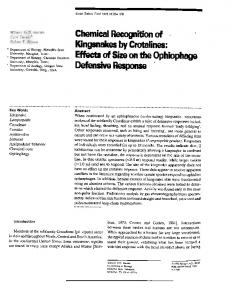
2.3 Theory Building on previous work with the light transmission chamber and with dyes, we were able to analyze the collected images of dye color to produce images of the
carbon dioxide plume. In order to do this, we needed to relate pixel intensity to carbon dioxide in a series of steps which are diagrammed in Figure 2.2, reviewed here
and detailed in the following text. The raw data was corrected for edge effects and bias signal contributions, and was then used to create an image of water content
following the method of Niemet and Selker (2001). Images of dye attenuation were then developed from the corrected data and water content images, using an adapted
Beer's Law relationship developed by Rockhold (2002). It was necessary to empirically develop a relationship between attenuation and pH of the methyl red
solution in order to create images of pH from the images of dye attenuation. These pH images were used to create images of liquid phase carbon dioxide concentration ([CO2]1), following basic equilibria equations, which were then transformed into
images of gaseous phase carbon dioxide concentration ([CO2]g) by Henry's Law.
10
Raw Data
2.6.2
Darkcorrected data
2.3.1
Water Content
2.3.2
2.3
Attenuation
N 2.3.3
pH
N 2.3.4
Aqueous concentration of carbon dioxide
N 2.3.4
Gaseous concentration concentration of carbon dioxide
Figure 2.2 Diagram of image processing steps used to transform arrays of pixel intensity into arrays of carbon dioxide concentration. Direction of processing is from top left to bottom right. Numbers by arrows refer to the section in which the process is described.
11
2.3.1 Water content Niemet and Selker (2001) developed a model to predict liquid saturation from
light transmission based on physical properties of the Accusands. The model considers the transmission of light through phase interfaces at varying degrees of
saturation as dependent on sequential draining of decreasing pore sizes. Water content of the chamber at a certain point in time is calculated as a function of light
transmission at the given time point, at saturation and at residual saturation. The method is calibrated to all four grades of sand used in the chamber.
2.3.2 Pixel intensity-dye attenuation The distribution of water content values throughout the chamber is an essential input to the pixel intensity - dye attenuation equation developed by
Rockhold (2002). Beer's Law,
I = Ie
2.2
,
explains the attenuation of light due to path length (x, thought to be proportional to water content in the chamber system) and an extinction coefficient (a, hereafter
referred to as dye attenuation). Beer's Law does not fully account for the transmission of light through variably-saturated packed sand, where the geometry of water placement and the correlated optical path of light cause water content to have a
non-linear effect on dye attenuation. Rockhold (2002) accounted for the optical characteristics of the chamber by adapting Beer's Law and calibrating to observed transmission
/ I'\ ln'/T / 'oj
.74
c= - 235.50042
2.3
Here C is dye concentration, 1110 is the ratio of the transmitted light with dye to
transmitted light without dye, and 0 is the volumetric water content. Constants in this equation were derived empirically using images of the chamber with regions of
known dye concentration. In order to apply the dye attenuation equation to this
12
research, in which we used methyl red instead of bromophenol blue, it was necessary
to modify certain constants of the equation. We expected that the constant in the denominator (k) would be dye-specific, while the transformation of water content and of the right-hand side of the equation might represent intrinsic characteristics of dye
attenuation in the light transmission system. This expectation was confirmed by a series of parameter-fitting attempts, as will be described in Section 2.6.4. Because we use the equation to calculate a dimensionless value for dye attenuation, instead of a dimensionless apparent relative dye concentration, we express the equation as k
r1
-1.35 -- 1.35
1212- O042l 9042 liii
-[
2.4
where a = attenuation due to dye, dye, II, pixel intensity of the first image before carbon dioxide addition, I = pixel intensity of the current image, and k is the dye-specific constant.
2.3.3 Percent transmittance-solution pH Dye attenuation is an indicator of solution pH. The red color of methyl red solution at low pH attenuates significantly more light than does the solution's yellow
color at neutral pH. In order to interpret changes in dye color with more precision, we created a standard curve relating the percent transmittance of methyl red to
solution pH. Stock solution was prepared of 0.005% volumetric methyl red powder (Matheson, Coleman and Bell, EM Science, Gibbstown, NJ) in deionized water with 10 M sodium hydroxide used to adjust solution pH. Calibration data were obtained using two different methods to create a range of samples spanning pH 3.9 - 7.2, the
range of the carbon dioxide-water system. Originally, samples were created using drop-wise additions of hydrochloric acid since these were easy to control and allowed
for reproducibility. In the interest of accurately representing the optical effects of the chamber system, sparged carbon dioxide was also used to adjust the pH of a separate series of samples.
In both cases, sample pH was measured with a pH meter (Orion Research, model
5A250). SA250). While we were able to recreate samples at a given pH by using the hydrochloric acid method, such reproducibility was more difficult when sparging
13
carbon dioxide; in addition the individual carbon dioxide-sparged samples showed slight temporal pH variability (average change of 0.02 pH units). Percent transmittance readings of each sample were taken using a spectrophotometer (Bausch & Lomb Spectronic 21) which was calibrated to 0% using a black composite occluder
and to 100% using distilled water. 3 mL of each pH sample was read for percent transmittance at 520 nm, a wavelength within the range of the filter used for carbon
The same dioxide tracing experiments. The same cylindrical cylindrical cuvette cuvette was used for each sample, and was rinsed between readings with solution from the upcoming sample. Data from three replicates of calibration with hydrochloric acid were averaged
for a total of 16 data points. The variation in the pH upon averaging was minimal, while the greatest variation in percent transmittance occurred around pH 5.2 where methyl red was undergoing the most abrupt color change (standard error value of
1.58). In contrast, data from the samples which were pH-adjusted with sparged carbon dioxide showed great variability, which may be in part due to the temporal pH variability of an individual sample. Because the data obtained from the hydrochloric acid calibrations were more consistent, they were used to fit a model to describe the relationship between percent
transmittance and pH. Other authors who have used pH indicator dyes for similar purposes have been able to log-transform the data, yielding an easily-used linear
relationship (Lii et al., 1999). However, our data did not exhibit the exponential relationship which would lend itself to a similar log transformation, instead taking the
form of an s-shaped curve. We fit the model to an equation of the form used by Van Genuchten (1980),
t=r+
sr (1+(ap)n)m
2.5
To solve for pH as a function of dye attenuation, it was necessary to relate
attenuation in the chamber to transmittance in the cuvette. This was done by using Beer's Law to account for the thickness of the cuvette, such that T = el14(2, T=
2.6
14
where a is the calculated attenuation value in the chamber (Equation 2.4), 1.14 is the
thickness in cm of the cuvette, and T is a fractional value of transmittance. The substitution was made and the equation was rearranged to solve for pH,
r(
sr
n
[1_e_114a l.j
1 - r1 r1 2.7
a a where a represents attenuation, attenuation, pp = pH, a, s, r and n are fitting parameters and
- ,j/.
m=1 1 - )-t,. Using Usingthe theleast leastsquares squares method method with with parameters parameters constrained as 0
1, 0
1, 0.9 0.9a >0.l,and n n>0,asolutionwas >0.1, and >0, a solution wasfoundwithparametersr found with parameters r
0.475, s = 1, a = 0.174, and n = 15.4. Model fit to data (R2
0.84) is shown in
Figure 2.3, with the series of transmittance vs. pH data collected using sparged carbon dioxide shown as scatter around the hydrochloric acid data and model curves. 2.3.4 Solution pH-carbon dioxide concentrations From a given pH we could calculate [CO2]1 based on equilibria equations.
When carbon dioxide is introduced to water it quickly hydrates to form H2CO3 (carbonic acid), which in turn almost completely ionizes to the three species HCO3
(bicarbonate ion), H (hydrated protons) and CO3 - (carbonate ion). We can determine the initial concentration of carbon dioxide (mol/L) from a given pH based
on the equilibrium chemistry of the system. These calculations are based on the assumption that the system is at at equilibrium. equilibrium.
15
8.00 7.50
7.00 -
0
6.50
0 0 D 0
6.00 -
0
0
Ac
0
5.50 HCIData HClData
5.00 -
4.50 4.00
3.50 -
0
Model
[]
0E:J
0
:
CO2triaIl o CO2triaI2 CO2trial2 o CO2triaI3 CO2trial3
1
o CO2fria4
o
CO2 trialS CO2triaIS
3.00
0.45
0.55
0.65
0.75
0.85
0.95
t
Figure 2.3 Standard curve relates pH of 0.005% methyl red solution to its percent transmittance at 520nm. Solid line represents model, filled circles represents data using HC1 to adjust pH, open points represent data from separate calibration experiments using carbon dioxide to adjust pH. t is a function of T, percent transmittance, where t = 1-T/100.
16
To check this assumption, we consider the carbon dioxide as a conservative non-reactive tracer and calculate how long it will take for the carbon dioxide-water system to equilibrate based on the standard form of the Gaussian distribution (Selker
etaL, et al., 1999):
CL(x,t)=
rn
exp
/ (x_ut)2" 2\ (x-ut)
2.8
4Dt
Oslir4Dt OsJir4Dt
Assuming that u, the water velocity, is zero, and given a diffusion coefficient D and a film thickness x, we can state that we should be at equilibrium at time t where
4Dt>x2.
2.9
Using a diffusion coefficient for carbon dioxide in water of 11.66 x lO 1 0 cm2/s cm2/s (Hillel, 1998), and assuming a film thickness of 0.01 cm, we can calculate that the
system would take 1.6 seconds to equilibrate, which is well within the 18-second intervals at which images were taken and calculations made.
We can then proceed, first to note that carbon dioxide will form carbonic acid, which will readily protonate, such that we can write =K[CO2]1. [H]1[Hco3-j, [H]1[Hco3-j,=K[CO2]1.
2.10
In these calculations we used the value of K at 25° C , K106381 (Butler, 1982;
Pankow, 1991; Selker et al., 1999). Because the system is electrically neutral, the positively and negatively charged species must be balanced, as such: [H
= [Hco3 [HCO3 -
+ 2[CO3
- j + [oH]1.
2.11
At At pH pH 7.5, 7.5, which whichcharacterizes characterizesour oursystem, system,the theconcentrations concentrations of of [Off] [OW]and and[CO3 [CO3 ]] become negligible (Butler, 1982), hence [H
= [Hco3[HCO3 ]..
2.12
Combining Equations 2.10 and 2.12 yields [H+]12=K[C01]1.
2.13
The definition of pH states that when [H] is in mol/L,
[Hj1=l0-. [Hj1=l0-'
.
2.14
17
Combining Equations 2.13 and 2.14 yields 1O.2PH 1O.2
[co2]1=
2.15
K
such that as the concentration of carbon dioxide increases, the pH decreases. carbon dioxide concentrations from Finally, in order to calculate gas-phase gas-phase carbon liquid phase carbon dioxide concentrations, we use Henry's Law which describes the solubilization of gases into liquid. For this work, we used the form KH [Co2 1 [Co2 Ig = [CO21g =KH[CO211
2.16
1982). (Butler, 1982). where concentrations of carbon dioxide are in mol/L, and KH 0.774 (Butler, Combining the relationships described in this and previous sections in the
enables us us to to translate translate pixel pixel intensity data into carbon manner outlined in Figure 2.2 enables and gaseous gaseous phases. phases. The next sections will dioxide concentrations of both liquid and describe how the data were actually collected and processed.
2.4 Carbon dioxide tracing experiments The light transmission chamber, described above, was packed with two different and 40/50 40/50 sieve sieve sizes) using three different geometries. In grades of Accusand (20/30 and
roughly half of the experiments, the entire chamber was packed homogeneously with 0.359mm). mm).In Inthe theother otherhalf half of the d50 =0.359 the fme 40/50 sand (particle diameter d50 40/5 0 experiments, a coarse inclusion was packed within the fine matrix by adding 40/50 and 20/30 sand (d50 = 0.713 mm) mm) in in increments increments to to achieve the desired geometry.
were used; a Two inclusion geometries were are from from Schroth Schroth et etal. al.(1996). (1996). Two Particle sizes are rectangular inclusion continuous across the width of the chamber, and a discontinuous, slightly sloped sloped trapezoidal trapezoidal inclusion. In total, the chamber was repacked 5 times; 3 times with a homogeneous pack of fine sand, and twice with a
heterogeneous pack of either a continuous or discontinuous inclusion of coarse sand within a fine sand matrix. The light bank behind the translucent sand was illuminated during carbon dioxide filling and and draining. draining. The CCD stages such as filling traces, as well as during preparatory stages 57561, camera, equipped with a 500 nm wideband filter (70 nm spread) (model # 57561,
18
One! Oriel Instruments, Newport Corp., Mountain View, California) was used to capture a series of pixel intensity images every 18 seconds during the carbon dioxide sparging. The spectral range of the filter was chosen to match the visible range of the methyl
red dye. For each experiment, images were also made of the saturated chamber, drainage stages and the drained chamber just before carbon dioxide was added.
Additionally, images were taken with the lens cap on ("dark" image). All of these images were taken with the same exposure time as was used to take the carbon
dioxide tracing images. In total, 19 trace experiments were conducted, however experiments 1, 2, 5, 77 and 9 were not analyzed due to experimental malfunctions. In
Experiments 1, 2 and 5, the upper manifold was not sealed, allowing gas to escape
In Experiment Experiment 7, a leak was noticed in the influent from the top of the chamber. In sparging stone port. In Experiment 9, condensation built up on the imaging chip of the camera due to high relative humidity in the laboratory; this significantly altered
captured images. Thus, a total of 14 experiments were analyzed. pH indicator dye was prepared in batches of 1-10 L of 0.005% volumetric methyl
red powder (Matheson, Coleman and Bell) in deionized water. 0.25 M potassium hydroxide was added as needed to adjust solution pH to 7. The packed system was purged with carbon dioxide to remove any residual air pockets, and then flushed with
distilled water followed by the 0.005% methyl red solution. Once saturated, the chamber was drained, via a siphon located 15 cm below the manifold screen, for 1-2 hours or until the saturated region at the bottom of the sand pack was approximately
12 cm thick. The volume and pH of liquid flushed were recorded. Sparging stones were installed for gas inlet and outlet. Carbon dioxide gas was sparged through water to ensure that it was at 100% relative humidity before it was pumped by a peristaltic pump into the left-hand sparging stone, with vapor being pulled out of the right-hand sparging stone at the same volumetric rate by a paired peristaltic pump head. Experiments were conducted under both hydrostatic and hydrodynamic
conditions. In the hydrostatic experiments, gas was introduced to the residually saturated chamber, which was covered with an aluminum lid to minimize escaped
gas. In hydrodynamic experiments, the lid was replaced by a manifold, and a multichannel pump was used to feed 0.005% methyl red solution to the chamber
19
through all eleven drippers of the manifold at an approximate rate of 170 mL/h. Relative humidity and temperature measurements of the laboratory in which the experiments were carried out were made throughout the course of every experiment. Features of each experiment, including flow rate, geometry, exposure time, and
experiment duration, are shown in Table 2.1. These experiments can be grouped into four categories by textural and flow attributes. These categories, which will be referred to in the Results Section, are homogeneous hydrostatic (fine-grain sand pack and no solution flow), homogeneous hydrodynamic (fine-grain sand pack and solution flow), heterogeneous hydrostatic (coarse-sand inclusion within a fine sand matrix and no solution flow), and heterogeneous hydrodynamic (coarse-sand inclusion within a fine sand matrix and solution flow).
Table Table 2.1 2.1 Features Features of of the the 19 19 carbon carbon dioxide dioxidetrace traceexperiments. experiments.Experiments Experiments which were not analyzed due to experimental malfunction are denoted by an asterix (*). Gas and solution flow rates are both volumetric. Hydrostatic experiments are those with a solution flow rate of 0 mL/h. Heterogeneous geometries are either continuous or discontinuous, based on coarse inclusion shape. As indicated by the sand pack numbers, the chamber was repacked with fresh sand before Experiments 1, 4, 6, 12 and 16. Experiment number
Gas flow rate (mL/h)
Solution flow rate (mL/h)
Inclusion geometry
1*,3 1*, 3
40
0
2*
110
4, 5*
Exposure time (seconds)
Sand pack
homogeneous
1
1
0
homogeneous
1
1
280
0
homogeneous
1
2
6, 7*
280
0
homogeneous
1
3
8, 9*, 10, 10, 11 8,9*,
160
160
homogeneous
1
3
12, 13
160
0
continuous
0.5
4
14
40
0
continuous
0.5
4
15
280
0
continuous
0.5
4
16
160
0
discontinuous
0.5
5
17, 18
160
160
discontinuous
0.5
5
19
40
160
discontinuous
0.5
5
20
2.5 Sorption experiment Unexpected behavior of the methyl red dye, including flocculation at low pH, suggested the necessity of an experiment examining potential sorption of methyl red
to the Accusand. Two buffered 0.005% methyl red solutions at pH 4 and 7 were prepared using standard buffer capsules (pHydrion buffer, Microessential Laboratory,
Brooklyn, NY). These pH values were chosen because they span the pH range of both methyl red and the carbon dioxide-water system. Using 50 mL of clean 40/50 Accusand and 50 mL of buffered solution, the following three treatments were established at pH 4 and 7 in 100 mL Pyrex jars: sand and methyl red solution; sand
and buffer solution; and methyl red solution only. Immediately following liquid addition, each jar was shaken vigorously for 20 seconds, at which point 3 mL of
liquid were drawn off and percent transmittance was read. In subsequent readings at 24 hours and 48 hours, after jars were shaken for 20 seconds, 4 mL of liquid was drawn off and centrifuged at 10,000 RPM for 10 minutes to eliminate potential
optical effects of suspended particulate matter from the sand. Samples were then read for percent transmittance, the results of which are shown in Section 3.3. 3.3.
2.6 Ima2e processing The theory described in Section 2.3 was implemented using image processing of the data images captured during the carbon dioxide trace experiments described in
Section 2.4. The pre-processing technique used to prepare the raw data files followed the method of Niemet and Selker (2001). These prepared frames were then converted through the multi-step process diagrammed in Figure 2.2 into images of carbon
dioxide plumes. These processing steps account for the contribution of water content to relative dye attenuation, and for the relationship between dye attenuation, pH, and
carbon dioxide content. Calculations were conducted on a pixel-by-pixel basis via macros written in Fortner Transform (Version 3.4, Fortner Software LLC).
21
2.6.1 Data collection Data images were captured by the camera with WinView software (Princeton
Instruments, Princeton, NJ). The data file for each experiment was composed of a series of frames taken at 18 second intervals, each consisting of an array of 512 by
512 pixels. Each frame was imported into Transform and saved as an individual file for advanced processing. Except for some elements of the calibration of the dye attenuation equation, all the processing described in this section was conducted in Transform.
2.6.2 Pre-processing Two image pre-processing steps accounted for pixel variability due to
background noise and edge effects. First, to remove signal contributions from the analog/digital converter, the thermal activity of the semiconductor, and any
background ambient light, a "dark" image was subtracted from every data image. In order to eliminate the chamber frame, which was included in original images, the edges of each pixel array were trimmed, yielding a 467 by 435 pixel array, representing 1,992 cm2 of sand surface area.
2.6.3 Water content Water content was calculated as by Niemet and Selker (2001), however the optics of these experiments differed from that work in that we used a wideband filter
and added methyl red dye to the water. Although re-calibrating the necessary equations to the optics of this system may have produced more accurate results, a significant gap of two years between the experimental work and the processing made
calibration impossible. impossible. As As Niemet Niemet and and Selker' Selker'ss (2001) verification of any such calibration equation with original parameters predicted physically plausible water content values
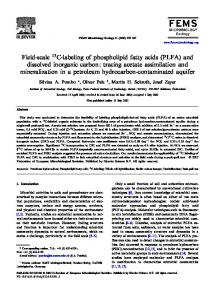
(see Figure 2.4), those parameters were used. One image of water content prior to carbon dioxide injection was produced for each experiment, using the dark, saturated
and unsaturated images collected during preparatory stages. Water content was assumed to be constant throughout each carbon dioxide trace experiment due to the humidification of the carbon dioxide gas prior to its introduction into the chamber.
22
Because the method is individually calibrated to four grades of Accusand, in the texturally heterogeneous experiments (12-19) water content was computed separately for the fine and coarse sands according to their individual parameters.
Water content images of homogeneous experiments displayed relatively dry sand in the majority of the chamber with a 10-15-cm-thick saturated capillary fringe
region at the base of the chamber. Liquid accumulation to a height of 2-3 cm above the inclusion was seen in the heterogeneous experiments with continuous inclusions
of coarse sand. To facilitate liquid movement through the chamber in subsequent hydrodynamic experiments, slightly slightly sloping, sloping, discontinuous discontinuous inclusions inclusions were were used. used. Of the four experiments conducted with the discontinuous inclusion, some water did accumulate on the inclusion in the three hydrodynamic experiments (Experiments 1719), but not in the hydrostatic experiment (Experiment 16). A sample water content image for each sand pack geometry (homogeneous, heterogeneous with discontinuous inclusion, heterogeneous with continuous inclusion) is shown in Figure 2.4, in addition to a profile of each image along a vertical cross section of the chamber.
2.6.4 Dye attenuation calibration In order to apply the dye attenuation equation, Equation 2.4, to the methyl red dye, it was necessary to calibrate the parameter k, based on an assumption of carbon
dioxide saturation (0.039 moIJL) around the inlet port in the final image (t34
minutes). Equation 2.4 was solved for the corresponding maximum alpha value, 5.9, (computed from Equations 2.7 and 2.15) using values for 1, To and 0 from 20 pixels
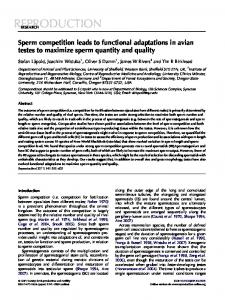
surrounding the inlet in images for every experiment. The optimal k-values for each experiment were found using the least-squares method, and are tabulated in Figure
2.5. The wide spread of k-values over the experiments may largely be a function of variation in the concentration of the methyl red dye, as will be discussed in Section
3.5. However, in the interest of developing a model which could be applied to a wide variety of conditions, we wished to find a single k-value to use for every every experiment. experiment. Thus, k-values were averaged over various groupings of experiments (such as all hydrodynamic experiments) and were used to compute carbon dioxide images, which were then evaluated using mass balances.
23
a 5
6 1
10
15-
15
2020
20
'
2530-
25
30-
35-
35
40-
40
45-45
45 0
5
10
O 35 15 20 15 20 25 30 35 40
0
5
10
15
(cm width (cml
20 25 30 35
-1
width (cm)
0-
U3
5
17
030
10-
0
15 E
20-
o. 0
25
025
020015F
3 3-
1c-
3
005
4a
4-
F
0
5
10 15 10 15 20 25 30 35
5
40
10
I
I
30
3 40 35 40 45 4
depth iepth (cm) (cnl)
widU (cm) widU cm)
000
I
IS 20 2
0.05
0 10
0.15
0.20
0.25
0.30 30
0.35
Volumetnc w3ter conrt
Figure 2.4 Water content images. Images are shown of Experiment 6 (homogeneous hydrostatic). Experiment 13 (heterogeneous hydrostatic), and Experiment 17 (heterogeneous hydrodynamic). An overlay is shown of vertical profiles along transects marked in each image, with profiles labeled by experiment number. Color bar indicates correspondence of volumetric water content to false falsc color of pixels. Tick marks represent depth and width in cm.
24
'Using this approach, we found that a k-value of k = -1.94, averaged over the two homogeneous experiments with the highest flow rate (280 mL/h), provided the
best overall fit to all 14 experiments. In these two experiments, the assumption of carbon dioxide saturation around the inlet port is strongest. While the volume of introduced gas is smaller than the available pore volume of the entire chamber, we do expect that the area around the inlet has been flushed with so many pore volumes of gas that it should be at saturation. At this stage, using Equations 2.4, 2.7, and 2. 15 in macros written in Transform, data images were transformed on a pixel-by-pixel basis to carbon dioxide concentrations. concentrations.
-1.50
3
4 6
-1.62 -2.04 -1.83
0.026 0.024 0.017
1
-1.83
13
-1.71
0.077
3
14
0.061
3
0.054 0.100
3
18
-2.77 -3.19 -3.13 -2.18 -2.15
19
-2.21
0.125
10
-2.09
11
-2.12
12
15 16 17
c
>
1
2
-2.18
00
0 0 K>
0.138 0.127 0.126 0.093
8
0
a,
1
-2.50 j -2.50
0 K>
-
-3.50
2
0.00
2
0.131
4 4
0.05
0.10
0.15
-1.50 a, c
>
3
4
0
watercontent
3
0.121
0
V
0
-2.50
0
-
-3.50
I
0
1
2
3
4
experiment type
Figure 2.5 Comparison of all calibrated k-values. Table shows compilation of kvalues by experiment number, average water content above the capillary fringe, and experiment type. Experiment type denotations are are as follows (from Section 2.4): =hydrostatichomogeneous, homogeneous,2=hydrodynamic 2hydrodynamic homogeneous, 3=hydrostatic 3=hydrostatic I1 =hydrostatic heterogeneous, and heterogeneous.Water Water content content and and experiment and 4=hydrodynamic 4hydrodynamic heterogeneous. type were two of several independent variables used to try to explain the variability in k-values. Notice that all hydrodynamic experiments had very similar k-values.
25
2.6.5 Image man manipulation ipulation techniques
In addition to the transformations described above, certain image processing techniques were used to improve the quality of the carbon dioxide trace images. These minimized the effects of external objects, such as gas feed lines and extraneous port holes; and smoothed pixel variability on contour lines and transects in certain
data presented here. Of these two treatments, the first had a real quantitative impact on the data, while both served to improve the visual presentation of the data. Although these experiments used only two port holes for gas injection and extraction, a total of 11 port holes had been drilled into the glass sheet used in the
front of the light transmission chamber. Each of these port holes showed up in the raw data images, as did the feed lines which carried carbon dioxide to and from the
chamber. This was problematic at the image processing level not only because these objects visually interfered with the carbon dioxide plume shape, but because the pixel intensity values of these objects artificially inflated calculated carbon dioxide masses. An average of neighboring pixel values was ass:igned to every pixel representing
these objects, which rarely made the shapes disappear entirely, but did minimize their influence on the mass balance.
For the purposes of presentation in this thesis, certain images were smoothed using an internal Transform function which averages every pixel with its eight
neighbors. This was done to minimize the noise in the water content transects shown
in Figure 2.4, and in the contour lines shown in Figure 3.8 of the Results. Without using such a smoothing technique, contour lines were confounded by the plume variability, rather than showing general trends (see Figure 2.6).
2.6.6 Mass balances & contour plots For every experiment, at three minute intervals the predicted mass of carbon
dioxide in the chamber was compared compared with with the the total totalmass mass added added to to the the system. system. Total Total added mass was calculated by multiplying time passed by flow rate. Predicted masses were calculated in both phases and then summed as follows. For the liquid phase images, at each time point every pixel's concentration value was multiplied by
the corresponding water content value. The resulting array contained a mass value at
26
each pixel, which were then summed to produce the lotal mass of liquid-phase carbon
dioxide at that time point. A similar process was repeated for the gaseous phase images, with concentration values being multiplied by available pore volumes at
corresponding pixels. Pore volumes were computed by subtracting known waler content at each pixel from porosity (ii
0.348). Porosity was calculated each time the
chamber was packed and was compared against published data for these sands (Schroth et al., 1996). The total predicted mass at a given time point was the sum of the total mass from images of the two phases at that time point.
The mass balances enabled us to examine the quantitative strength of this method, however since the core goal of this research was simply to visualize the carbon dioxide plume, we also created contour plots of the developing plume over time. Contour plots were used to visually trace gas plume boundaries over the course
of time. Data arrays were first smoothed with five passes as described above. Contour lines were drawn describmg an area in which concentrations were equal to or
greater than a certain value. Lines drawn at successive time intervals were overlain to create a picture of the moving boundary, while overlays of contour lines from different plumes at the same time point allowed comparison of plume dynamics.
10
0 02
a
20
a
0 30-
.,
.iI
0 Dl
-
40-
a 10
20
width cm
30
40
1) 10
20
40
width cm)
Figure 2.6 Effect of image smoothing on contour images. Panel a shows a contour image created from an image of gaseous carbon dioxide concentration in Experiment 4 at t=30 minutes, while the contour image in Panel b was made from a smoothed image of the same data. Contour intervals are at 0.01 mol/L, 0.02 mol/L, and 0.03 mol/L. Note that in the absence of smoothing, numerous contour lines are drawn to capture the high degree of pixel variability, whereas contour lines drawn from a smoothed image are fewer and more dishnct.
27
3. RESULTS & DISCUSSION
3.1 Percent-transmittance-pH model The percent transmittance-pH model of methyl red shown in Figure 2.3 was of an s-shape form, in contrast to the exponential relationship seen by Lii et al. (1999). Methyl red's transmission behavior appears to differ greatly between the 630 nm wavelength used in that work and and the the 520 520 nm wavelength used in ours (Masoud and Hammud, 2001), thus we should not expect that the percent transmittance-pH
relationships at the two wavelengths would be identical. However, the scatter of the carbon dioxide-sparged data in Figure 2.3 does allow the possibility of other curve shapes.
The shape of the transmittance-pH curve could have been affected by a number of factors. The properties of the hydrochloric acid-water-methyl red system could have differed from those of the carbon dioxide-water-methyl red system, yielding different percent transmittance transmittance values values at at aa given given pH. pH. The The data data points at the tail of the methyl red curve, which appear to curve backwards towards higher transmission values, may be affected by dye flocculation which was observed at low
pH and would cause increased transmission. Methyl red did not readily dissolve during preparation of stock solution, thus we used either sodium hydroxide or potassium hydroxide to increase the pH and aid the dissolution of the powder. However, the usefulness of this practice is questionable, given the flocculation which we observed during the preparation of the standard curve in samples at pH 4 or
below. This tendency of the dye to flocculate calls into question the accuracy of the projected curve at low pH. It is important to keep these considerations in mind when evaluating the model's prediction of carbon dioxide concentrations.
3.2 Carbon dioxide ima2es Analysis of the carbon dioxide pulse data produced a series of 120 plume images for both the gaseous and dissolved phases of every experiment. Because
28
gaseous concentrations were calculated linearly from dissolved concentrations by
Henry's Law, the images of the two phases appear identical, thus only only computed computed gas phase concentration distributions are shown. Examples of these false color images are shown in Figure 3.1.
While the subject of this paper is the development of the imaging method, and not analysis of the behavior of the carbon dioxide plume, a few points should be made
regarding our basic expectations. First, relatively slow gas flow rates were used in the trace experiments, such that a maximum of 154 mL of carbon dioxide was introduced to the chamber over the course of a 33-minute experiment conducted with
the highest gas flow rate of 280 mL/h. In contrast, the available pore space in the
sand-packed chamber is on the order of 500 mL mE Thus, we do not expect saturation of the entire chamber with carbon dioxide. Additionally, we made a simple calculation of the Peclet number to predict whether this system should be dispersion- or diffusion-dominated. We take the dimensionless Peclet number (Pe) as
Pe =
LU D
where L is the length over which the gas is traveling, U is the gas velocity, and D is
the diffusion coefficient. We use the length of 20 cm between the inlet and outlet ports as L and a diffusion coefficient D of 0.13 cm2/s of carbon dioxide in air-filled
pores (Hillel, 1998). From examination of carbon dioxide images, we find an average
gas velocity of 0.02 cmls. Using these numbers, we can calculate a Peclet number of Pe = 3.07, which is greater than, but rather close to, 1. This allows us to conclude that the system is most likely dominated by dispersion. Compiling all 120 images from an experiment into a short video clip allowed
us to observe every stage of the development of the plume. Instead of showing video clips in this thesis, a sequence of six images over the course of Experiment 6 are shown in Figure 3.2, which give snapshots of plume dynamics over time.
29
A
10
10
20
20-
o30 40-
40
10
20
30
40
width (cm)
10
20
30
40
width (cm)
12 U
10
20
D
0.005 0.D10 0015 0.020 0.025 0.030 (CO2, rnol/L
30
40
10
20 20
30
40
width (cn)
Figure 3.1 False color inages portray 3 different plumes of gaseous carbon dioxide at 30 minutes after the initiation of gas sparging. Images [mages are shown of Experiment 6 (homogeneous hydrostatic, gas flow rate of 280 2S0 mLIh); Experiment 8 (homogeneous hydrodynamic, gas and liquid flow rates of 160 mL/h) and Experiment 12 (heterogeneous hydrostatic, gas flow rate of 160 mL/h). False pixel colors represent concentration in mol]L as shown by the color bar. Bull's Bul1s eyes mark gas inlet n1et and outlet ports. Tick marks along along axes axes represent represent depth depth and and width width in in centimeters. centimeters.
30
Figure 3.2 False color images portray the development of a plume of gaseous carbon dioxide at six time points after the initiation of gas sparging. Images are shown of Experiment 6 (homogeneous hydrostatic, gas flow rate of 280 mL/h) at 3, 9, 15, 15. 21, 27 and 33 minutes. False pixel colors represent concentration in mol/L as shown by the color bar. Bull's eyes mark gas inlet and outlet ports. Tick marks along axes represent depth and width in centimeters.
31
5 5-
5
10 10-
10
15-
15 IS
20 20-
IE
C. C-
0
-c
20
E
25 25-
U
25
C.
30 30-
-
30
35 35-
35
40 40-
40
4.5 45-
45 5
10
15
20
25
30
35
40
45
5
10
15
20
25
30
35
40
45
35
40
45
35
40
45
width (uiii1
5-
5
1015
15
20
20
E
0
25i
-c
25
30
30
35
35
40
40
45
45 5
10
15
25
20
30
35
40
45
5
1() 10
15
20
25
30
w,dth cm,
width (cml 5
5
10
10
15
20
_-. E
20
25
-C
25
E C-
C-
30
30
35
35
40
40
45
45
5
10
15
20
25
30
35
40
45
5
10
15
20
width (c-n) widU' (cin)
25
30
dth crn)
0005 0010 0005 0.010 0015 0.015 0.020 0.020 0025 0025
0.030
gaseous crbCn crbori dLoxlde dioxide ccjricnti-atjon ccjncntratjon i-nol/L) i-fouL)
32
To test the accuracy of the model to predict carbon dioxide content, mass
balances calculations were made for every experiment. Mass balance analysis showed that the image processing technique was most accurate in producing images
of the homogeneous hydrostatic experiments. Data in Figure 3.2 compare the mass predicted from image analysis of a particular experiment with the mass which was
added to the chamber. Experiments are grouped by gas flow rate in order to standardize the x-axis in each graph. The graphs are essentially time series, as each data point represents data from a time point between 3 and 33 minutes. At later time points the added mass as graphed is actually greater than the mass in the chamber, given that gas was actively pumped out of the chamber through the outlet port. Data from experiments conducted with a gas flow rate of 40 mL/h (Figure 3.3a) show that only in Experiment 3 (conducted under homogeneous hydrostatic conditions) does the image analysis technique correctly reproduce the injected mass. The image analysis of Experiment 19 (run under heterogeneous hydrodynamic conditions) dramatically over-predicts masses with a percent error of 175% at the last
time point. Data from the image analysis of Experiment 14 (heterogeneous hydrostatic) significantly under-predict the known mass of injection. Figure 33.3b, .3b, showing showing data data from from experiments experiments where the gas flow rate was 160 mL/h, demonstrates that predicted masses for the hydrodynamic experiments are
significantly higher than the known mass at later time points. In contrast, all of the data from the heterogeneous hydrostatic experiments represent under-predictions of carbon dioxide concentrations. In Figure 3.3c, where the gas flow rate was 280 mL/h and all experiments are hydrostatic, the mass predictions for the homogeneous experiments, 4 and 6, are more accurate than is the prediction based on the image analysis of Experiment 15, which had a heterogeneous sand pack. The image analysis technique was less accurate in predicting carbon dioxide mass in hydrodynamic or heterogeneous experiments compared with homogeneous
hydrostatic experiments. The following sections will analyze these results in order to understand factors affecting the success of this technique.
33
Figure 3.3 Fit of predicted mass to injected mass. Experiments are grouped by gas injection rates. Data are shown from experiments where gas flow rates are are as as follows: follows: 40 mLIh mL/h (3.3a), 160 mL/h (3.3b), and 280 mLIh mL/h (3.3c). Data points points are at intervals of three minutes, from t3 minutes to to t33 t33 minutes. minutes. Solid Solid line line represents represents aahypothetical hypothetical perfect fit of predicted to known mass. The x-axis in every graph represents added carbon dioxide (mol), while the y-axis represents predicted carbon dioxide (mol). Filled symbols represent hydrodynamic experiments, open symbols represent heterogeneous hydrostatic experiments, and dashes represent homogeneous hydrostatic experiments.
34
0.003
0 E
0 0 U
0.002
Ex3 Ex14 Ex.14 A Ex.19 l(
0.001
1:1 Line
E
a.
added CO2 (mol)
0.010
b
0
E 0.008 0.008
g C,
'
0.006
*(
Ex.4
:
Ex. 6
Ex.15
0.004 0004
1:1 Line
0.002 0.000
A
.
0.000
AAA
0.002
0.004
0.006
0.008
0.0 10
added CO2 (mol)
.
Ex. 8
0.006C
.4. o O.004H C,
Ex.11 Ex. 12
.
o
./00 00
Ex. 13 o Ex16 o Ex.16
S
5 5 0.002 0.002 E 0.
Ex. 10
0
Ex. 17
Ex.18
---1:1 Line 0.000
0.002
0.004
added CO2 (mol)
Figure 3.3
0.006
35
33 Dye 3.3 Dye sorption sorption The applicability of the model to the hydrodynamic experiments was
hampered by the apparent tendency of methyl red to sorb to the silica sand. Data from the sorption experiment, conducted in response to unexpected plume shapes
seen in processed images, are shown in Table 3.1. Percent transmittance increased with time in samples with methyl red dye and sand, which is probably due to sorption
of methyl red to the sand. The change in percent transmittance was more pronounced in the samples with a lower pH, with an 18.6% increase in percent transmittance over 24 hours at pH 4 compared to a 4.3% increase over the same interval at pH 7. In the samples containing only methyl red, percent transmittance increased very slightly over the 24 hours at both pH levels (0.9% increase at pH 4, 0.8% increase at pH 7); these differences are too minor to signify the settling of particulate matter within the
solution. In contrast, percent transmittance decreased over time in the samples with sand and buffer buffer solution solution (8.0% (8.0% decrease decreaseatatpH pH4,4,0.8 0.8%%decrease decreaseat at pH pH 7). 7). This This final
trend suggests that the increases in percent transmittance of the samples with methyl red solution may be even greater than the original percent transmittance data indicates.
Table 3.1 Data from sorption experiments conducted at pH 4 and 7. Values in the first two rows represent percent transmittance after 24 and 48 hours of incubation, while values in the third row represent percent increase (positive numbers) or decrease (negative numbers) over the 24 hour period.
pH4
pH7
Sand & methyl red
Methyl red
Sand & buffer solution
Sand & methyl red
Methyl red
Sand & buffer solution
%t
24 h
45.2
34.9
92.7
58.7
51.5
98.2
%t
48 h
53.6
35.2
85.8
61.2
51.9
97.4
18.6
0.9
-7.4
4.3
0.8
-0.8
% change %
36
Observations of the chamber during hydrodynamic experiments also suggest
that methyl red had sorbed to the sand. Slightly pink sand was seen in the chamber in between hydrodynamic experiments just after carbon dioxide was flushed through the chamber to purge out trapped air, suggesting that methyl red dye particles remained in
the chamber after it had been drained from the previous experiment. In the images from all six hydrodynamic experiments, plumes had rounded tops and flat bottoms, with the pH change not even seen at the point of injection (Figure 3.4), suggesting both that dye was accumulating in the top portion of the chamber and that dye was
not arriving at the lower portion of the chamber. If incoming methyl red solution was sorbing to the sand, this might result in artificially high values for dye attenuation near the top of the chamber where the solution was introduced, and low attenuation values near the gas inlet where attenuation would be expected to be highest, as is seen in Figure 3.4.
A small plume to the bottom right of the outlet port can be seen in the image image
of Experiment 8 in Figure 3.8. This is the only location in the image where carbon dioxide is visible below the inlet and outlet ports. Understanding why carbon dioxide showed up in this location helps to understand the dynamics of the dye sorption in the
chamber. We have seen in dye calibration experiments (Section 3.1) that the methyl red dye tends to flocculate at low pH. Therefore, in the chamber, we should see more dye flocculation, and therefore more sorption, in areas where the carbon dioxide
plume has encountered the dye solution and lowered the pH. This mechanism leads to the extremely dense areas of high concentration seen in the images in Figure 3.4. At the same time, in areas which the carbon dioxide plume has not yet reached, there
should be less dye flocculation, flocculation, allowing allowing more more dye dye to to travel through the chamber. In the case of Experiment 8, it appears that low carbon dioxide concentrations on the right-hand side of the chamber left neutral-pH regions which facilitated the
movement of dye solution without sorption. The carbon dioxide seen at the bottom right of the outlet port is most likely visible only because sufficient dye solution was able to travel to its depth.
37
10
10
20-
20
()
30-
30-
40-
40-
10
20
30
40
width (cm)
20
30
40
wdth (cm)
11
10-
.
10
20O 0050010 0005 0 0100015 00150.020 0.0200.025 0.025(1.030 (1.030 (mol/L) ICO21 ICO21 (mcl/L)
40-
10
20
30
40
width (cm)
Figure 3.4 Increases in plume size size in in successive successive experiments experiments with with identical identicalflow flow rates. Images are shown of gaseous carbon dioxide concentration at t 33 minutes in Experiments 8, 10 and arid 11. 11. In In every every experiment, experiment, carbon carbon dioxide dioxide and and methyl methyl red red solution are each flowing at a rate of approximately 160 mL/h, Vertical arrows in the image of Expeninent Experiment 11 11 indicate indicate direction direction of of methyl methyl red red flow, flow, while while arrows at the left-hand inlet show potential directions of gas flow; these generalized flow paths apply to the other two images as well. Pixel colors indicate computed gaseous carbon dioxide concentration (molIL) (molIL) as as shown shown by by the the color color bar, bar, while while depth depthaiid and width width in in cm are indicated by tick marks.
38
Two separate sets of hydrodynamic experiments were conducted with a gas
flow rate of 160 mL/h; Experiments 8-11, and Experiments 17-18. As seen in Figure 3.5, within both sets data from each successive experiment increasingly overpredicted carbon dioxide, with a 16-20 % increase in predicted mass between experiments (this incorporates two 20% increases between Experiments 8 and 10, 10, to
account for the methyl red solution solution flow flow which which did did occur occur in in Experiment Experiment 9). An accumulation of methyl red in the sand pack over the course of the set of experiments could have yielded these consecutively higher predicted masses. The extremely high over-prediction seen in the analysis of Experiment 19 (see Figure 3.3), with a percent error of 175% after 33 minutes, most likely results from the comparison of data from images of significant dye accumulation with a very low actual mass (the gas flow rate in Experiment 19 was 40 mL/h).
It may be noted that computed computed values values are only higher than actual values for carbon dioxide masses at later time points, with predicted data points crossing the 1: 1:1 crossing the 1 line between 9 and 18 minutes into the experiment (See Figure 3.5). Because dye appears to be accumulating at the top of the chamber, the pore water around the gas
inlet probably has low dye concentrations. As a result, until carbon dioxide reaches the top of the chamber where methyl red concentrations are high, the predicted carbon dioxide concentrations are expected to be low.
39
A
a
A
0.006 -
0
Ex8 ExlO
o 0.004 C.) 0
A A
0
Exil 1:1 Line
.
A 0.002 -
0.000 0.000
0.002
0.004
0.006
added CO2 (mol)
0 0.004 -
Ex17 Ex18
C.)
0
1:1 Line 0.002
0.002
0.004
0.006
added CO2 (mol)
Figure 3.5 Increases in predicted mass with successive hydrodynamic experiments. Data are separated into two sets by sand pack, with Panel a showing homogeneous hydrodynamic experiments and Panel b showing the heterogeneous hydrodynarnic experiments. Successive experiments are indicated by increasingly dark colors. Volumetric flow rates for both carbon dioxide and methyl red solution are approximately 160 mL/h.
40
3.4 Coarse inclusions
Carbon dioxide was barely visible in the coarse sand inclusions of any of the eight experiments with a heterogeneous geometry (Experiments 12 - 19). In the heterogeneous hydrodynamic experiments, methyl red sorption to the sand at the top of the chamber probably minimized the chances that any carbon dioxide would be
visible in the lower half of the chamber. However, images from the hydrostatic experiments with inclusions show that carbon dioxide was indeed present on either
side of the inclusion (e.g. Figure 3.1, Experiment 12). Pixel values show only a slight effect of attenuation in the inclusions, which was evidently not large enough to create
a detectable difference in the carbon dioxide images. It appears that the optical properties of the coarse sand minimized the effects of dye attenuation. Inspection of the dye attenuation equation (Equation 2.4) suggests that water content had a smaller effect on light transmission through the coarse sand as compared to the fine sand. Just as Niemet and Selker (2001) calibrated the water content equation for every grade of sand, so too it would appear that it would be necessary to calibrate the dye
attenuation equation for every grade of sand. The calibration made for the 40/50 sand in this research relied on the assumption of carbon dioxide saturation at the gas inlet
port. While we could estimate carbon dioxide concentration within the inclusion based on known values of permeability for the Accusands, the accuracy of such an estimate is questionable.
Thus, it appears that this imaging method is not applicable to the coarse sand. We assume that images of the heterogeneous experiments would have correctly represented the mass of carbon dioxide had the carbon dioxide been visible in the
inclusion. In order to validate this assumption and ensure that the coarse inclusion could physically contain all of the "missing" carbon dioxide, we estimated the potential concentration of carbon dioxide inside the inclusion based on its volume. At each of 11 time points, the estimated volume of the inclusion containing carbon dioxide was calculated using the width of the plume at the top of the textural interface, the height of the inclusion, and the known thickness of the sand within the
chamber. A constant gaseous concentration was assumed, and total gas-phase carbon
41
dioxide inside the inclusion was calculated using available pore volumes computed from subtracting the average water content within the inclusion from porosity
(=0.348). Liquid-phase carbon dioxide concentrations were computed as a function of gas phase carbon dioxide concentrations using Henry's Law. The total estimated carbon dioxide in both phases was added to the predicted carbon dioxide from the entire image, and these sums were fitted to the known mass of carbon dioxide at each
time point by varying the initial assumed gaseous concentration. Using this method we could calculate a concentration of [CO2]g = 0.026 moL'L in the coarse sand for Experiments 12, 13, and 15, which had similar gas flow rates, and a lower concentration Of [CO2]g == 0.0 0.010 10 mol/L mol/L for for Experiment Experiment 14, 14, which which had a significantly
slower gas flow rate (40 mL/h). A comparison of these fitted data with the original predicted data are shown in Figure 3.6. It is important to remember when looking at these fitted data that they rely on a number of simplifying assumptions. We are not trying to show how much carbon dioxide was in the inclusion; instead we want to point out that carbon dioxide was in the inclusions, but did not show up due to a failure in the method.
Similar calculations were not made for the experiments with the continuous inclusion, since the irregularity of both the shape of the inclusion and the visible interface between the plume and the inclusion complicate any assumptions about the inclusion volume which might might contain contain carbon carbon dioxide. dioxide.
42
Figure 3.6 Estimates of carbon dioxide concentrations in the coarse inclusions. Open shapes represent predicted masses calculated from raw data; filled shapes represent predicted masses which incorporate fitted values for gaseous and liquid concentrations of carbon dioxide in the coarse sand inclusion. Data are shown from Experiments 12 and 13 (gas flow rate of 160 mL/h) mLIh) in 3. 3 .6a; 6a; Experiment 14 (gas flow rate of 40 mL/h) in 3.6b; and Experiment 15 (gas flow rate of 280 mL/h) mLIh) in 3.6c. Concentrations in the inclusions are as follows: for Experiments 12, 13 and 15, [CO2]g 0.026 mol/L and [CO2]1 =0.034 mol/L, while for Experiment 14, [CO2]E =0.01 mol/L and and [CO2]1 [CO2]1 =0.013 0.013 mol/L.
43
0.004 -
8 0
.
a
0 0.003 -
S
.AA
A Ex12 A Ex12-fitted
D 0.002 -
o Ex13
w
a
ôoo
Ex13-fitted
AA A
0.001
1:1 Line
0.000 0.000
0.002
0.00 1
0.003
0.004
added CO2 (mol/L)
0.0010
0.0008 0.0008
Ex14 c Ex14
0.0006 -
Ex14-Fitted
0.0004
0.0002 -
.
1:1 Line
.
0.0000 0.0000 0.0002 0.0004 0.0006 0.0008 0.0010
added CO2 (mol/L)
-J 0.006
C
0
8 0
Ex15 Ex15-fitted
0.004 -i
w
a
1:1 Line
0.002 -
w L.
0.000 0.000
0.002
0.004
0.006
added CO2 (mol/L)
Figure 3.6
44
3.5 Hydrostatic experiments
Flocculation of the methyl red dye at low pH caused the dye to sorb to the sand as the solution passed through the chamber in hydrodynamic experiments. However, dye flocculation may have more subtly affected the accuracy of other
experiments. A comparison of two replicate hydrostatic experiments suggests that the dye solution used in the two experiments differed slightly, yielding different
predictions of carbon dioxide mass. As dye solution for several experiments was mixed in a 10-L carboy, it is quite possible that the solution used for two sequential experiments could differ due to settling of the dye at the bottom of the carboy. The two experiments, Experiments 4 and 6, were both conducted under
homogeneous hydrostatic conditions with a gas flow rate of 280 mL/h. Upon first
inspection, the modeled plumes appear to differ greatly. The images shown in Figure Figure 3.7a and b show two plumes with roughly the same area but very different regions of
high concentration. Environmental conditions, including sand pack, water content, and room temperature, varied only slightly between the two experiments. The difference in temperature (Experiment 4: 20° C, Experiment 6: 22.2° C) probably
plays a minor role. While temperature affects the solubility of carbon dioxide, a change of 2.2°C is not substantial enough to cause the observed differences between
the model results for the two experiments. Water content was a factor of different sand packs, and differed slightly between the two experiments (Experiment 4: 0
0.027, Experiment Experiment 6: 6: 00 =0.0 =0.019). played a small role in the different 19). This may have played yields, given that transmitted light is a physical function both of water content and of dye attenuation (Equation 2.4).
More important may be the role of the methyl red dye solution. The images in Figure 3.7a and b were calculated using a dye attenuation coefficient, or k, which was averaged between two k-values calibrated against the two experiments (see Section
2.6.4). In contrast, the images in Figure 3.7 c and d were created using the individual k-value for each experiment. These images are more similar in appearance.
45
.
10
10
20
20 ci
30
-
40
30
40
b 10
20
30
10
40
11
II
20
30
10
20
20
E
.
40
3
.
40-
©
30
40
I
I
10
I
20
30
wdUi (cm)
40
10
D 20
30
40
width (cm)
0005 0010 0015 0020 0025 0030 [CO2] (mol/L)
Figure 3,7 Differences in computed carbon dioxide plumes between two homogeneous hydrostatic experiments with a gas flow rate of 280 niL/h. Panels a and b show the gas-phase plumes at t33 minutes of Experiments 4 and 6 calculated using using aa dye dyeattenuation attenuationcoefficient coefficientofofk=-1 k-1 .94. respectively, calculated .94. Paiiels Panels c and d show the gas-phase plumes at t33 minutes of Experiments 44 and and 6 respectively, calculated using individual dye attenuation coefficients (Experiment -2.04, Experiment Experiment6: 6:kk==-1- .83). 4: k = -2.04,
46
Using contour plots, a more detailed inspection can be conducted into the effects of average and individual k values on the modeled plume structure. Figure 3.8a - c shows contour plots made from images computed using the average k-value,
while plots in Figure 3.8d - fare derived from images computed with individual k-
values. Figure 3.8a shows that the initial overall size of the plumes in the two experiments differs greatly when the average k-value is used. While the plume size becomes more similar over time, the iimer inner region of high concentration, depicted here by the 75% contour interval, remains much smaller in Experiment 4 than in
Experiment 6. Tn In contrast, contrast, the two plumes are initially of similar sizes when individual k-values are used, as shown in Figure 3.8d. Plume size remains similar over the course of time, and while the interior region of high concentration is still greater in Experiment 6, the difference between the two experiments is not as pronounced as it was when the average k-value k-value was was used. used. The images in Figure 3d-f more closely resemble expected results from two replicate experiments. Finally, Figure 3.4 shows that using the individual k-values improves the predictions of carbon dioxide mass in both experiments. Using individual k-values appears to yield accurate representations of the amount of carbon dioxide contained in
the chamber. The fact that different k-values were found for the two experiments suggests that the nature of the methyl red solution differed between experiments sufficiently to affect predicted carbon dioxide mass.
47
15-
2iJ-
0
25-
a
10
-
E
0
25-
S
C.
20-
a
as
a ._,IL-
I
C
.
C
10-
15-
i-jr
510..
L
35 4111
a 5
0
I
I
15
I
I
F
2 36 4i 45
20
451
b
25 0
'3
10
L
F
1.1
-
45
wth (cm)
wij
t = 6 minutes
0
:FF(
c1.1
- 30 minutes
18 minutes
I
C
15-
LL
in
is-.
'IiI?.
10 -
LH,e
5-.
.,
20-
ft
25
0.
no-
an 36
40 -
5
i,J
I
32
I
30
I
40
45-
--I
I
5
I
II)
'dlh (cm)
I
I
in
23
F
1
3
3
OIJ
V
IC
F.
5
i
r
1
Th
ci
45-
k
40 -
25 -
ìlç
35-
-
S
0
-F- - C
a
0
2'
('ii
20-
4i
11
10
12
crr
[CO2IgO.00I6 mo)/L(5°/oofsaturation)
Fx.4
lTx6
[CO2Ig= 0.0227 rnol/L (75% of saturation)
Ex.4
Ex.6
Figure 3.8 Contour-p'ot comparison of Experiments 4 and 6 modekd with the average k-value, and with individual k-values. The top series shows contour images computed using the average k-value, while the bottom series shows contour images computed using individual k-values. Each series shows the development of the plume over three time points (t6, 18 and 30 minutes) by means of contour intervals which encircle the area in which pixel values are equivalent to or greater than a given concentration va'ue. Both experiments are depicted by high and low concentration Contour intervals in each image, except in the images at 6 minutes (Panels a and d) where pixe' values in both experiments were generally below [CO2]g = 0.0227 mol/L. The outer interval describes the area in which [CO2J = 0.00 16 moLL or higher, while the inner interval describes the area in which pixel values represent [CO2Ig 0.0227 mol/L or higher.
48
0.012
0.01
0 0.008
Ex.6-Averagek
C"
0
Ex. 6 - Individual k 0.006
5
A
Ex.4-Averagek Ex. 4 - Individual k
0.004
1:1 Line
E
a. 0.002
A
A
A
0
0.000 0.002 0.004 00O4 0.006 0.008 0.010 0.012
added CO2 (mol)
Figure 3.9 Effect of using averaged or individual dye attenuation coefficients (k) on predicted masses of carbon dioxide. Data are for the two homogeneous hydrostatic experiments with a gas flow rate of 280 mL/h, Experiments 4 and 6. Filled symbols represent masses computed with the averaged k-value. Open symbols represent masses computed for each experiment using the respective individual k-value (Experiment 4: k -2.04, Experiment 6: k -1.83), and lie much closer to the 1:1 line.
49
4. CONCLUSIONS This imaging method has great promise as a tool for increasing our understanding of gas phase movement in unsaturated porous media. The light transmission system provided an excellent means with which to observe the behavior
of carbon dioxide plumes under a suite of textural and flow regimes. Contour maps of the plume boundary showed responses of the gas to changes in environmental
conditions. However, the accuracy of the model to convert changes in light intensity to carbon dioxide concentration was imperfect. The method would be made more accurate by the selection of a dye which stays in solution, and by model calibration which would account for the dye solution in the water content model, and would would allow for the creation of a new light intensity - solution pH model which would include all applicable sand grades.
I suggest that the first step in refining this method would be to select a new
dye based on several factors including those mentioned above. Dyes selected for testing would include those which cover the pH range applicable to the carbon dioxide system, @H 3.9 - pH 7.2), such as bromcresol green, methyl orange,
Erichrome Black T or bromcresol purple. These dyes should be tested for their solubility in water and their tendency to sorb to the silica sand. Dyes would fail these first tests if they demonstrated flocculation or sorbed to the sand at any point of the
given pH range. If no dye was found which did not sorb to the silica sand, due to its negative charge, then uncharged plastic beads could be used instead, or the sand
could be chemically pre-treated. Dyes should also be tested in a sand packed, illuminated chamber for their detectability by the camera, for selection of an appropriate filter, and for a high signal-to-noise ratio.
To improve the methods of predicting water content and dye attenuation from transmitted light intensity, it would be necessary to run calibration experiments at a
range of pH values using all applicable grades of sand. For these experiments, the chamber could be packed uniformly with one grade of sand, and saturated
sequentially with buffered solutions at a range of pH values. The chamber would then be drained, and buffered solution would be pumped through the chamber at a
50
low flow rate, with pH buffer solution changing at intervals. Digital images would be captured throughout the process, which would be repeated for all other grades of sand
to be used in the experiment. From the collected data, the water content equation should be recalibrated to the dye solution. In addition, the dye attenuation equation could be reformulated to calculate dye solution pH directly from light intensity. This would significantly minimize the number of assumptions made in our current method, and would allow for imaging of flow through different textures of sand. These improvements could make the visual tracking of carbon dioxide movement using light transmission an important contribution to the field of vaporphase flow in the unsaturated zone.
51
5. BIBLIOGRAPHY Aeby, P., J. Forrer, C. Steinmeier, and H. Fluhler. 1997. Image analysis for determination of dye tracer concentrations in sand columns. Soil Science Society of America Journal 61:33-35. Affek, H.P., D. Ronen, and D. Yakir. 1998. Production of CO2 in the capillary fringe of a deep phreatic aquifer. Water Resources Research 34:989996. Altevogt, A.S., D.E. Rolston, and R.T. Venterea. 2003. Density and pressure effects on the transport of gas phase chemicals in unsaturated porous media. Water Resources Research 39:Art. 1061. Bogan, B.W., L.M. Lahner, V. Trbovic, A.M. Szajkovics, and J.R. Paterek. 2001. Effects of alkylphosphates and nitrous oxide on microbial degradation of polycyclic aromatic hydrocarbons. Applied and Environmental Microbiology 67:2139-2144. Brusseau, M.L., J. Popovicova, and J.A.K. Silva. 1997. Characterizing gaswater interfacial and bulk water partitioning for gas phase transport of organic contaminants in unsaturated porous media. Environmental Science & Technology 3 1:1645-1649. Butler, J.N. 1982. Carbon dioxide equilibria and their applications. AddisonWesley, Reading, MA. Codd, S.L., and S.A. Altobelli. 2003. A PGSE study of propane gas flow through model porous bead packs. Journal of Magnetic Resonance 163: 16-22. 163:16-22. Costanza, M.S., and M.L. Brusseau. 2000. Contaminant vapor adsorption at the gas-water interface in soils. Environmental Science & Technology 34:1-11. Damault, C.J.G., D.A. DiCarlo, T.W.J. Bauters, T.S. Steenhuis, J.-Y. Parlange, C.D. Montemagno, and P. Baveye. 2002. Visualization and measurement of multiphase flow in porous media using light transmission and synchrotron x-rays. Annals of the New York Academy of Sciences Sciences 972: 972:103-110. 103-110. Flury, M., and N.N. Wai. 2003. Dyes as tracers for vadose zone hydrology. Reviews of Geophysics 41. Forrer, I., A. Papritz, R. Kasteel, H. Fluhler, and D. Luca. 2000. Quantifying dye tracers in soil profiles by image image processing. processing. European European Journal Journalof of Soil Science 51:313-322.
52
Hillel, D. 1998. Environmental Soil Physics. 2nd ed. Academic Press, San Diego. Hoa, N.T. 1981. A new method allowing the measurement of rapid variations of the water content in sandy porous media. Water Resources Research 17 :4 1-48. 17:41-48. Kaiser, L.G., T. Meersmann, J.W. Logan, and A. Pines. 2000. Visualization of gas flow and diffusion in porous media. Proceedings of the National Academy of Sciences 97:2414-2418. Kaiser, L.G., J.W. Logan, T. Meersmann, and A. Pines. 2001. Dynamic NMR microscopy of gas phase Poiseuille flow. Journal of Magnetic Resonance 149:144-148. Kechavarzi, C., K. Soga, and P. Wiart. 2000. Multispectral image analysis method to determine dynamic fluid saturation distribution in twodimensional three-fluid phase flow laboratory experiments. Journal of Contaminant Hydrology 46:265-293. Kim, H., M.D. Aimable, Annable, and P.S.C. Rao. 2001. 2001. Gaseous Gaseous transport of volatile organic chemicals in unsaturated porous media: Effect of waterpartitioning and air-water interfacial adsorption. Environmental Science & Technology 35:4457-4462.
Koptyug, I.V., A.V. Matveev, and S.A. Altobelli. 2002. NMR studies of hydrocarbon gas flow and dispersion. Applied Magnetic Resonance 22:187-200. Koptyug, I.V., A.A. Lysova, A.V. Matveev, L.Y. Ilyina, R.Z. Sagdeev, and V.N. Parmon. 2003. The NMR micro-imaging studies of the interplay of mass transport and chemical reaction in porous media. Magnetic Resonance Imaging 21:337-343. Laor, Y., D. Ronen, and E.R. Graber. 2003. Using a passive multilayer sampler for measuring detailed profiles of gas-phase VOCs in the unsaturated zone. Environmental Science & Technology 37:352-360. Lee, M.D., and C.M. Swindoll. 1993. Bioventing for in situ remediation. Sciences 38 38:273-282. Hydrological Sciences :273-282. Lii, L.J., C.Y. Wang, and H.S. Lur. 1999. A novel means of analyzing the soluble acidity of of rice rice grains. grains Crop Science 39:1160-1164. 39:1160-1164.
Mair, R.W., R. Wang, M.S. Rosen, D. Candela, D.G. Cory, and R.L. Walsworth. 2003. Applications of controlled-flow laser-polarized xenon gas to porous and granular media study. Magnetic Resonance Imaging 21:287-292.
53
Masoud, M.S., and H.H. Hammud. 2001. Electronic spectral parameters of the azo indicators: methyl red, methyl orange, PAN, and fast black K-salt. Spectrochimica Acta Part a-Molecular and Biomolecular Spectroscopy 57:977-984. Mihopoulos, P.G., M.T. Suidan, G.D. Sayles, and S. Kaskassian. 2002. Numerical modeling of oxygen exclusion experiments of anaerobic Contaminant Hydrology Hydrology 558:209-220. bioventing. Journal of Contaminant 8:209-220. Nakamura, N., and Y. Amao. 2003. Optical CO2 sensor with the combination of colorimetric change of pH indicator and internal reference luminescent dye. Bulletin of the Chemical Society of Japan 76:14591462.
Nastev, M., R. Therrien, R. Lefebvre, and P. Gelinas. 2001. Gas production and migration in landfills and geological materials. Journal of Contaminant Hydrology 52:187-211. Niemet, M.R., and J.S. Selker. 2001. A new method for quantification of liquid saturation in 2D translucent porous media systems using light transmission. Advances in Water Resources 24:651-666. Nimer, N.A., C. Brownlee, and M.J. Merrett. 1999. Extracellular carbonic anhydrase facilitates carbon dioxide availability for photosynthesis in the marine dinoflagellate Prorocentrum micans. Plant Physiology 120: 105-111. 120:105-ill.
Ouyang, Y., and C. Zheng. 2000. 2000. Surficial Surficial processes and CO2 flux in soil ecosystem. Journal of Hydrology 234:54-70. Palumbo, A.V., S.P. Scarborough, Scarborough, S.M. S.M. Pfiffner, Pfiffner, and and T.J. T.J. Phelps. Phelps. 1995. Influence of nitrogen and phosphorus on the in situ bioremediation of trichloroethylene. Applied Biochemistry and Biotechnology trichioroethylene. 51/52:635-647. Pankow, J.F. 1991. 1991. Aquatic Aquatic Chemistry ChemistryConcepts. Concepts.1St jst ed. Lewis Publishers, Publishers, Inc., Chelsea, MI. Popovicova, J., and M.L. Brusseau. 1998. Contaminant mass transfer during gas-phase transport in unsaturated porous media. Water Resources Research 34:83-92. Post, W.M., T.-H. Peng, W.R. W.R. Emanuel, Emanuel, A.W. A.W. King, King, V.D. V.D. Dale, Dale, and andD.L. D.L. DeAngelis. 1990. The global carbon cycle. American Scientist 78:3 10326. Rathfelder, K.M., J.R. Lang, and L.M. Abriola. 2000. A numerical model (MISER) for the simulation of coupled physical, chemical and
54
biological processes in soil vapor extraction and bioventing systems. Journal of Contaminant Hydrology 43:239-270. Rockhold, M.L. 2002. Interactions Interactions between between Microbial Microbial Dynamics Dynamics and Transport Processes in Soils. Dissertation, Oregon State University. University.
Rockhold, M.L., R.R. Yarwood, M.R. Niemet, P.J. Bottomley, and J.S. Selker. 2002. Considerations for modeling bacterial induced changes in hydraulic properties of variably saturated porous media. Advances in Water Resources 25:477-495. 25:477-495. Schimel, D.S. 1995. Terrestrial ecosystems and the carbon cycle. Global Change Biology Biology 1:77-9 1:77-91. 1. Schincariol, R,A., R.A., E.E. Herderick, and F.W. Schwartz. 1993. On the application of image analysis to determine concentration distributions in laboratory experiments. Journal of Contaminant Hydrology 12:197215.
Schlesinger, W.H. 1997. Biogeochemistry: An Analysis of Global Change. 2' ed. Academic Press, San Diego. Schroth, M.H., S.J. Ahearn, J.S. Selker, and J.D. Istok. 1996. Characterization of Miller-similar silica sands for for laboratory laboratory hydrologic hydrologic studies. Soil Science Society of America Journal 60:1331- 1339.
J.S. Selker, Selker, M. M. Oostrom, Oostrom, and and M.D. Schroth, M.H., J.D. Istok, J.S. M.D. White. 1998. Multifluid flow in bedded porous media: laboratory experiments and numerical simulations. Advances in Water Resources 22:169-183. Selker, J.S., C.K. Keller, and J.T. McCord. 1999. Vadose Zone Processes. 1st ed. Lewis Publishers, Boca Raton, FL. Simunek, J., and D.L. Suarez. 1993. Modeling of carbon dioxide transport and production in soil 1. Model development. Water Resources Research 29:487-497. Tidwell, V.C., and R.J. Glass. 1994. X ray and visible light transmission for laboratory measurement of two-dimensional saturation saturation fields fields in thinslab systems. Water Resources Research 30:2873-2882. van Genuchten, M.T. 1980. A closed-form equation for predicting the hydraulic conductivity of unsaturated soils. Soil Science Society of America Journal 44:892-898. Vanderborght, J., P. Gahwiller, H. Wydler, U. Schultze, and H. Fluhler. 2002. Imaging fluorescent dye concentrations on soil surfaces: Uncertainty
55
of concentration estimates. Soil Science Society of America Journal 66:760-773. Wang, Z., J.H. Lu, L.S. Wu, T. Harter, and W.A. Jury. 2002. Visualizing preferential flow paths using ammonium carbonate and a pH indicator. Soil Science Society of America Journal 66:347-351. Weisbrod, N., M.R. Niemet, and J.S. Selker. 2002. Imbibation of saline solutions into dry and prewetted porous media. Advances in Water Resources 25:841-855. Weisbrod, N., M.R. Niemet, and J.S. Selker. 2003. Light transmission technique for the evaluation of colloidal transport and dynamics in porous media. Environmental Science & Technology 37:3694-3700. Williams, G.M., R.S. Ward, and D.J. Noy. 1999. Dynamics of landfill gas migration in unconsolidated sands. Waste Management & Research 17:327-342. 17 :327-342. Yarwood, R.R., M.L. Rockhold, M.R. Niemet, J.S. Selker, and P.J. Bottomley. 2002. Noninvasive quantitative measurement of bacterial growth in porous media under unsaturated-flow conditions. Applied and Environmental Microbiology 68:3 597-3605. Yu, Z.B., and F.W. Schwartz. 1999. Determining concentration fields of tracer plumes for layered porous media media in in flow-tank flow-tank experiments. experiments. Hydrogeology Journal Journal7:23 7:236-240. Hydrogeology 6-240.