Judy Helgen (Minnesota Pollution Control Agency), Jeanne DiFranco (Maine Department of Environ- ..... within the wetland (Clarke 1981, Driver 1977,. Hanson ...
United States Environmental Protection Agency
Office of Water Washington, DC 20460
EPA-822-R-02-019 March 2002
Methods for evaluating wetland condition
#9 Developing an Invertebrate Index of Biological Integrity for Wetlands
United States Environmental Protection Agency
Office of Water Washington, DC 20460
EPA-822-R-02-019 March 2002
Methods for evaluating wetland condition
#9 Developing an Invertebrate Index of Biological Integrity for Wetlands
Principal Contributor Minnesota Pollution Control Agency Judy Helgen, PhD
Prepared jointly by: The U.S. Environmental Protection Agency Health and Ecological Criteria Division (Office of Science and Technology) and Wetlands Division (Office of Wetlands, Oceans, and Watersheds)
United States Environmental Protection Agency
Office of Water Washington, DC 20460
EPA-822-R-02-019 March 2002
Notice The material in this document has been subjected to U.S. Environmental Protection Agency (EPA) technical review and has been approved for publication as an EPA document. The information contained herein is offered to the reader as a review of the “state of the science” concerning wetland bioassessment and nutrient e nrichment and is not intended to be prescriptive guidance or firm advice. Mention of trade names, products or services does not convey, and should not be interpreted as conveying official EPA approval, endorsement, or recommendation. Appropriate Citation U.S. EPA. 2002. Methods for Evaluating Wetland Condition: Developing an Invertebrate Index of Biological Integrity for Wetlands. Office of Water, U.S. Environmental Protection Agency, Washington, DC. EPA-822-R-02-019.
Acknowledgments EPA acknowledges the contributions of the following people in the writing of this module: Judy Helgen (Minnesota Pollution Control Agency), Jeanne DiFranco (Maine Department of Environmental Protection), Mike Gray (Ohio Environmental Protection Agency), Peter Lowe (United States Geological Survey), Randy Apfelbeck (Montana Department of Environmental Quality), and Russ Frydenborg (Florida Department of Environmental Protection). This entire document can be downloaded from the following U.S. EPA websites: http://www.epa.gov/ost/standards http://www.epa.gov/owow/wetlands/bawwg
ii
Contents Foreword .............................................................................................................. v List of “Methods for Evaluating Wetland Condition” Modules ...........................................................................................vi Summary .................................................................................................................1 Purpose ..................................................................................................................1 Introduction.........................................................................................................1 Process for Developing an Invertebrate IBI for Wetlands .......................................................................................................3 Step 1. Select study sites ......................................................................5 Step 2. Plan the invertebrate sampling .............................................5 Step 3. Field sampling methods and decisions .................................8 Step 4. Sample processing procedures .......................................... 15 Step 5. Metric analysis ......................................................................... 18 A. Selection of attributes .................................................... 18 B. Forming the IBI...................................................................... 22 Conclusions and Recommendations .......................................................... 23 References ........................................................................................................ 25 Appendixes.......................................................................................................... 34 Glossary ............................................................................................................. 46 List of Figures Figure 1:
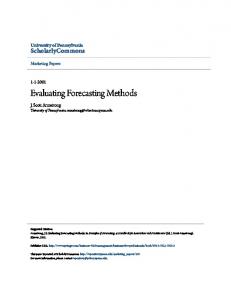
Invertebrate IBI Score Plotted Against an Estimation of Human Disturbance on Large Depressional Wetlands in Minnesota ....................................2
Figure 2:
Flowchart for Developing an Invertebrate Index of Biological Integrity .....................................................................4
Figure 3:
Illustration of Sampling Sites in a Wetland With Emergent Vegetation Shown as Symbols ..............................7
iii
Figure 4:
Framed Screen for Separating Vegetation From Invertebrates During Dipnetting ........................................... 12
Figure 5:
Activity Traps Used by Minnesota .......................................... 13
Figure 6:
Total Number of Invertebrate Taxa Plotted Against the Log of the Chloride in the Water (mg/L) From Large Depressional Wetlands in Minnesota ..................... 19
Figure 7:
Intolerant Taxa Plotted Against the Log of Phosphorus (mg/L) in the Water of Large Depressional Wetlands in Minnesota ................................. 20
iv
Foreword In 1999, the U.S. Environmental Protection Agency (EPA) began work on this series of reports entitled Methods for Evaluating Wetland Condition. The purpose of these reports is to help States and Tribes develop methods to evaluate (1) the overall ecological condition of wetlands using biological assessments and (2) nutrient enrichment of wetlands, which is one of the primary stressors damaging wetlands in many parts of the country. This information is intended to serve as a starting point for States and Tribes to eventually establish biological and nutrient water quality criteria specifically refined for wetland waterbodies. This purpose was to be accomplished by providing a series of “state of the science” modules concerning wetland bioassessment as well as the nutrient enrichment of wetlands. The individual module format was used instead of one large publication to facilitate the addition of other reports as wetland science progresses and wetlands are further incorporated into water quality programs. Also, this modular approach allows EPA to revise reports without having to reprint them all. A list of the inaugural set of 20 modules can be found at the end of this section. This series of reports is the product of a collaborative effort between EPA’s Health and Ecological Criteria Division of the Office of Science and Technology (OST) and the Wetlands Division of the Office of Wetlands, Oceans and Watersheds (OWOW). The reports were initiated with the support and oversight of Thomas J. Danielson (OWOW), Amanda K. Parker and Susan K. Jackson (OST), and seen to completion by Douglas G. Hoskins (OWOW) and Ifeyinwa F. Davis (OST). EPA relied heavily on the input, recommendations, and energy of three panels of experts, which unfortunately have too many members to list individually: n
Biological Assessment of Wetlands Workgroup
n
New England Biological Assessment of Wetlands Workgroup
n
Wetlands Nutrient Criteria Workgroup
More information about biological and nutrient criteria is available at the following EPA website: http://www.epa.gov/ost/standards
More information about wetland biological assessments is available at the following EPA website: http://www.epa.gov/owow/wetlands/bawwg
v
List of “Methods for Evaluating Wetland Condition” Modules Module #
Module Title
1 ................. Introduction to Wetland Biological Assessment 2 ................. Introduction to Wetland Nutrient Assessment 3 ................. The State of Wetland Science 4 ................. Study Design for Monitoring Wetlands 5 ................. Administrative Framework for the Implementation of a Wetland Bioassessment Program 6 ................. Developing Metrics and Indexes of Biological Integrity 7 ................. Wetlands Classification 8 ................. Volunteers and Wetland Biomonitoring 9 ................. Developing an Invertebrate Index of Biological Integrity for Wetlands 10 ............... Using Vegetation to Assess Environmental Conditions in Wetlands 11 ............... Using Algae to Assess Environmental Conditions in Wetlands 12 ............... Using amphibians in Bioassessments of Wetlands 13 ............... Biological Assessment Methods for Birds 14 ............... Wetland Bioassessment Case Studies 15 ............... Bioassessment Methods for Fish 16 ............... Vegetation-Based Indicators of Wetland Nutrient Enrichment 17 ............... Land-Use Characterization for Nutrient and Sediment Risk Assessment 18 ............... Biogeochemical Indicators 19 ............... Nutrient Load Estimation 20 .............. Sustainable Nutrient Loading
vi
Introduction
Summary
T
T
his module describes the advantages of using aquatic invertebrates for assessing the condition of wetlands and presents approaches for developing an invertebrate IBI for wetlands. Processes, methods, and examples of invertebrate IBIs for wetlands are presented, along with summaries of approaches currently used in several States. The module is based primarily on work done on ponded freshwater wetlands, but the approaches described can be modified for other types of wetlands. The module describes development of the IBI, but other indexes and approaches for assessing the condition of wetlands, particularly multivariate techniques (Davies et al. 1999, Reynoldson et al. 1997), can be used. A glossary of terms is also provided.
he invertebrate module gives guidance for developing an aquatic invertebrate Index of Biological Integrity (IBI) for assessing the condition of wetlands. In the module, details on each phase of developing the IBI are given. First, in the planning stage, invertebrate attributes are selected, the wetland study sites are chosen, and decisions are made about which stratum of the wetland to sample and what is the optimal sampling period or periods. Then, field sampling methods are chosen. The module describes field methods used in several States, and gives recommendations. Laboratory sampling procedures are reviewed and discussed, such as whether and how to subsample, and what taxonomic level to choose for identifications of the invertebrates. Specific categories of attributes, such as taxa richness, tolerance, feeding function, and individual health are discussed, with examples. Appendices to the invertebrate module give details about the advantages and disadvantages of using invertebrates, of the different attributes, of various field sampling methods, and of lab processing procedures as used by several State and Federal agencies. The module and appendices give a detailed example of one State’s process for developing an invertebrate IBI, with a table of metrics with scoring ranges, and a table of scores of individual metrics for 27 wetlands. A glossary of terms is provided.
Why use aquatic invertebrates to assess wetlands condition? n Because they respond to many kinds of stressors to wetlands, as shown in Figure 1. What are the advantages and disadvantages of using aquatic invertebrates? Several advantages and disadvantages of using aquatic invertebrates are reviewed in Appendix A. Briefly, some of the advantages of using invertebrates for biological assessments of wetlands are: n They are commonly and widely distributed in many types of wetlands (Batzer et al. 1999).
Purpose
n They respond with a range of sensitivities to many kinds of stressors; they are commonly used for toxicity testing and ecological assessments in waterbodies (e.g., see Barbour et al. 1999, Beck 1977, Cairns and Niederlehner 1995, deFur et al. 1999, Euliss and Mushet 1998, Hart and Fuller 1974,
T
he purpose of the invertebrate module is to describe the advantages of using aquatic invertebrates for assessing the condition of wetlands, and to present approaches for developing IBIs for wetlands.
1
Heliovaara and Vaisanen 1993, Helgen and Gernes in press, Hellawell 1986, Kerans and Karr 1994, Lewis et al. 1999, Morris et al. 1989, Rainbow 1996, Saether 1979, Servos 1999, Stuijfzand et al. 2000, Warwick 1980). n Many aquatic invertebrates complete their life cycles in wetlands; they are exposed directly to physical, chemical, and biological stressors within the wetland (Clarke 1981, Driver 1977, Hanson and Swanson 1989, Fairchild 2000, Klemm 1982, Larson 1987, Mackie, in press; Merritt and Cummins 1996a; Walker 1953, 1958, Walker and Corbet 1975, Westfall and May 1996, Wiggins 1996, Wiggins et al. 1980, Wrubleski 1987). n Aquatic invertebrates are important in wetland food webs of wildlife (Batt et al. 1992, Colburn 1997, Deutschman 1984, Eldridge, J. 1990, Fredrickson and Reid 1988, King and Wrubleski 1998, Krapu and Reinecke 1992,
Swanson et al. 1977, Swanson et al. 1985, Wissinger 1999). n They have public appeal in citizen monitoring programs (see Module 8, Volunteers and Wetland Biomonitoring; Helgen and Gernes 1999). Many wetland invertebrates complete the life cycle from egg to adult in a wetland, and therefore are directly exposed to wetland conditions and stressors. In infrequently flooded, seasonal, and temporary wetlands, invertebrates will have shorter life cycles of days to weeks (Schneider and Frost 1996, Wiggins et al. 1980). In more regularly flooded, more permanent wetlands, invertebrates with longer life cycles of weeks to months, such as dragonflies or crayfish, will be present. Populations of invertebrates with shorter life cycles, such as fairy shrimp and mosquitoes, will respond more quickly to human disturbances, but they may recover more quickly, either from resting eggs or from recolonization by adult insects. Invertebrates with
Figure 1: Invertebrate IBI score plotted against an estimation of human disturbance on large depressional wetlands in Minnesota. The IBI has 10 scored metrics; the gradient combines factors of chemical pollution and alterations in the buffer zone and near wetland landscape.
2
Process for Developing an Invertebrate IBI for Wetlands
longer life cycles, such as dragonflies, some fingernail clams, and snails, will experience longer exposure to wetlands conditions. In some cases, recovery from losses of juveniles may take longer, because of more limited seasons of egg laying by adults and longer development times from egg to adult (Corbet 1999).
A
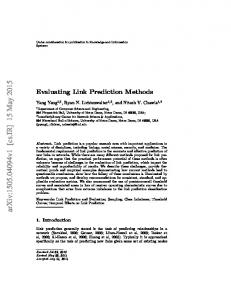
flow chart for developing an invertebrate IBI for wetlands is shown in Figure 2. A similar flowchart showing an example of the process for developing an invertebrate IBI in Minnesota is shown in Appendix K. Overall, the process involves sampling invertebrate attributes of several wetlands of similar class and region representing a range of human disturbance or impairment, from least to most disturbed. After sampling, the information on the degree of impairment is related to the measures of various invertebrate attributes to see which of the attributes show predictable responses to impairment. These attributes will constitute the metrics for the IBI. Scores are assigned to each metric to indicate the level of response to human disturbance (see Module 6: Developing Metrics and Indexes of Biological Integrity). The metric scores are summed for the total IBI score. Decisions are made as to which range of IBI scores indicates a poor condition, i.e., not attaining designated use (if one exists), or a moderate or excellent condition. This module will focus primarily on the steps in the process that relate to developing invertebrate IBIs.
The disadvantages of using aquatic invertebrates for biological assessments are detailed in Appendix A. The biggest challenge is the amount of staff time and expertise that is needed for picking the organisms from the samples and for identifications. Techniques for reducing the amount of picking time, such as using a screen under vegetation while dipnetting, using activity traps, or by subsampling, will be described below. Some State agencies or organizations may lack the laboratory facilities to do the work in-house and will need to contract out the work. When work is contracted out, it is important for the project managers to provide the contractor with explicit protocols and procedures for identifications and analysis in relation to the needs of the program. An advantage of doing the work in-house is that the staff involved can provide active input into the development of the biological indexes and can participate in implementing the findings into the State’s programs. Whether or not the identifications are contracted out, it is vital to have scientists on staff to provide active input into biocriteria development and implementation.
Additional detail for this process can be found in Module 4: Study Design, Module 7: Wetlands Classification, Module 6: Developing Metrics and Indexes of Biological Integrity, and Module 17: Landscape Characterization for Wetlands Assessments. Additional information on biological monitoring of wetlands is also available in Rader et al. (in press).
In sum, disadvantages of using macroinvertebrates are: n Sample processing takes a lot of staff time or resources. n Organizations may lack facilities for processing and identifying invertebrates.
It needs to be stated that other approaches are successful in evaluating the condition of waterbodies with invertebrates. Multivariate methods for ana-
3
step 1: select study sites
l l l
l
step 2: Plan invertebrate sampling
l
l l
l
step 3: Field Sampling
l
l
l
l l
step 4: Sample Processing
l
l
l
step 5: Metric Analysis
l l l
Select ecogeographic region Decide on wetland class Select sites within wetland classes that exhibit a range of disturbances
Select invertebrate attributes of sensitivity, richness, tolerance, trophic structure, or other attributes likely to respond to human disturbance Gather literature about regional invertebrates for the wetland class Determine which strata of wetland to sample Select optimal seasonal sampling period for maturity of invertebrates
Select appropriate sampling methods for objectives of the program Pretest sampling methods to determine number of samples to be taken per site, and to assure the desired types of invertebrates are collected Decide if samples will be preserved and processed in the lab, or sorted and identified in the field; write Standard Operating Procedures Sample sites within the index period, at the same time collect samples for chemical analysis and assess the surrounding landscape
Decide to pick entire sample or subsample Decide on taxonomic levels for identifications establish database of taxa lists and ITIS codes Develop Standard Operating Procedures and set up a Quality Assurance plan for repicking and for independent verifications of identifications Establish a reference collection with several specimens of each taxon
Plot attribute data against human disturbance gradient Select most responsive 8-12 metrics Score metrics by trisecting data or other method Sum the metric scores for IBI, plot IBI against disturbance gradient
Figure 2: Flowchart for Developing an Invertebrate Index of Biological Integrity.
4
lands, those that are most likely to be causing impairment to the invertebrates within the region and wetland class. Invertebrates exhibit a wide range of sensitivities to human-induced stressors such as pesticides, metals, siltation, acidification, loss of vegetation or vegetation diversity, nutrient enrichment, and changes in the oxygen regime (Adamus 1996, Beck 1977, Eyre et al. 1993, Helawell 1986, Resh and Rosenberg 1984, Saether 1979). Macroinvertebrates respond to disturbances in wetland vegetation because invertebrates are dependent on the vegetation as part of their food source (Wissinger 1999), for attachment sites, refugia (Corbet 1999, p. 164, Orr and Resh 1989), and egg laying. Some dragonflies and damselflies lay eggs on specific types of aquatic vegetation (Sawchyn and Gillott 1974, Corbet 1999, p. 591).
lyzing invertebrate data are used for stream assessments in the Biological Monitoring Program in Maine (Davies and Tsomides 1997, Davies et al. 1995, 1999). Discriminant analysis of invertebrate data predicts the degree of impairment by comparison with known biological characteristics of the state of Maine’s four water quality management classes. (See also Marchant et al. 1997, Norris 1995, Wright 1995, Hawkins and Carlisle in press, U.S. EPA 1998, Lake and Reservoir Bioassessment and Biocriteria Appendix E). Reynoldson and others (1997) found estimates of accuracy and precision to be higher when multivariate techniques were used for data analysis compared with multimetric methods. If multivariate analysis is used, it is important to use a method that allows interpretation of proportional attributes rather than one that is limited to data on the presence or absence of taxa (see Reynoldson et al. 1997). A disadvantage of multivariate methods is the complexity of setting up the data analysis.
Step 2. Plan the invertebrate sampling Selection of invertebrate attributes Attributes are measures of the invertebrate composition to be tested to see if they show a graded response, or dose-response, to human disturbances such as chemical pollution, siltation, or habitat alteration. If a response is seen, the attribute will be selected as a metric and scored as part of the overall IBI score. See Module 6: Developing Metrics and Indexes of Biological Integrity. More detailed information on the selection of invertebrate attributes is given near the end of this module in Step 5 on Metric Analysis. Appendix F lists advantages and disadvantages of different kinds of attributes, and Appendix I shows metrics used by Minnesota for large depressional wetlands. Appendix G shows the attributes used or tested by several States.
Step 1. Select study sites To reduce natural variability, an ecoregion or ecological region and a class of wetlands are chosen for developing the IBI (see Module 7 on Classification). It is necessary to select specific wetland classes, because invertebrate assemblages may differ among classes of wetlands (in Batzer et al. 1999; see Huryn and Gibbs, Leslie et al., Marshall et al., Smock et al., and others; Carlisle et al. 1999, Weisberg et al. 1997). It is important to include several least impaired or reference wetlands along with a range of wetlands that are affected by human disturbances. Sufficient numbers of least-impaired reference wetlands and wetlands experiencing a range of impairments are needed to detect significant dose-response relationships between the invertebrate attributes (Y axis) and the measures of human disturbances (X axis). See the Glossary for definitions of disturbance and human disturbance.
Attributes are selected from major categories of invertebrate composition (Barbour et al. 1996, Resh et al. 1995), such as measures of taxonomic richness, measures of tolerance proportions and intolerant taxa, measures related to trophic structure and functional feeding groups (see Merritt et al. 1996,
The impaired wetlands can be selected to target the major types of human-caused stressors to wet-
5
1999) and other measures related to longevity, introduced or exotic species, and invertebrate health or condition (see Diggins and Stewart 1998, Hudson and Ciborowski 1996, Warwick 1980). Several invertebrate attributes are tested, and the data for the attributes are related to measures of human influence. From the attributes that show significant relationships with human disturbances, a set of 8 to 12 are selected as metrics. An attribute that does not show a significant response to human disturbances will likely be discarded. However, if there is some reason to think the attribute might show a response to different kinds of stressors that were not included in the study design, it might be retained for further testing. It is important to plan to measure the types of invertebrates that would be expected to inhabit the class of wetland in the ecological region of interest. The taxonomic composition of the invertebrates will likely differ in bogs, playa lakes, temporary ponds, prairie potholes or riparian wetlands, for example (see Batzer et al. 1999). Information can be sought from regional scientific literature and from invertebrate biologists in the area. Whatever the class of wetland might be, the major categories of attributes will be represented, such as taxa richness and tolerant and intolerant taxa, even if the taxonomic composition differs. If there is little preexisting information on species composition for the particular wetland class, it may be helpful to do preliminary sampling in reference wetlands to develop a list of species and then select the attributes to be tested. This could be done when the sampling methods are being tested. Determine which stratum or zone(s) of the wetland to sample One decision is whether to attempt to sample the entire wetland and all of its habitats, or to sample defined zones or strata within the wetland. Wetlands have several zones that are related to the in-
fluence of hydrology and/or plant communities. For example, freshwater marshes have shallow water, emergent macrophyte, and floating-leafed and submersed aquatic plant zones. Bottomland forest wetlands may have zones ranging from aquatic to swamp to semipermanently flooded to seasonally then temporarily flooded (Mitsch and Gosselink 1993). It may not be necessary to sample all the zones in a wetland to assess its condition. Either enough of the wetland habitat should be sampled to assess its condition, or the area most sensitive to impairment should be assessed. In a small wetland, sampling all the habitats may be possible, but in larger wetlands the work effort may necessitate choosing strata for the sampling and maintaining a consistency among wetlands of the habitats that are sampled. The choice can include the following considerations: n Sample in the zone or stratum that is likely to have the greatest variety and production of macroinvertebrates, n Sample in the zone or stratum that is considered to be most vulnerable or most affected by human disturbances, or n Select a habitat type that is representative of the wetland, as opposed to unique or minor in extent; sample enough of the habitats to integrate the conditions in the wetland. See also Module 4: Study Design for Monitoring Wetlands. Examples of the zones that were selected by different States involved in wetland monitoring are given in Appendix B. Aquatic macroinvertebrates occur in association with benthic sediments, emergent vegetation, submergent vegetation, and open-water habitats. They colonize hard substrates such as tree roots or rocks. Some feed on the microflora that colonize the surfaces of plants and hard substrates; some are predators on the smaller herbivorous or detritivorous invertebrates. Different invertebrate assemblages are associated with these different
6
BT BT
BT DN1
DN1
BT
DN2
BT
BT
BT
BT BT
DN 2
BT
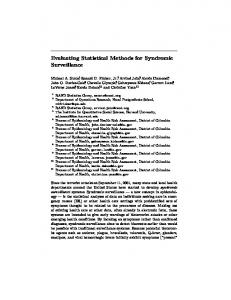
Figure 3: Illustration of sampling sites in a wetland with emergent vegetation shown as symbols. Two standardized dipnetting samples are taken from the wetland about 20-30 meters apart (DN1 and DN2). Each sample consists of three to five sweeps repeated in two efforts (represented by two DN1s and two DN2s). Ten activity traps (BT) are placed at the edge and in representative areas of the near shore emergent vegetation zone in water < 1 m deep. Wetland is not drawn to any scale. Method is used by Minnesota (MPCA). See Appendixes B and C.
(Hanson and Riggs 1995). Having more taxa in vegetated areas may not reflect direct herbivory on the plants, but the conversion of macrophytes into detritus is an important source of nutrition for invertebrates (Euliss et al. 1999). Also, as stated previously, macrophytes provide refugia, substrates for growth of algae and small organisms, and egg laying sites.
habitats, even with different kinds of wetland vegetation (Burton et al. 1999, Gathman et al. 1999, King and Brazner 1999). In preliminary studies of coastal wetlands, some invertebrate attributes differed among types of emergent vegetation zones. Attributes were selected that gave consistent, rather than contradictory, responses to human disturbance among sites across four defined plant zones (Burton et al. 1999).
An example of sampling locations in a depressional wetland in Minnesota is given in Figure 3.
The vegetated areas of wetlands have been observed to have more taxa of chironomids (Driver 1977) and aquatic beetles (Aitkin 1991, Timms and Hammer 1988) and other taxa (Dvork 1987). Emergent vegetation areas had greater richness when compared with open water areas that lacked submersed vegetation (Olson et al. 1995, Voigts 1976). If fish are present, open-water areas may have more predation by fish on invertebrates
Select the optimal seasonal sampling period The seasonal index period is the window of time when the sampling of the wetland is optimal to obtain the most representative, mature invertebrate community and the maximum number of identifiable taxa. The different and seasonal life cycle strat-
7
egies of invertebrates present a challenge as to when to sample, especially if the sampling is to be done just once in a season. If the wetland is sampled too early in the year, the invertebrates may be less mature, making the identifications more difficult. If the wetland is sampled later in the season, there may be emergences of aquatic insects from the wetland and immigration of adult insects that fly into the wetland from other waterbodies. If the wetland is sampled too late in a season, the smaller wetlands may have dried down or become choked with vegetation. The seasonal index period will differ across different regions of the United States and it will differ for different types of wetlands. Invertebrates are known to undergo seasonal changes in populations and species that inhabit a waterbody. Ideally, the wetland should be sampled in more than one season; however, this may not be practical for State programs. In selecting an index period, the following should be considered: n The invertebrates should have developed sufficiently to be identified by biologists. n The index period should bracket a time when as many resident taxa as possible are present. n The index period is not during a time that the wetland is likely to dry down or become choked with vegetation (so it is still sampleable). n The index period could attempt to precede maximum fish predation, if any, while still encompassing the season of maximum richness and development of invertebrates. n The index period should be shifted somewhat to account for unusually late or early seasons (the main goal is to optimize the number of invertebrate taxa present and mature).
See Appendix B for the approaches taken by different States and Appendix H for addresses of State contacts. Maine samples in June, to obtain the most
mature of some of the invertebrates (Davies et al. 1999), Minnesota (Gernes and Helgen 1999, Helgen and Gernes in press) samples during June when there is greater maturity in the Odonata and more water in the wetlands. Wetlands in the more southern location of a study set are sampled earlier in the index period. Montana (Apfelbeck 1999) samples the Plains Ecoregion in April to mid-June, the Intermountain Valley and Prairie Ecoregion from June to August, and the Rocky Mountain Ecoregion from mid-June to September. Rapid Bioassessment Protocols for Use in Streams and Wadeable Rivers (Barbour et al. 1999) contains a discussion of the sampling seasons for stream invertebrates. Step 3. Field sampling methods and decisions Before the actual sampling for monitoring wetlands takes place, several decisions need to be made. These decisions will be based in a large part on the program objectives or information needs that the invertebrate IBI is addressing: n What strata or zones of the wetland to sample (see discussion of selecting sampling stratum above and see Module 4 on Study Design) n Whether to sample once or more than once during the season (see discussion on selecting seasonal index period above) n Whether to sample all habitats in the stratum or zone (multihabitat approach), or selected habitats n Whether the approach collects the range of invertebrates needed for the attributes n What sampling methods will be used to collect the desired invertebrates efficiently n How many samples can be processed in the lab Recommendations for field methods Several methods for collecting invertebrates in wetlands are described below and listed with ad-
8
taxa or species per unit area sampled. A semiquantitative sampling method (dipnetting, activity traps), as described below, will record the number of taxa per total sample count. This is called numerical taxa richness. In either case, the number of species or taxa usually increases with sample size, i.e., with the number of samples taken or the area sampled. For the purposes of comparing sites, it is essential that the number of samples and area sampled be the same at all sites.
vantages and disadvantages in Appendix C. The following are recommended, but may not be applicable or suitable for researchers or State agencies under certain circumstances. n Sample a stratum of the wetland that contains most of the macroinvertebrates: often the shallow areas have emergent or submerged vegetation; very small wetlands can be sampled all around the edges. n Sample once during the season, after determining when the maximum development of the invertebrates occurs, and take more than one sample at that time; if resources permit, sample in two seasons taking more than one sample on each visit date.
Several samples should be taken with consistent methods at all sites to determine how many samples are necessary to collect a desired percentage of the total number of species collected. Ideally, enough samples will be collected to achieve the plateau level at which taking more samples does not increase the number of species. However, this may not be practical, because a plateau may not be reached even with many samples (see Mackey et al. 1984). Sparling et al. (1996) collected multiple samples at the same sites and recorded the increases in the percent of total invertebrate taxa with the increase in the number of samples analyzed. In 1, 2, 3, 4, 5, and 6 samples there were, cumulatively collected, 40%, 56%, 60%, 64%, 68%, and 72% of the invertebrate taxa, respectively. In addition to comparing the taxa gained by added sampling effort, the effects on the final evaluation of the wetland, which lead to the IBI or other index score, should be gauged for each level of effort. To reduce variability, a minimum of three samples is recommended, although each method should be tested for its variability if possible.
n Sample all habitats within the stratum or zone, or sample selected habitats if they are known to have a wide representation of invertebrates. n Use a dipnetting method with a standardized and repeatable protocol; combine this with activity traps to collect the motile predators (see discussion of these and other methods below). Determining the number of samples to take: species richness and sampling effort Once these decisions have been made, the sampling methods should be pretested in the field to ensure they collect the invertebrates that are needed for the attributes and to determine the numbers of samples that will be needed. In practice, States, Tribes, and researchers often have to balance the limitations of resources against the requirements for validation of data. It is useful to test methods in reference wetlands to determine how many samples are needed to obtain the desired representation of the invertebrate fauna.
It may not be possible to do a power analysis at the beginning of IBI development. Power analysis determines how many samples need to be taken to obtain enough statistical power to detect differences among sites using the IBI scores. To do this, several samples would be taken in each of several wetlands that have a range of human disturbances. For discussions of power analysis and the number of samples to take, see Eckblad (1991), Allan
It is well known in ecological research that the number of species or taxa collected frequently increases with the sampling effort (Magurran 1988). A quantitative sampling method (e.g., cores or Gerking samplers) will yield data on the density of
9
(1984), and Green (1989). Several papers may be helpful (Davies et al. 1995, 1999, Davies and Tsomides 1997, Fore et al. 1994, Rankin and Yoder 1990, Rathbun and Gerritsen in press). Variability in the biological data may increase with greater impairment, as seen in biological monitoring in Ohio streams (Rankin and Yoder 1990, Yoder 1991). Select the appropriate sampling methods The methods appropriate for sampling will depend on the type of wetland and the goals of the sampling. Appendix B describes sampling protocols used by several states with advantages and disadvantages. The emergent or submerged vegetation in wetlands presents a challenge for sampling. Selected methods used in wetlands studies are summarized in Appendix C with advantages and disadvantages. More detail on the methods can be obtained from references cited in the text to follow. See Batzer et al. (in Rader et al. in press) on sampling invertebrates in wetlands. There is a need for comparisons among the most commonly used sampling methods for sampling invertebrates, particularly for differences in invertebrate composition and attributes. Brinkman and Duffy compared Gerking samplers, cores, activity traps, and artificial substrates (1996) and found Gerking samples collected significantly more taxa than cores. Hyvonen and Nummi (2000) compared activity traps with corers, finding fewer active invertebrates in core samples. Some of the articles cited below have comparative studies of methods. Is a quantitative sample necessary? A quantitative sampling method collects invertebrates by trapping the column of water and/or the bottom sediments from a known dimension of bottom area. This permits calculating the number of invertebrates per unit area of wetland bottom. Quantitative methods may be particularly useful in assessing the productivity of wetlands in relation to waterfowl production. They are not as necessary
for developing IBIs (Karr and Chu 1999). Examples of quantitative sampling methods for macroinvertebrates are the Gerking box sampler (Gerking 1957, Anderson and Smith 1996); the stovepipe sampler (see Wilding sampler in Welch 1948, Turner and Trexler 1997); and various methods for collecting (Gates et al. 1987) or coring the benthic sediments (Hyvonen and Nummi 2000, Swanson 1978, 1983). Some have used an Ekman grab sampler mounted on a pole. The Gerking box sampler—a quantitative sampler The Gerking box sampler is lowered into the water until the open bottom of the sampler (0.3 m2) is pushed into the sediments leaving the open top projecting above the water’s surface. Everything within the sampler is collected from the sediments, vegetation, and water column. A flat 1 mm mesh plate is slid across the bottom before the sampler is pulled up and drained, and the sample is rinsed into a sieve. The advantages of this device are the quantitative estimates of the invertebrates and the fact that it captures many of the organisms from the benthos, vegetation, and water column. Gerking samplers collect greater abundance and greater numbers of invertebrate taxa than activity traps or artificial substrates (Brinkman and Duffy 1996). The chief disadvantage of the Gerking box is the labor involved in processing the large samples that it collects. In addition, the device is bulky, requiring two people to carry it to the site and a crew of three to four to operate. It is not useful if woody vegetation is present. This method has been used in projects at the Patuxent National Wildlife Refuge (see Appendix B). Core sampler—a quantitative sampler The advantage of using core samplers is the quantitation per unit bottom area of wetland and the shorter collection time. A disadvantage is the fact that core samples contain fewer invertebrate taxa than Gerking samplers or sweep nets (Hyvonen and Nummi 2000, Cheal et al. 1993) and the organisms have to be processed from the mud. Cores
10
sample a smaller bottom area than the Gerking box and they do not capture the motile taxa. The frequently anaerobic benthic sediments of some wetlands would not be expected to have the range of taxa found in other habitats. Cores are appropriate if the goal is to analyze the benthic invertebrates, such as oligochaete worms, benthic molluscs, and chironomids, or if the type of wetland has low water or saturated conditions (see Hershey et al. 1998). Only 2 taxa of chironomids were collected from cores pooled from benthic sediments in depressional wetlands, whereas a mean of 12 taxa were collected by a dipnet method (Helgen et al. 1993). In samples that include benthic sediments, such as cores or stationary samplers, the organisms can be floated from the sediments in dense (30%) sucrose or salt solutions (Anderson 1959, Ritchie and Addison 1991). As much sediment as possible is washed out of the sample with running water on a No. 30 (600 mm) mesh sieve. After water is drained from the residual debris and sediment, the 30% sucrose solution is added to float out the organisms from the residual. This technique is mostly limited to muddy benthic sediment samples that are very difficult to pick. Semiquantitative sampling methods Dipnet or sweep net samples. Dipnetting, also referred to as sweep netting, is probably the most common method for sampling invertebrates in shallow vegetated wetlands (see Appendix C). With consistent, standardized protocols, dipnetting yields semiquantitative data on invertebrate abundances and taxa richness. Without a consistent effort, dipnetting yields only qualitative results. See Appendix B for methods used by different States to produce semiquantitative data with dipnetting. Repeatability is dependent on the standardization of protocols and the training and skill of the field crews. Ways to assure repeatability in dipnetting protocols include:
n Defining the number of sweeps (Minnesota, Florida) n Defining the amount of time for sweeps (Montana, Ohio, Merritt et al. 1996, 1999) n Defining the distance of sweeps and the number (Florida, Maine) n Doing consistently repeated efforts at each site (Minnesota) Dipnetting samples a large area and the range of wetland habitats. Dipnets have been considered a useful method because they capture a high richness of species, comparable to that obtained with the Gerking box sampler (Cheal et al. 1993, Kaminski 1981). Dipnets collect more taxa than are collected by cores or artificial substrates (Mackey et al. 1984), and collected more taxa of chironomids than corers, artificial substrates, or activity traps in Minnesota (Helgen et al. 1993). An advantage of dipnetting is that experienced crews can collect samples quickly over a wide range of habitats. See Appendix C for more details of dipnet procedures. In Florida, 20 0.5-m sweep net efforts are distributed in proportion to the representation of the habitat type, with emphasis on the “productive habitats” (Florida DEP 1994, 1996, and FL SOP). In Minnesota, 3 to 5 sweeps are done twice for each sample, i.e., a total of 6 to 10 sweeps per sample, and 2 samples are collected per wetland (Gernes and Helgen 1999, Helgen and Gernes in press). In Ohio, a 30-minute multihabitat dipnetting is done and invertebrates are handpicked from substrates that could not be sampled by dipnet (Fennessey et al. 1998). Montana samples all habitats in the wetland for 1 minute, 3 to 4 times, depending on the wetland size and complexity, or until at least 300 organisms are collected into one composited sample (Apfelbeck 1999). Merritt, Cummins, and others have used 30-second sweeps with D-frame nets to assess the status of vegetated riparian systems (Merritt et al. 1996b, 1999,
11
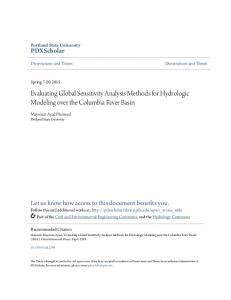
Figure 4: Framed screen for separating vegetation from invertebrates during dipnetting. ½” hardware cloth 12” x 16” screen sits on a pan of water contained in a larger tray. Vegetation is placed on top of the screen and invertebrates are encouraged to drop into water in pan over a period of 10 minutes. Process is done two times for one sample.
Cummins and Merritt in press; Cummins et al. 1999). A time-constrained dipnetting protocol may be difficult when wetlands are particularly mucky or habitats are farther apart. A disadvantage of dipnetting is the amount of vegetation and other debris that gets trapped in the net. This adds greatly to the picking time needed in the lab. Unless debris is removed in the field, it increases the amount of sample that must be preserved. Minnesota reduces the vegetation in samples by laying the net contents on a framed ½” 12” x 16” hardware cloth screen that sits on a pan of water contained in a floatable tray (see Figure 4 and Appendix C). The vegetation is gently teased apart periodically over a 10-minute period and the invertebrates are encouraged to drop into the water in the pan beneath the screen. This process is done twice for one dipnet sample, then the pan of water is poured through 4” cylindrical 200 micron mesh sieves. Florida reduces the amount of vegetation in its multihabitat dipnet samples by washing
it in the net and removing the larger pieces of vegetation, as does Ohio. Some habitats are not amenable to dipnetting, e.g., areas with a lot of woody debris or roots or very dense vegetation, or water that is too shallow. Coring methods may be necessary in very shallow, saturated wetlands or during drought cycles (Hershey et al. 1998). Also, dipnetting tends to miss some of the very motile invertebrates, e.g., the large predatory beetles and bugs. This problem is overcome by combining the use of dipnets and activity traps. Multihabitat dipnetting methods. The multihabitat dipnetting method takes samples from most of the habitats within the wetland. The sampling can be distributed among the habitats in proportion to the habitat type or by other consistent protocols such as time constraints. Training field crews to assess the habitats and to sample consistently using
12
standardized protocols is important. See Appendix C for the variations on the multihabitat method used by Florida, Montana, and Ohio. Advantages of the multihabitat method are that the sample represents the complexity of the wetland and collects most of the invertebrate taxa, except the very motile taxa. Disadvantages of the method are the time needed for processing the large composite sample, or, alternatively, the need to subsample or use a minimum count (e.g., 200 or 300) or organisms (see Appendix C). Multihabitat samples tend to have a lot of vegetation and debris, unless it is removed in the field. Also, wetlands may differ in habitat types (Burton et al. 1999). While it would be preferable to preserve separately the samples from each habitat, for efficiency, the sample is usually a composite of collections from all the habitat types. Separate preservation would require added effort in the field. An advantage of keeping the collections from the habitat types separate would be in the analysis of the data to determine which habitats show the most response to human disturbance.
Activity traps—a semiquantitative method. An activity trap is a passive sampler usually containing a funnel-shaped opening and an enclosed container (jar or cylinder) that receives and traps organisms that swim into the trap. With a funnel opening around 2.5cm diameter, macro-invertebrates can pass into the trap. When placed horizontally in the wetland, activity traps (AT) give semiquantitative data on the motile wetland invertebrates, effectively trapping the motile predators (e.g., the leeches, aquatic beetles, and bugs) better than dipnets (Hilsenhoff 1987b, 1991, Turner and Trexler 1997). They are less suitable for collecting the nonmotile types of invertebrates (Hyvonen and Nummi 2000). Activity traps are variously styled as funnel traps (Swanson 1978, Fennessey et al. 1998, Hanson et al. 2000, Gernes and Helgen 1999, Helgen and Gernes in press, Murkin et al. 1983, Swanson 1978). They are left out at least one night, so the night-active invertebrates swim or crawl into the funnel openings. The style of trap that is used by Minnesota is pictured in Figure 5. Traps used by Minnesota and Ohio EPA are described in Appendix C.
Figure 5: Activity traps used by Minnesota. Ten activity traps are placed horizontally in near shore area of wetlands. a. Trap is held to ½” 4 ft dowel by a sliding bracket of 3" thin wall PVC. A wingnut unites this and the larger bracket that holds the bottle; b. funnel is cut from the top end of a 2 liter beverage bottle. Four grooves 1/8 x 2" are cut into rim of funnel to snap into bottle, c. bottle is held by a 4" PVC open bracket. (see Wik D. in References)
13
Activity traps should be placed in shallow water (