and spectral data from orbiters, new research opportu nities have emerged. ... extend our capabilities to research the deep material of the Moon. To analyze this ...
ISSN 0038�0946, Solar System Research, 2012, Vol. 46, No. 1, pp. 1–17. © Pleiades Publishing, Inc., 2012. Original Russian Text © V.V. Shevchenko, P.C. Pinet, S.D. Shevrel, Y. Dadu, Y. Lu, T.P. Skobeleva, O.I. Kvaratskhelia, K. Rosemberg, 2012, published in Astronomicheskii Vestnik, 2012, Vol. 46, No. 1, pp. 3–20.
Modern Slope Processes on the Moon V. V. Shevchenkoa, P. C. Pinetb, S. D. Shevrelb, Y. Dadub, Y. Lua, T. P. Skobelevaa, O. I. Kvaratskheliac, and K. Rosembergb a
b
Sternberg State Astronomical Institute, Moscow, Russia UMR5562/DTP, Observatory Midi�Pyrínés, Toulouse, France c Abastumani Astrophysical Observatory, Abastumani, Georgia Received March 21, 2011
Abstract—Slope movements of material in lunar craters are investigated based on remote spectral studies car� ried out on board the Clementine spacecraft, and data obtained during the large�scale survey on board the LRO (Lunar Reconnaissance Orbit) spacecraft. The morphological analysis of crater forms based on large�scale images and spectral and spectropolarized assessments of the exposition age (or maturity) of the slope material has led to the conclusion that the formation process of observed outcrops probably is a modern feature. The lower age limit of these structures is estimated at 40–80 years. Thus, slope movements of surface materials can continue at the present time, regardless of the age of the crater studied. Slope movements of crushed gran� ular material lead to fresh outcrops of subsurface layers of marine or continental landscapes and, therefore, extend our capabilities to research the deep material of the Moon. To analyze this phenomenon, craters of 16 and 30 km have been selected. The length of fresh outcrops, while depending strongly on the dimensions of the craters, can be up to several kilometers. In connection with this, the prospect appears of remote analysis of rocks that came to the surface from depths of at least several hundred meters. In this case, there are open� ings for the contact analysis of subsurface material without the use of labor�intensive operations associated with the delivery of equipment for deep drilling to the lunar surface. DOI: 10.1134/S0038094612010066
INTRODUCTION
on the contemporary evolution of the lunar environ� ment. Slope movements of the crushed granular material, resulting in a fresh outcrop of subsurface marine or continental landscapes, extend our capabilities of studying the deep material of the Moon. Since the length of the slope changes depends on the sizes of craters, remote analysis of rocks occurring at depths of at least several hundred meters is possible. When considering the results of experiments per� formed directly in the lunar environment, there are opportunities for the contact analysis of the subsurface material without the use of labor�intensive operations associated with deep drilling. Research results have been obtained on specific examples of high resolution surveys and spectral images currently available. At the same time, con� stantly arriving new information affirms the main con� clusions made in this paper.
A study of the observed changes on the lunar sur� face, some of which can be attributed to contemporary processes, is of exceptional interest. In recent years, when scientists obtained high resolution photographic and spectral data from orbiters, new research opportu� nities have emerged. Prospects have arisen that enable not only tracing the changes caused by shock events but also systematic processes. The latter include the effects of slope movements of surface material on the inner walls of craters. If the first evidence of such land� scape changes, as a rule, were referred to the processes of post impact changes directly related to the crater formation, in some cases the follow�up studies can revise these views. The morphological analysis of cra� ter forms from large�scale images and especially spec� tral and spectropolarized estimates of the expositional age (or maturity) of the slope material, lead to the con� clusion that we observe structures formed over a con� siderable period of time after the moment of the impact crater formation. Based on the examples stud� ied, it is highly probable that similar slope movements of surface materials can continue at the present time, regardless of the age of the object. In addition to stud� ies of the observed rocks themselves, new prospects emerge for the analysis of the processes causing the movement of material. New information is available
SLOPE PROCESSES IN THE CARREL CRATER Apparently, for the first time the signs of slope movements of material on the inner walls of young craters were discovered during the analysis of high res� olution individual images taken on board the orbiting spacecraft Apollo. Figure 1 shows an image of a young, irregularly�shaped Carrel (Jansen B) crater with a 1
2
SHEVCHENKO et al.
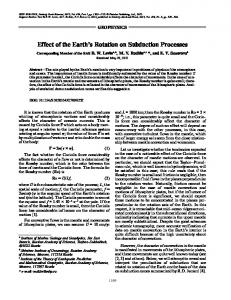
Fig. 1. Image of the Carrel crater (Jansen B) obtained during the orbital survey on board the Apollo�15 spacecraft in 1971 taken by a panoramic camera, photo number 9866 (Apollo..., 1978). Coordinates of the center of the crater longitude 26.7° east and latitude 10.7° north. North is at the top. The frame designates the area of the high resolution image from the LRO spacecraft (Fig. 2).
maximum diameter of about 16 km (Apollo..., 1978). Peculiar kinds of “stains” of the material are observed around the circumference of the inner wall of the cra� ter. The difference in the albedo of the surface out� crops makes it possible to identify the outcrop from different subsurface material. The darker parts indi� cate that slope movements occurred not only from the upper edge of the crater wall, but also at some distance along the wall. From this observation we can conclude that the talus developed at different times and, appar� ently due to powerful forces at various times. Early estimates of the phenomenon are found in the works of K.A. Howard (1973a; 1973b). Given the morphology of the structures and the dimensions of individual details, the author suggested that there is movement in the fine fraction when the coefficient of friction is only 0.2. Important findings of that study consisted of the determination of the nature of move� ment of material similar to fluid flow, and the fact that these changes were observed not so long ago, which distinguishes these processes from the impact event. Later studies by B.R. Hawke and J. L. Whitford� Stark (1982) confirmed the main findings of Howard, with the exception of the coefficient of friction, which according to the calculations of these authors was 0.435 for the flows of fine material in the Carrel (Jan� ssen B) crater. Similar structures on the inner slopes of craters were discovered on the images of Martian craters, taken by the Mars Orbiter spacecraft (Malin and Edgett, 2000). A detailed review of these studies has been published in works of K.J. Kolb et al. (2010a; 2010b).
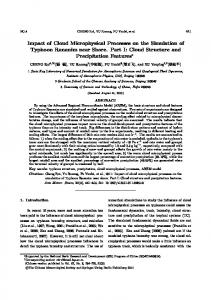
The nature of Martian slope flows is more obvious, since the general opinion of numerous researchers is that melting subsurface ice inclusions are the main contributor to the formation of these debris flows. Currently, thanks to high resolution surveys carried out by the LRO/LROC (Lunar Reconnaissance Orbit/Lunar Reconnaissance Orbit Camera), images of flows of fine material on the inner slopes of the Car� rel crater convey the tiniest details of these entities. Figure 2 shows the assembly of two fragments of images of the central part of the Carrel crater, taken from the LRO spacecraft. According to an estimated elevation change defined by measuring shadows (Lunar chart, 1962), the northern wall of the crater has an average slope angle of about 17°, and the southern wall within the image in Fig. 2 has a slope angle of about 20°. The length of the most significant flows of granular material on the northern slope of the crater range from 2.0 to 2.9 km. On the southern slope flows are less extended and do not exceed 1.9 km. The most extensive structures that manifest slope movements of the material in the north�western sector of the crater wall have a higher albedo. The analysis of large�scale flow images shows that the most recent structures selected by mutual imposition have a higher albedo. With high probability the only natural source of vibrations that cause slope movements of material is seismic events that occur in deep faults, or falling meteorites. If we assume that slope movements of bulk material are triggered by seismic processes, caused by impacts, SOLAR SYSTEM RESEARCH
Vol. 46
No. 1
2012
MODERN SLOPE PROCESSES ON THE MOON
one should pay attention to the young crater which lies to the northwest of the Carrel crater (Fig. 1). The diameter of the crater is 560 m, and its recent origin is confirmed by the presence of a significant field of emissions of high brightness. Characteristically, the most extensive and eye�catching highalbedo flows are found on the slopes, directed toward the specified impact crater. Assuming the genetic relationship between the appearance of an impact crater with the latest talus slope flows, we can estimate the lower limit for the age of these events. The specified impact crater is confi� dently detected in the N5818 image from the photo� graphic lunar atlas, obtained in October 1965 (Kuiper et al., 1967). Thus, the event in question could have happened no less than 44 years ago. This estimate is confirmed by the comparison of the structure of slope flows. Figure 3 contains images of the part of the southern wall of the Carrel crater taken 38 years apart. The images were obtained in approximately the same lighting conditions (at high Sun). Differences in the shooting angle and resolution still make it possible to confidently trace identical details of the slope flows. A detailed comparison of the images shows that for the above period of time no new structures larger than 100–150 m have been formed. Large�scale images of the observed slope flows make it possible to determine the absolute age of the surface using crater statistics methods. However, in the case under consideration, the results are uncertain due to the small diameter of craters and, presumably, the young age of the surface. In works of G.G. Michael and G. Neukum (2010), cases are discussed in detail using the method of crater statistics to determine the age of the tested surface with an uncertainty of at least 0.5 billion years. H. Hiesinger et al. (2011) showed that good agreement between the values of the absolute age of spectrally homogeneous regions of the sea surface, determined using the method of crater statistics, and the radiation age of patterns, is observed in large areas with age values from 2.71 to 3.61 billion years. Robinson et al. (2011), using images taken during the LRO/LROC experiment, built a model depen� dence of the frequency of occurrence of craters with a diameter of less than 100 m for the absolute age of the surface of 33.9 ± 4 million years for continental for� mations of the plains landscape. Developing further the method of determining the absolute age of the surface for the youngest lunar land� scapes, J.B. Plescia and M.S. Robinson (2011) arrived at a number of currently fundamental findings. Given extremely young age features, significant uncertainties may be found in the dependence of the frequency of occurrence of craters, represented by the cumulative number, on the absolute age of the studied structure. The authors found that by introducing into the process very small diameter craters, it is not always possible to clearly distinguish between the objects of primary and secondary origin. As a result, when studying the sur� SOLAR SYSTEM RESEARCH
Vol. 46
No. 1
2012
3
Fig. 2. Assembly of two fragments of images M111422761L and M111422761R, representing the central part of the Carrel crater, selected by a frame in Fig. 1. Image width is 4.82 km. Images were obtained on October 29, 2009, from the LRO spacecraft. Source: http://wms.lroc.asu.edu/lroc.
face, whose age can be determined by age of the sam� ples sent to Earth, the absolute values derived using crater statistics are much greater than the actual values (of the age of the samples of surface rocks). Finally, attempts to calibrate the results of the crater statistics demonstrated substantial uncertainty in the results, especially for the case of the youngest formations. In this respect, data from the direct identification of shock (primary) craters with the estimated time of appearance are of great interest. In works of I.J. Daubar et al. (2011), an analysis is provided of 44 pairs of images obtained at the time on board the Apollo�15 spacecraft and images of the same areas taken on board the LRO spacecraft using a high reso� lution camera. The authors reliably identified five cra� ters with a diameter less than 10 m, which appeared in the area of ~5700 km2 over the last 38–39 years (from 1971 to 2010). It is obvious that these data are not statistically valid, but, assuming the most preliminary assess� ments, shock (primary) craters with a diameter of 10 m can occur over an area of 1000 km2 approxi� mately once in 40 years. However, in general, this assessment confirms the estimated age of appearance of the youngest of slope flows in the Carrel crater, as stated above. The total
4
SHEVCHENKO et al.
Fig. 3. An image fragment obtained from the Apollo�15 spacecraft in 1971 (on the left). The image of the same region of the south� ern wall of the Carrel crater, received from the LRO spacecraft in October 2009 (on the right).
Fig. 4. Fragment of the M111422761L image, showing a part of the slope flow on the southern wall of the Carrel crater. The image width is about 680 m. The original image resolution is 0.5 m/pixel. The image was taken on October 29, 2009, from the LRO spacecraft (NASA, United States). Source: http://wms.lroc.asu.edu/lroc.
area of the investigated flows (Fig. 2) is about 10 km2. With a significant amount of debris fragments on the surface of flows, not a single crater was found with a diameter of more than 3–5 m (the resolution limit of such formations in the images used).
found. The arrows mark possibly later “washouts,” slightly different in albedo. These details do not con� tain large pieces of rock and probably consist of bulk fine�grained material.
As an example, Fig. 4 shows an image fragment containing a part of the slope flow on the southern wall of the crater with a resolution of about 0.5 m/pixel. The total area of the region is about 1.41 × 10⁻³ km2. Among small objects, only shrapnel fragments of stones of up to 5 m, apparently made by the flow, are
THE INVESTIGATION OF SLOPE PROCESSES IN THE REINER CRATER USING DATA FROM THE CLEMENTINE SPACECRAFT Slope processes on the Moon change the optical properties of the primary lunar soil. The main spec� SOLAR SYSTEM RESEARCH
Vol. 46
No. 1
2012
MODERN SLOPE PROCESSES ON THE MOON
5
θ 1.4
Fe, % 18 1
2
3
4
1.2
16 14 12
1.0 10 8
0.8 Fig. 5. The image of the Reiner crater obtained from the board of the Clementine spacecraft. The original image res� olution is 100 m/pixel. Lighting conditions are identical to the full Moon. Source: http://www/mapaplanet.org.
tral/optical effects of space weathering, which changes the structure of the surface layer of regolith are, the reduction of the reflection coefficient, an enhance� ment of the absorption band in the spectral region of 1 µm identifying iron oxides, and the change of the slope of the continuum of the spectrum in the red region (Fischer and Pieters, 1996). P.G. Lucey et al. (1995; 1998; 2000a; 2000b) proposed evaluating the maturity of lunar soils according to the spectral survey of the Clementine spacecraft by the method that uses an inverse correlation of the effects of changes in the concentration of Fe2+ and in the maturity of the sur� face material. The method determines the optical maturity of soil as an optical maturity parameter (OMAT). Using this method, P.C. Pinet et al. (2000) ana� lyzed the spectral structure of the area of the Reiner Gamma albedo anomaly and the Reiner crater on the basis of spectral data from the Clementine spacecraft. Later, V.V. Shevchenko et al. (2007; 2011) conducted a detailed spectral analysis of slope phenomena and material characteristics of fresh outcrops in the Reiner crater. The Reiner crater is located in the western part of the Oceanus Procellarum (305.32° of East longitude and 6.86° of North latitude). The diameter of the Reiner crater is 30 km, its depth reaches 2.4 km, and the height of the central peak is about 700 m. Figure 5 shows the image of the Reiner crater, taken by the Clementine spacecraft, in light conditions that are close to full Moon as seen from Earth. In this case, the difference in the albedo of the surface material is most noticeable. Almost all of the internal walls of the crater slopes, even at a resolution of 100 m, are marked with light material flows from the edge of the wall in the direction of the crater floor. The spectral version of this image was subjected to analysis by the method described by Pinet et al. (2000). SOLAR SYSTEM RESEARCH
Vol. 46
No. 1
2012
6 0.6 0.1
0.3 0.5 0.2 0.4 Optical index of maturity (OMAT)
4 0.6
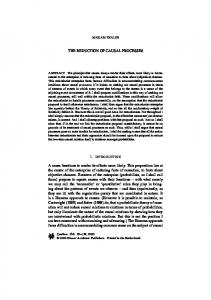
Fig. 6. The statistical distribution of surface areas of the Reiner crater and the surrounding area, varying in soil maturity (OMAT parameter) and the content of Fe (wt %). The value of the angular parameter θ, in radians, (Lucey et al., 1995) defines the optical identification of the Fe content in the surface material. Areas, shown in the dia� gram, refer to slope flows inside the crater.
The purpose of this analysis was to determine the regional distribution of the index of the exposition age and the percentage of iron content in lunar surface soils of the area. The spectral data set was calibrated using previous telescopic spectra by absolute reflection coefficients (Pinet et al., 2000). The spectral indexing of the maturity (exposition age) of the surface material and the iron content were determined according to the method of Lucey et al. (2000b) and our previous stud� ies, based on an independent spectropolarizing method (Shevchenko et al., 1993; 1995; 2003). Figure 6 shows a diagram of the statistical distribu� tion of surface areas of the internal walls of the crater slopes, varying in the value of the maturity of the soil (OMAT parameter) and iron content (wt %). On the diagram, there are four types of surface that character� ize the properties of different slope flows. The bound� aries of the values of the optical maturity parameter were determined by the statistical method on the basis of sizes of the areas of distribution of spectral types. In this case, the technique of multispectral analysis was used. This technique is described in detail in the work of Pinet et al. (2000). Figurs 7 shows the spectral image of the Reiner crater indicating the location of the types of the slope material shown in the diagram (Fig. 6). In order to proceed to the evaluation of the exposi� tion age of these types of surface material, it is first neces� sary to establish the relationship between the optical index of maturity OMAT and the spectropolarization maturity index Isp, which has an easily detectable rela� tionship with the outcrop age (Shevchenko et al., 2003). When using the method described below, it should be
6
SHEVCHENKO et al.
4
1
3
2
Fig. 7. The spectral image of the Reiner crater, in which the distribution of surface types is shown, statistically selected in the dia� gram in Fig. 6.
Fig. 8. The Reiner crater region (mosaic of images from the Clementine spacecraft). SOLAR SYSTEM RESEARCH
Vol. 46
No. 1
2012
MODERN SLOPE PROCESSES ON THE MOON 2.8
7
140 130
2.6
9
120 110 8 100 90
2.2
T, 106 years
Pmax(419 nm)/Pmax(64 nm)
2.4
2.0
80 70 60
7
6
50 5
1.8
40 30 4
1.6
20 3
1
10
2 0 1.2 1.3 1.4 1.5 1.6 1.7 1.8 1.9 2.0 2.1 Isp
1.4
1.2 0.2
Fig. 9. The dependence of the spectropolarization matu� rity index and the optical maturity index OMAT.
Fig. 10. Correlation between the spectropolarization maturity index of the surface material Isp and the exposure age Т (in units of 106 years). The points correspond to samples 1— 12037 (Apollo�12), 2—2001–2004 (Luna�20), 3—74220 (Apollo�17), 4—74240, 74260 (Apollo�17), 5—67701 (Apollo�16), 6—14141 (Apollo�14), 7—67601 (Apollo�16), 8—10010–10011 (Apollo�11), 9—60009, 60010 (Apollo�16).
borne in mind that the region of dependence is of the greatest interest, corresponding to the most immature soils that have a young exposition age. This condition follows from the above properties of the surface material of the studied formations. Since the spectropolarization maturity index Isp = Pmax(0.419 µm)/Pmax(0.641 µm) is sensitive not only to modifications of a spectral nature, but, due to the influence of the polarization properties of fine materials, it also responds to a modification of the structural characteristics of the soil, its use for esti� mating the age of the outcrop is most effective.
area is 5.6 × 5.6 km, which corresponds to the resolu� tion of telescopic observations of the region. Ten regions of the lunar surface have been subjected to such a cross analysis, the basic formations of which presumably have different absolute ages, and the sur� face material is an example of soil of varying maturity. Figure 9 shows a graph of the spectropolarization maturity index and the optical maturity index OMAT, generated on the basis of the above technique of the similarity search. This relation is approximated by an exponential function
0.4 0.5 0.3 Optical index of maturity (OMAT)
0.6
A technique has been developed and applied for optimizing, with higher accuracy, the matching of the spectropolarimetric ground�based measurements (by O.I. Kvaratskhelia (1988)) and regional mosaics of spectral images constructed from images from the Clementine spacecraft. As an example, Fig. 8 shows the area of the Reiner crater. In the image of the crater areas are marked, and a comparison of their optical characteristics gives the best agreement with the refer� ence catalog values of the spectropolarimetric matu� rity index (Shevchenko et al., 2003). The size of each SOLAR SYSTEM RESEARCH
Vol. 46
No. 1
2012
Isp = 0.889 e1.969 ОМАТ
(1)
with the value of the reliability of the approximation R 2 = 0.96. In Fig. 9 the graph of the relationship under con� sideration is extended to the area of highly immature soils, with a view to its further application in the inter� pretation of the properties of fresh slope outcrops. An extrapolation was made using relation (1). The above data allow us to make preliminary assessments of the outcrop age of the spectral types of
8
SHEVCHENKO et al.
Images from the LROC, used for the analysis of slope movements of material No. 1 2 3 4 5 6 7 8 9
Image
Shooting date: day, month, year
hase angle, deg
Resolution, m/pixel
28.12.2009 28.12.2009 07.10.2009 07.10.2009 04.08.2010 04.08.2010 08.07.2010 25.10.2010 25.10.2010
86.90 89.66 10.84 9.42 57.73 54.97 83.76 25.87 23.30
0.71 0.71 0.51 0.51 0.495 0.495 0.70 0.49 0.49
M116676622R M116676622L M109596500L M109596500R M135548391L M135548391R M133187091L M142625106L M142625106R
the surface material. Figure 10 shows a plot of the spectropolarization maturity index Isp and the outcrop age for 15 separate samples of the lunar surface mate� rial, partly merged due to proximity of the original set� tings. The values of the outcrop age of samples were taken from the classical work of R.V. Morris (1978), as well as from the works of Kashkarova et al. (1979), S.R. Taylor (1982), Crozaz (1978), R.H. Becker, R.N. Clayton (1978), and a review The Geologic His� tory of the Moon (1987). The data sets used correlate well with each other with a correlation coefficient of –0.89.
1 2
4
6
5
3
7
9
8
Fig. 11. The imposition of large�scale images from the LRO spacecraft narrow�angle camera on the spectral image of the Reiner crater. The information on the images is shown in the table. Source: http://wms.lroc.asu.edu/lroc.
The relationship shown in Fig. 10 is best approximated by an exponential function − 5.923I
sp (2) T = 358885 e with the value of the reliability of the approximation R 2 = 0.89. Using exponential equations (1) and (2), the extremely young exposure age of the most immature soil can be assessed by the diagram in Fig. 6. For the fourth type of the slope material, this value is unusually small (only 40 × 103 years) in comparison with hitherto known characteristics of the surface material of the Moon. However, it should be noted that according to the spectral image in Fig. 7, data on the optical index OMAT were obtained with a resolution of about 600 × 600 m per pixel. Consequently, some smaller areas of the observed surface may be even younger in terms of exposure age.
INVESTIGATION OF SLOPE PROCESSES IN THE REINER CRATER USING DATA FROM THE LRO SPACECRAFT By means of a narrow�angle camera aboard the LRO spacecraft, several high resolution images were obtained that extended along the orbit during photog� raphy, which show some areas of the development of slope processes within the Reiner crater. The following table provides information about the images that are superimposed on the spectral image of the Reiner cra� ter, obtained using data from the Clementine space� craft. Figure 11 shows a composite image, on which the numbers correspond to serial numbers of images in the table. As shown in the examples above, the material of fresh slope outcrops is characterized by a higher albedo. In large�scale images, obtained by the narrow� angle camera of the LRO spacecraft, areas of slope movements of material appear in different lighting conditions, which generally help to identify the vari� ous features of the outcrop formation. Obviously, the SOLAR SYSTEM RESEARCH
Vol. 46
No. 1
2012
MODERN SLOPE PROCESSES ON THE MOON
9
Fig. 12. Fragment of the M109596500R image, received by the LRO spacecraft. North is at the top. Image dimensions are 502 × 718 m. The arrows mark the most recent slope flows. The image has a resolution capacity of 0.51 m/pixel. Source: http://wms.lroc.asu.edu/lroc.
most notable feature of the freshly exposed material in this case is its age. For the purpose of the preliminary analysis, a frag� ment of the fourth image (see Table) was selected, cor� responding to the northern slope of the crater wall and the area of the fourth type, highlighted in the spectral image (diagram in Figs. 6 and 7). According to the above data, this area of the surface of the slope mate� rial has a high degree of immaturity and, consequently, the lowest exposure age. The fragment described above is shown in Fig. 12. The area of the selected fragment is 360 × 103 m2, which equals the area of one pixel on a spectral image from the Clementine spacecraft. The image was obtained at the topocentric phase angle of 9.42°, which allows us to clearly identify the details with different reflectivity. A simple morphological analysis of mutual overlaps of fine material streams, moving from the edge of the wall in the direction of the crater floor, allows us to identify the most recent struc� tures. In Fig. 12, these flows with the highest bright� ness and overlapping all other structures are indicated by arrows. The width of these formations is about 15– 20 m, and their length is several hundred meters. The nature of the image shows that the average val� ues of soil maturity and, consequently, of the exposure age, may be inflated compared to the most recent for� mations with higher albedo. Thus, for a realistic eval� uation of these parameters, it is necessary to proceed with the characteristics as possibly independent of the SOLAR SYSTEM RESEARCH
Vol. 46
No. 1
2012
resolution of details. For further analysis, we used reflectivity characteristics of soil samples (fine frac� tion) from the work of Le Mouelic et al. (2000), brought to Earth by the Apollo program. The curve 1 in Fig. 13 shows a plot of the reflectivity of spectral types 1–4, outlined above, in the region of 0.750 and 0.950 mm, approximated by an exponential function with the reliability of approximation of 0.99. The relation is extrapolated to the region of high albedo using the approximating exponential function. The curve 2 in Fig. 13 is a similar relationship for a number of samples of lunar fine material, constructed according to Le Mouelic et al. (2000). In this case, the reliability of the approximation is also 0.99. The com� parison of the dependencies obtained shows their identical nature. The differences in the values of the reflectivity show the effect of the difference in the res� olution of measurements results. Thus, to estimate the unknown parameters of the maturity and exposure age of the most recent structures, shown in Fig. 12, one can use the values of reflectivity, obtained by the extrapolation of the relation 1 in the region of high albedo, remaining in the photometric system of the spectral data of the Clementine spacecraft. Modeled in this way, values of the spectral reflec� tance yield a value of the optical maturity index OMAT = 0.73, the value of the spectropolarization matu� rity index Isp = 3.74, and, accordingly, the model exposi� tion age of the fresh surface outcrops of Т ~ 80 years.
10
SHEVCHENKO et al. 0.40 2 0.35
0.30
R950
1 0.25
0.20
0.15
0.10 0.1
0.2
0.3
0.4
R750 Fig. 13. Relation of the reflectivity of the lunar surface areas in the spectral measurement system using data from the Clementine spacecraft (1) to the reflectivity of the lunar soil samples (Le Mouelic et al., 2000) (2) in the region of 0.750 µm (R750) and in the region of 0.950 µm (R950).
Despite the extremely young age of the outcrops studied, compared with the exposure age of typical lunar formations, this estimate is consistent with esti� mates of the age of fresh structures in the Carrel crater presented above within an order of magnitude. IRON CONTENT IN THE SLOPE TALUS OF THE REINER CRATER In the study of fresh outcrops in the Reiner crater, an important feature is the iron content (or FeO) in the surface material. From the diagram in Fig. 6, it fol� lows that with decreasing maturity of the cover mate� rial the iron content increases to 16.5–17.0%. Since we are considering the material of underlying layers, we can conclude that the increase in the iron content is due to the properties of the subsurface material involved in slope processes. In general, the effect of the iron content on the reflectivity, as a major component of the chro� mophore, is characteristic of the lunar rocks. On the scale of the visible hemisphere a close correlation between the iron content and optical properties of the surface material was studied in detail in works of Shku� ratov et al. (1999), where landing sites of space probes and manned spacecraft were used as test areas. These
results were further developed and confirmed in the work of Pieters et al. (2002), where it was shown with high precision that iron�enriched pyroxenes are the most optically active components of the lunar soil. Data from this study once again confirmed that the absorption band of pyroxene of about 1 µm is a reliable parameter for identifying the chemical composition of the lunar surface material by spectral measurements. The above trend of the dependence of the optical properties of the lunar soil on the presence of minerals rich in iron, in general, is confirmed by a comparative analysis of high resolution data, up to the study of indi� vidual samples of fine�grained fraction of the regolith. However, some of the results of a study of the spec� tral survey of the lunar surface from the Clementine spacecraft at a resolution of about 100 m/pixel have revealed the existence of anomalous formations, for which the indicated general trend does not hold. In Shkuratov et al. (2003) photomaps are shown, simu� lating the optical characteristics and the distribution of iron and pyroxene in the surface rocks and the degree of soil maturity in the northwestern part of the visible hemisphere of the Moon using data from the Clemen� tine spacecraft and the results of studies of the samples brought back to Earth. In these images, the Reiner crater is characterized by the high albedo of the inner slopes of the wall with a high content of iron and pyroxene in selected areas, as well as the small model degree of the maturity of local soils. These preliminary findings are confirmed by more detailed study. From Fig. 5 it follows that the high con� tent of iron in the slope flows is coupled with a consid� erable increase in the albedo. According to the spectral image, shown in Fig. 7, the selected spectral type 4 of the covering material at the minimum degree of matu� rity has the highest iron content. As mentioned above, similar features of the covering material of outcrops are abnormal and require special consideration. Spectra of selected types of the slope surface (1–4), normalized to a standard spectral region on the Moon MS2 (Mare Serenitatis 2) (Charette et al., 1974; Pinet et al., 2000), and the value of reflectivity at a wave� length of 0.750 µm, are shown in Fig. 14. For compar� ison, the spectrum (A) of a typical marine�type surface surrounding the Reiner crater is given. A characteristic feature of the normalized spectra (1–4) is a pro� nounced absorption band of pyroxene of about 1 µm, which indicates a high content of iron in the surface material of slope formations. Fig. 15 shows plots of the contents of FeO (in weight percent) and R750 reflectance at a wavelength of 0.750 µm for the fine fraction samples from the col� lection of the Apollo�11, �12, �14–17 spacecraft (Le Mouelic and et al., 2000) and the landing sites of the Luna�16, �20, �24 spacecraft and the Apollo�11, �12, �14–17 spacecraft (Wilcox et al., 2005). For landing sites, the averaged values of FeO were derived accord� SOLAR SYSTEM RESEARCH
Vol. 46
No. 1
2012
MODERN SLOPE PROCESSES ON THE MOON 1.1
11
20 1. Soil samples
18
2. Data from the Clementine spacecraft 3. Slope formations
16 1.0
FeO, %
14
1
0.9
2
12 10 8
3 6
4 А
0.8
4 2 0.10
0.7 0.4
0.5
0.6 0.7 0.8 Wavelength, μm
0.9
ing to the chemical analysis of samples, and the reflec� tivity was determined by spectral measurements on board the Clementine spacecraft. Despite the differ� ences in resolution, the overall trend of dependence of FeO on R750 remains for the measurement series (1) and (2). The dependence (3) is derived from data of spectral measurements for the slope material of the Reiner crater when normalizing by FeO content for the dark cover material, relating to the typical sea sur� face. The relationship (3) is approximated by an expo� nential function with a value of the reliability of approximation of R 2 = 0.979. As can be seen from a comparison of the characteristics of series of measure� ments, given in Fig. 15, the dependence of the reflec� tivity at a wavelength of 0.750 µm on the iron content has a fundamentally different character than the lunar surface of average type. In this case, the increasing brightness of the material combines with the high iron content. The Dionysius crater is morphologically closest to the area in question and its surroundings. In Giguere Vol. 46
No. 1
0.20
0.25 0.30 R750
0.35
0.40
0.45
1.0
Fig. 14. Spectra of types of surface slopes (1–4), normal� ized to a standard spectral region on the Moon MS2 (Mare Serenitatis 2) and the reflectivity at a wavelength of 0.750 µm. The vertical axis represents the intensity values in arbitrary units.
SOLAR SYSTEM RESEARCH
0.15
2012
Fig. 15. Relation of the FeO content (in wt %) and the reflectivity of R750 at a wavelength of 0.750 µm for sam� ples of a fine�grained fraction of samples delivered to Earth by spacecraft Apollo�11, �12, �14–17 (1), as well as by spacecraft Luna�16, �20, �24 and spacecraft Apollo�11, �12, �14–17 (2), and the spectral data obtained from the Clem� entine spacecraft.
et al. (2006), a detailed spectral analysis of individual formations is provided, made on the basis of surveys on board the Clementine spacecraft with a resolution of 100–200 m/pixel. The Dionysius crater is located on the western edge of the Mare Tranquillitatis. It is of impact origin and is one of the newest centers of radial systems. The crater has a diameter of about 18 km, the depth of 2.7 km, and inner slopes of its walls are cov� ered with numerous streams of fine�grained material, similar to those observed in the slope movements of the Reiner crater. According to Giguere et al. (2006), Fig. 16 shows the distribution of FeO (wt %) and opti� cal parameter of maturity OMAT, determined by the method of Lucey et al. (2000b). Points (1) refer to characteristics of the sea surface, formed by Ti�basalts. The cluster of points (2) corresponds to the character� istics of the material emissions, formed by material with a high degree of maturity. The sequence (4) rep� resents the distribution of characteristics typical of lunar formations of average maturity. The point (3) is abnormal. It refers to a small impact crater and relates
12
SHEVCHENKO et al.
Figure 17 shows the altitude profile of the Reiner crater, passing in the north�south direction along image 3 (Table, Fig. 11). The profile is constructed from heights defined by measuring shadows (Lunar chart, 1963). Angles of the northern and southern slopes of the wall are 13°–14°. According to the same data, the eastern slope of the wall (image 7) has the angle of 18°.
20 18 16
FeO, %
14
As indicated above, the internal slopes of the wall of the Carrel crater have about the same angle character� istics, i.e., 17°–20°. For these values Howard (1973a; 1973b) and Hawke et al. (1982) obtained the coeffi� cient of friction of fine material, i.e., ~0.2–0.4.
12 10 8 1
2
4
3
5
6 4 2 0.1
0.3 0.4 0.2 Optical index of maturity (OMAT)
0.5
Fig. 16. Plots of the distribution of FeO (wt %) and the optical parameter of maturity OMAT: (1) sea surface, (2) emission material, (4) typical formations of average matu� rity, (3) characteristics of a small impact crater, (5) areas in the vicinity of the Reiner crater.
to material with a low degree of maturity. The sequence (5) was obtained in the determination of the FeO content and optical parameters of maturity for the studied area of the Reiner crater. For a correct comparison the corresponding values were normalized to the values that characterize the point (3) in the vicinity of the Dionysius crater. As can be seen from a comparison of data in Fig. 16, parts of the surface near the Reiner crater with a high degree of maturity (OMAT ~ 0.15) have the same combination of iron content and exposure age (maturity) as soils of typical formations on the Moon. But on the whole the sequence (5) is anomalous. Its main distinguishing feature is manifested in an increase in the iron content (i.e., pyroxenes) with increasing immaturity of the soil. RESULTS AND DISCUSSION The exposition age of outcrops. The values of the exposition age of fresh outcrops are determined, above all, by the intensity of slope movements of the fine� grained fraction of the surface material. The timeline of these processes depends on the mechanical proper� ties of the soil, which are determined by the coefficient of internal friction at particular slope angles, given by the nature of the local terrain.
Based on the classic provisions of soil mechanics under terrestrial conditions, we can conclude that the closest analogue of the phenomena is the movement of low�cohesive soils (e.g., fine dry sand) in the soil by soil combination (Goldstein, 1973; Dobrov, 2008). In this case, the friction coefficient has a value of