Noninvasive investigation of blood oxygenation dynamics of tumors by near-infrared spectroscopy Hanli Liu, Yulin Song, Katherine L. Worden, Xin Jiang, Anca Constantinescu, and Ralph P. Mason
The measurement of dynamic changes in the blood oxygenation of tumor vasculature could be valuable for tumor prognosis and optimizing tumor treatment plans. In this study we employed near-infrared spectroscopy 共NIRS兲 to measure changes in the total hemoglobin concentration together with the degree of hemoglobin oxygenation in the vascular bed of breast and prostate tumors implanted in rats. Measurements were made while inhaled gas was alternated between 33% oxygen and carbogen 共95% O2, 5% CO2兲. Significant dynamic changes in tumor oxygenation were observed to accompany respiratory challenge, and these changes could be modeled with two exponential components, yielding two time constants. Following the Fick principle, we derived a simplified model to relate the time constants to tumor blood-perfusion rates. This study demonstrates that the NIRS technology can provide an efficient, real-time, noninvasive means of monitoring the vascular oxygenation dynamics of tumors and facilitate investigations of tumor vascular perfusion. This may have prognostic value and promises insight into tumor vascular development. © 2000 Optical Society of America OCIS codes: 170.1470, 170.3660, 170.4580, 170.5280, 290.1990, 290.7050.
1. Introduction
The presence and the significance of tumor hypoxia have been recognized since the 1950’s. There is increasing evidence that tumor oxygenation is clinically important in predicting tumor response to radiation, tumor response to chemotherapy, overall prognosis, or all three. Hypoxic cells in vitro and in animal tumors in vivo are documented to be 3 times more resistant to radiation-induced killing compared with aerobic cells.1 Recent studies show that hypoxia may have a profound impact on malignant progression and on responsiveness to therapy.2,3 Numerous studies on tumor oxygen tension 共pO2兲 measurements have been conducted in recent years by use of a variety of methods, such as microelectrodes,2 phosphors,4 electron paramagnetic resonance,5 or magnetic resonance imaging6 共MRI兲. H. Liu 共
[email protected]兲, Y. Song, L. Worden, and X. Jiang are with the Joint Graduate Program in Biomedical Engineering, University of Texas at Arlington, Arlington, Texas 76109. A. Constantinescu and R. P. Mason are with the Department of Radiology, University of Texas Southwestern Medical Center, Dallas, Texas 75390. Received 16 March 2000; revised manuscript received 25 June 2000. 0003-6935兾00兾285231-13$15.00兾0 © 2000 Optical Society of America
Comparing needle-based, oxygen-sensitive electrodes or electron paramagnetic resonance and MRI for measuring pO2 shows that the latter two offer the advantage of facilitating multiple repeated measurements to map pO2 noninvasively. However, magnets are large, and the methods are not readily portable. A versatile method for monitoring intratumor oxygenation rapidly and noninvasively is therefore very desirable for tumor prognosis and tumor treatment planning. In the near-infrared 共NIR兲 region 共700 –900 nm兲 the major chromophores in tissue are oxygenated hemoglobin and deoxygenated hemoglobin, which differ in their light absorption. Measurements of the absorption of light travelling through the tissue under study allow us to evaluate or quantify blood oxygenation, such as the concentrations of oxygenated hemoglobin 共HbO2兲, and deoxygenated hemoglobin 共Hb兲 and the hemoglobin saturation SO2. In the past decade, three forms of NIR spectroscopy 共NIRS兲 that use pulsed-laser light in the time domain, amplitudemodulated laser light in the frequency domain, and cw light in a dc form were developed for blood oxygenation quantification in tissue.7 Significant investigations in both laboratory and clinical settings by use of NIRS were conducted for noninvasive, quantitative measurements and imaging of cerebral oxygenation8 –12 and blood oxygenation of exercised 1 October 2000 兾 Vol. 39, No. 28 兾 APPLIED OPTICS
5231
muscle13–17 in vivo. Although NIR techniques were used extensively in conjunction with cryospectrophotometry to investigate tumor blood-vessel oxygenation in biopsies,18 only a few reports19 –22 were published on using the NIR techniques for monitoring tumor oxygenation in vivo. In principle, the theoretical model, i.e., the diffusion approximation to the photon transport theory, works well for only large and homogeneous media.23,24 Accurate quantification of tumor oxygenation by use of the NIR approach is limited because of the considerable heterogeneity and the finite sizes of tumors. It is understood and documented25 that the NIR technique used for blood oxygenation monitoring is sensitive to vascular absorption in the measured organ. The NIR method is not limited to measurements of blood oxygenation in arteries 共c.f., pulse oximetry兲 or in veins but interrogates blood in the entire vascular compartment, including capillaries, arterioles, and venules, i.e., the vascular bed. A variety of terms like cerebral oxygenation, tissue hemoglobin oxygenation, and mean hemoglobin oxygenation are used in the literature7,24,26 to indicate this concept. Although tissue hemoglobin oxygenation is not rigorous because hemoglobin molecules are located in only blood, the term is used specifically to differentiate between the hemoglobin saturation in the tissue vascular bed, as measured by the NIR method, and the arterial hemoglobin saturation SaO2, as measured by a pulse oximeter. The goal of this paper is to demonstrate the NIR technique as a real-time, noninvasive means of monitoring hemoglobin oxygenation dynamics, i.e., changes in the concentrations of total hemoglobin 共Hbt兲 and oxygenated hemoglobin 共HbO2兲, in the vascular bed of breast and prostate rat tumors in response to respiratory challenge. Compared with previous NIR studies of tumors in vivo, our approach has the following features: 共1兲 The transmission mode, as opposed to the reflectance mode used by Hull et al.,22 interrogates deeper regions 共central parts兲 of the tumor. 共2兲 Only two wavelengths, as opposed to the spectrum of 300 –1100 nm used by Steen et al.,21 are employed and provide a fast and low-cost instrument. 共3兲 A source– detector separation of 1–2 cm interrogates a large tumor noninvasively, as opposed to the needlelike probe used by Steinberg et al.20 More innovatively, on the basis of the experimental observation of tumor hemoglobin oxygenation dynamics, we developed a tumor hemoperfusion model that provides important insight into tumor blood perfusion. This paper is organized as follows: In Section 2, we describe our animal model, the NIR instrument, and the algorithm for calculations of tumor blood oxygenation. In Section 3, we show experimental results measured from both breast and prostate tumors under respiratory interventions and calculate time constants for the hemoglobin oxygenation dynamics of the tumors. In Section 4, we develop a tumor hemoperfusion model to interpret the experimental data obtained in the tumor-intervention stud5232
APPLIED OPTICS 兾 Vol. 39, No. 28 兾 1 October 2000
ies and to relate the time constants to tumor blood perfusion. Finally, in Section 5, we discuss the results, the future extensions, and the potential uses of the NIR technique as a novel diagnostic–prognostic tool for tumor therapy and cancer research. 2. Materials and Methods A.
Animal Model and Measurement Geometry
NF13762 breast tumor was implanted in adult female Fisher rats, and Dunning prostate adenocarcinoma R3327-AT1 was implanted in adult male Copenhagen rats. The tumors were grown in pedicles27 on the forebacks of the rats until the tumors were approximately 1–2 cm in diameter. Rats were anesthetized with 200-l ketamine hydrochloride 共100 mg兾ml兲 and maintained under general gaseous anesthesia with 33% inhaled O2 共0.3 dm3兾min O2, 0.6 dm3兾min N2O, and 0.5% methoxyflurane兲 through a mask placed over the mouth and nose. Tumors were shaved to improve the optical contact for transmitting light. Body temperature was maintained with a warm-water blanket. In some cases, a fiber-optic pulse oximeter 共Nonin, Inc., Model 8600V兲 that was manufacturer calibrated was placed on the hind foot to monitor arterial oxygenation SaO2, and a fiber-optic probe was inserted rectally to measure temperature. The tumor volume V 共in centimeters cubed兲 was estimated as V ⫽ 共4兾3兲 关共L ⫹ W ⫹ H兲兾 6兴3, where L, W, and H are the three respective orthogonal dimensions. Most measurements were performed with 33% oxygen as inhaled gas to achieve a stable baseline for a period of 5 to 15 min. The inhaled gas was then switched to carbogen 共95% oxygen, 5% carbon dioxide兲 for at least 20 min and then switched back to 33% O2 for approximately 15 min. The complete cycle lasted 1 hour. Sometimes repeated carbogen interventions were performed sequentially to evaluate the reproducibility of the time profiles of the tumors. In certain cases alternative gases were used, as defined in the results and figures, and some rats were sacrificed by KCl-induced cardiac arrest. Figure 1 shows the measurement geometry: Horizontally, the delivering and the detecting fiber bundles were face to face in the transmittance mode, and both were in contact with the tumor surface without hard compression. The separation of the two bundle surfaces was between 1.0 and 2.5 cm, depending on the tumor size. Vertically, the two bundle tips 共with diameters of 0.5 cm兲 were placed around the middle of the tumor. Thus the current setup of the probes provides an optimal geometry for the NIR light to interrogate deep tumor tissue with minimal interference from the foreback of the rat. B.
Near-Infrared Instrument and Data Analysis
As shown in Fig. 1, we used a homodyne frequencydomain photon-migration system28,29 that was capable of determining the amplitude and the phase changes of amplitude-modulated light passing through tumors. In this setup a rf source modulates
Fig. 1. Experimental setup of a one-channel, NIR, frequency-domain IQ instrument for tumor oxygenation measurement. PMT, photomultiplier tube for detecting light; IQ, in-phase and quadrature demodulator for retrieving amplitude and phase information; Low Pass, low-pass filter. The 5-mm-diameter fiber bundles deliver and detect the laser light through the tumor in transmittance geometry.
the light from two laser diodes 共wavelengths of 758 and 782 nm兲 at 140 MHz. The laser light passes through a combined fiber-optic bundle, is transmitted through the tumor tissue, and is collected by a second fiber bundle. The light is then detected by a photomultiplier tube and demodulated with a commercially available in-phase and quadrature 共IQ兲 demodulator chip into its I and Q components. After these components are put through a low-pass filter they can be used to calculate the amplitude and the phase changes caused by the tumor. These steps are expressed mathematically by I共t兲 ⫽ 2A sin共t ⫹ 兲sin共t兲 low ¡ Idc ⫽ A cos共兲 ⫺ A cos共t ⫹ 兲 O pass ⫽ A cos共兲,
C. Calculation for Changes in the Hemoglobin Concentration
(1)
Q共t兲 ⫽ 2A sin共t ⫹ 兲cos共t兲 low ⫽ A sin共兲 ⫹ A sin共t ⫹ 兲 O ¡ Qdc pass ⫽ A sin共兲,
with the NIR data. The experimental uncertainties for arterial saturation and changes in hemoglobin concentrations were calculated by use of the baseline data taken over 5–10 min without respiratory perturbation to the rat. Nonlinear curve fitting based on the Marquardt algorithm30,31 was performed by use of KaleidaGraph.32 The software also provided the errors 共or uncertainties兲 for each fitted parameter, the optimized 2 values, and the fitting correlation coefficient R, together with the goodness of the fit R2.33 The significance of changes was assessed on the basis of Fisher protected-least-significant-difference analysis of variance by use of Statview software.
(2)
⫽ tan⫺1共Qdc兾Idc兲,
(3)
A ⫽ 共Idc2 ⫹ Qdc2兲1兾2,
(4)
where A and are the amplitude and the phase of the detected light, respectively, and is the angular modulation frequency 共⫽2 ⫻ 140 MHz兲. The two laser lights were time shared, and the controlling process and the data acquisition both interfaced through a 12-bit analog-to-digital board 共Real Time Devices, Inc., Model AD2100兲 with a maximum sampling rate of 4 Hz.28 However, slower sampling rates were used in measurements to compensate for experimental noise. Simple time averaging among a few adjacent data points was performed during data analysis to further decrease the noise. However, data smoothing was not applied for 共1兲 calculating the experimental uncertainty 共error bars兲 or 共2兲 fitting the time constants to prevent the fast-changing component from being oversmoothed and overlooked. The pulse-oximeter data were not averaged because they were recorded manually and appear discrete compared
It is well known that the NIRS of tissue can be used to determine the total hemoglobin concentration Hbt and the hemoglobin oxygen saturation SO2 of an organ in vivo.7 When two NIR wavelengths are used 共758 and 782 nm, in this case兲 it is assumed that tissue background absorbance is negligible and that the major chromophores in organs are oxygenated and deoxygenated hemoglobin molecules. In principle, because the IQ system can give both phase and amplitude values, we should be able to obtain absolute calculations of HbO2, Hb, and SO2.7,28 However, given the tumor’s small size and large spatial heterogeneity, it is very difficult to obtain such absolute quantification accurately with conventional algorithms34 that are based on the diffusion approximation. Instead, on the basis of the modified Beer– Lambert law, we can use the amplitude of the light transmitted through the tumor to calculate concentration changes in HbO2, Hb, and Hbt 共expressed as ⌬HbO2, ⌬Hb, ⌬Hbt, respectively兲 of the tumor that are caused by respiratory intervention. These changes can be derived25 and expressed as 共see Appendix A for derivations and justifications兲 ⌬Hb ⫽ Hb共transient兲 ⫺ Hb共baseline兲
冉冊
⫽
冉冊
Ab 2 Ab 2 ⫺ ⑀HbO log 2 At At 2 1 1 2 L共⑀Hb ⑀HbO2 ⫺ ⑀Hb ⑀HbO2兲
1 log ⑀HbO 2
1
1 October 2000 兾 Vol. 39, No. 28 兾 APPLIED OPTICS
,
(5)
5233
⌬HbO2 ⫽ HbO2共transient兲 ⫺ HbO2共baseline兲
冉冊
⫽
冉冊
Ab 1 Ab 1 ⫺ ⑀Hb log At At 1 2 2 1 L共⑀Hb ⑀HbO ⫺⑀ ⑀ Hb HbO2兲 2
2 log ⑀Hb
2
,
(6)
where ⑀Hb and ⑀HbO are extinction coefficients35 of 2 deoxygenated and oxygenated hemoglobin, respectively, at wavelength ; the variable Ab is a constant amplitude of baseline; At is the transient amplitude under measurement; and L is the optical path length between the source and the detector. Using the approach suggested by Cope and Delpy,10 we can express L as L ⫽ DPF ⫻ d, where d is the direct source– detector separation in centimeters and DPF is the ratio between the optical path length and the physical separation and is tissue dependent. The DPF for tumors has not been well studied; for simplicity, we assume the DPF to be 1 in our calculations. The justification for this simplification is given in Section 5. After substituting the extinction coefficients35 at 758 and 782 nm in Eqs. 共5兲 758 758 782 and 共6兲 with values of ⑀Hb ⫽ 0.359, ⑀HbO ⫽ 0.1496, ⑀Hb 2 782 ⫽ 0.265 and ⑀HbO2 ⫽ 0.178, respectively, in units of inverse millimoles times inverse centimeters, we arrive at
⌬Hb ⫽
关7.34 log共 Ab兾At兲758 ⫺ 6.17 log共 Ab兾At兲782兴 , L (7)
⌬HbO2 ⫽ 关⫺10.92 log共 Ab兾At兲758 ⫹ 14.80 log共 Ab兾At兲782兴 , L (8) ⌬Hbt ⫽ ⌬共HbO2 ⫹ Hb兲 ⫽
关⫺3.58 log共 Ab兾At兲758 ⫹ 8.63 log共 Ab兾At兲782兴 , L (9)
where the units are in millimoles. Equations 共7兲 and 共8兲 permit the calculation of changes in Hb and HbO2 that are due to respiratory challenge, respectively, whereas Eq. 共9兲 quantifies a relative increase in the total hemoglobin concentration that is caused by the intervention. The last quantity also reflects a change in blood volume because it is proportional to the total Hb concentration. 3. Results A.
Instrument Drift Tests
The stability of the NIR instrument was tested in terms of baseline drift after a warm-up period of 30 min by use of a tissue phantom25,36 with stable optical properties. Figure 2 shows an example of a phantom measurement that displays the variation of relative changes in apparent HbO2 and Hbt con5234
APPLIED OPTICS 兾 Vol. 39, No. 28 兾 1 October 2000
Fig. 2. Results of a drift test of the NIR instrument by use of a tissue phantom. The thicker solid curve represents relative changes in the oxygenated hemoglobin concentration, i.e., ⌬HbO2, and the thinner solid curve represents relative changes in the total hemoglobin concentration, i.e., ⌬Hbt. ⌬HbO2 and ⌬Hbt were calculated by use of Eqs. 共8兲 and 共9兲, respectively.
centrations, as calculated from Eqs. 共8兲 and 共9兲. In this example, the standard deviations over the entire period of 100 min were less than 0.007 and 0.004 mM, respectively, for ⌬HbO2 and ⌬Hbt. Furthermore, we calculated uncertainties for both of these quantities on the basis of the propagation of errors, and the results are consistent with those shown in Fig. 2. B.
Breast Tumors
Figure 3共a兲 shows the results taken from a breast tumor 共4.5 cm3兲 with a source– detector separation of 1.8 cm. The data were smoothed, and the measurement uncertainties are shown at only discrete locations. The figure shows the relative changes in total hemoglobin concentration ⌬Hbt and oxygenated hemoglobin concentration ⌬HbO2. The arterial Hb saturation was also obtained to show a relatively rapid change in arterial signals when the inhaled gas was switched from 33% O2 to carbogen. Respiratory challenge caused a sharp rise in ⌬HbO2 共 p ⬍ 0.01 after 1 min, p ⬍ 0.0001 by 1.5 min兲 that was followed by a further slow, gradual, but significant, increase over the next 25 min 共 p ⬍ 0.001兲. ⌬Hbt also changed significantly 共 p ⬍ 0.001兲 within the first minute, but the total change was only approximately 10% of that of ⌬HbO2. Given the exponential appearance of the rising part of ⌬HbO2, we used single-exponential and double-exponential expressions to fit the data in the rising portion to better understand and quantify the dynamic features of ⌬HbO2. The unsmoothed data and the fitted curves are shown in Figure 3共b兲. The double exponential appears to give a much better fit, as is confirmed by the respective R values 共0.98 versus 0.81兲. Time constants of 0.18 ⫾ 0.02 min and 27.8 ⫾ 3.9 min were obtained for fast and slow dynamic changes, respectively, in the tumor HbO2 concentration. Figure 4共a兲 was obtained from a second breast tumor 共5.9 cm3兲 with a source– detector separation of 1.6 cm. Here ⌬HbO2 increased rapidly after the ini-
Fig. 3. 共a兲 Results obtained with the NIR instrument from a 4.5-cm3 rat breast tumor while the breathing gas was switched from 33% O2 to carbogen. The thicker solid curve represents ⌬HbO2, the thinner solid curve represents ⌬Hbt, and the dashed curve with the filled circles represents arterial saturation. 共b兲 The unsmoothed data and the fitted curves: The solid curves represent the best fits to the ⌬HbO2 data at the rising portion. The best fit to the two exponential terms is 0.143兵1 ⫺ exp关⫺共t ⫺ 12.5兲兾0.18兴其 ⫹ 0.36兵1 ⫺ exp关⫺共t ⫺ 12.5兲兾27.8兴其, with R ⫽ 0.98, whereas the best fit with one exponential term is expressed as 0.322兵1 ⫺ exp关⫺共t ⫺ 12.5兲兾5.1兴其, with R ⫽ 0.81.
tial gas switch but did not exhibit the continued slow rise afterward. ⌬Hbt was found to increase with carbogen inhalation, although the magnitude was smaller than that of ⌬HbO2 during the period of the intervention. Again, changes in ⌬HbO2 were modeled by a single-exponential term that yielded a time constant of 2.00 ⫾ 0.04 min 共R ⫽ 0.97兲 and by a double-exponential formula with two time constants of 0.8 ⫾ 0.2 min and 3.0 ⫾ 0.3 min 共R ⫽ 0.98兲. In this case both expressions fit the data well, as shown in Fig. 4共b兲. To demonstrate the reproducibility of the dynamic changes in response to respiratory challenge, we subjected one animal to repeat carbogen inhalation. Figure 5共a兲 shows measurements taken from a breast tumor 共6.7 cm3兲 with a source– detector separation of 2 cm. In this case air with 1.2% isoflurane 共anesthetic兲 was used as the baseline instead of 33% O2. This figure shows a very consistent pattern in two repeated time responses with a fast and a slow increase in ⌬HbO2. Here ⌬Hbt shows a similar dy-
Fig. 4. 共a兲 Results obtained with the NIR instrument from a 5.9-cm3 rat breast tumor while the breathing gas was switched from 33% O2 to carbogen. 共b兲 The solid curves show the best fits to the HbO2 data at the rising portion. In this case a double exponential with values of 0.09兵1 ⫺ exp关⫺共t ⫺ 9.8兲兾0.8兴其 ⫹ 0.16兵1 ⫺ exp关⫺共t ⫺ 9.8兲兾3.0兴其, with R ⫽ 0.98, and a single exponential with a value of 0.250兵1 ⫺ exp关⫺共t ⫺ 9.8兲兾2.00兴其, with R ⫽ 0.97, provided similarly good fits.
namic pattern, i.e., a rapid rise followed by a slow continuation. Figures 5共b兲 and 5共c兲 show the unsmoothed data together with the fitted curves for the rising portions of the two repeated increases in ⌬HbO2. Again, the double-exponential expression with two time constants produced much better fits than did the single-exponential term in both processes with two averaged time constants of 1 共mean兲 ⫽ 0.26 ⫾ 0.11 min and 2 共mean兲 ⫽ 8.2 ⫾ 1.8 min. Individual, respective time constants and coefficients are summarized in Table 1. Furthermore, singleexponential and double-exponential expressions were fitted to obtain time constants for the decay processes after the inhaled gas was switched repeatedly back to the baseline conditions. Similarly, the doubleexponential expression fits the data better with two mean time constants of 1decay 共mean兲 ⫽ 0.17 ⫾ 0.07 min and 2decay 共mean兲 ⫽ 12.2 ⫾ 0.7 min for the two decay processes. To further validate our experimental observations, we subjected some rats to cardiac arrest 共with KCl兲 to observe the changes in HbO2 and Hbt on death. Figure 6 shows an example of cardiac arrest on a rat with 1 October 2000 兾 Vol. 39, No. 28 兾 APPLIED OPTICS
5235
5236
APPLIED OPTICS 兾 Vol. 39, No. 28 兾 1 October 2000
4.5 5.9 6.7 6.7 8.2 10.8
Breast 共Fig. 3兲 Breast 共Fig. 4兲 Breast 共Fig. 5兲
Prostate 共Fig. 7兲 Prostate 共Fig. 8兲
Volume 共cm3兲
Type
Tumor
Fig. 5. 共a兲 Relative changes in the HbO2 detected with the NIR instrument from a rat breast tumor 共6.7 cm3兲 while the breathing gas was alternated between air 共21% O2兲 and carbogen. The best fits to the HbO2 data by use of both the double-exponential and the single-exponential expressions for 共b兲 the first and 共c兲 the second respiratory challenges are shown. The fitted equations that were obtained from 共b兲 are 0.232兵1 ⫺ exp关⫺共t ⫺ 19.5兲兾0.18兴其 ⫹ 0.368兵1 ⫺ exp关⫺共t ⫺ 19.5兲兾6.93兴其, with R ⫽ 0.98, and 0.550兵1 ⫺ exp关⫺共t ⫺ 19.5兲兾2.80兴其, with R ⫽ 0.89, respectively. The fitted equations that were obtained from 共c兲 were 0.321兵1 ⫺ exp关⫺共t ⫺ 67兲兾0.332兴其 ⫹ 0.233兵1 ⫺ exp关⫺共t ⫺ 67兲兾9.47兴其, with R ⫽ 0.99, and 0.485兵1 ⫺ exp关⫺共t ⫺ 67兲兾1.38兴其, with R ⫽ 0.81, respectively. 1.8 ⫾ 0.02 0.8 ⫾ 0.2 0.18 ⫾ 0.01 0.332 ⫾ 0.003 0.265 ⫾ 0.007 0.3 ⫾ 4.5
1 共min兲 27.8 ⫾ 3.9 3.0 ⫾ 0.3 6.93 ⫾ 0.09 9.47 ⫾ 0.12 6.02 ⫾ 0.15 15.6 ⫾ 3.1
2 共min兲 0.143 ⫾ 0.003 0.09 ⫾ 0.02 0.232 ⫾ 0.002 0.321 ⫾ 0.001 0.090 ⫾ 0.001 0.004 ⫾ 0.01
A1 共mM兲
0.36 ⫾ 0.03 0.16 ⫾ 0.02 0.368 ⫾ 0.002 0.233 ⫾ 0.001 0.064 ⫾ 0.001 0.38 ⫾ 0.03
A2 共mM兲
0.96 0.96 0.97 0.99 0.93 0.94
R2
0.006 ⫾ 0.001 0.27 ⫾ 0.07 0.026 ⫾ 0.001 0.035 ⫾ 0.001 0.044 ⫾ 0.001 0.02 ⫾ 0.20
1兾2
0.40 ⫾ 0.03 0.56 ⫾ 0.14 0.63 ⫾ 0.01 1.38 ⫾ 0.01 1.41 ⫾ 0.03 0.01 ⫾ 0.03
A1 ␥1 ⫽ ␥2 A2
Double-Exponential Fitting ⌬HbO2 ⫽ A1关1 ⫺ exp共⫺t兾2兲兴 ⫹ A2关1 ⫺ exp共⫺t兾2兲兴
Table 1. Summary of the Vascular Oxygen Dynamics
61.35 ⫾ 0.01 2.11 ⫾ 0.18 24.27 ⫾ 0.01 39.30 ⫾ 0.01 31.95 ⫾ 0.01 0.6 ⫾ 1.2
A 1兾A 2 f1 ⫽ f2 1兾 2
5.1 ⫾ 0.3 2.00 ⫾ 0.04 2.80 ⫾ 0.03 1.38 ⫾ 0.02 1.13 ⫾ 0.02 14.8 ⫾ 1.6
共min兲
0.322 ⫾ 0.005 0.250 ⫾ 0.001 0.550 ⫾ 0.001 0.485 ⫾ 0.001 0.140 ⫾ 0.001 0.37 ⫾ 0.02
A 共mM兲
0.66 0.94 0.80 0.66 0.67 0.94
R2
Single-Exponential Fitting ⌬HbO2 ⫽ A1关1 ⫺ exp共⫺t兾兲兴
Fig. 6. Influence of KCl-induced cardiac arrest on the values of HbO2 and Hbt of a breast tumor 共5.3 cm3兲, while the rat was breathing air.
a breast tumor 共5.3 cm3兲. Both ⌬Hbt and ⌬HbO2 dropped significantly, immediately after KCL was admitted intravenously. Within 1 min ⌬Hbt reached a plateau, whereas ⌬HbO2 decreased rapidly within the first 30 s and then was followed by a slow prolongation. C.
Prostate Tumors
Figure 7共a兲 was obtained from a large prostate tumor 共8.2 cm3兲. In common with the breast tumors, ⌬HbO2 showed a rapid initial increase that was followed by a slower continuation. ⌬Hbt increased rapidly and then reached a plateau. Figure 7共b兲 shows that the double-exponential equation fits the unsmoothed data better 共R ⫽ 0.96兲 than does the singleexponential term 共R ⫽ 0.82兲. Here the fast and the slow time constants are 0.265 ⫾ 0.007 min and 6.02 ⫾ 0.15 min, respectively. Figure 8共a兲 was obtained from another large prostate tumor 共10.8 cm3 with a source– detector separation of 2.5 cm兲. Here ⌬HbO2 displayed a gradual increase throughout the entire period of carbogen inhalation, whereas the increase in ⌬Hbt was considerably delayed. Variations in arterial hemoglobin saturation SaO2 are also shown and were very rapid in comparison with ⌬HbO2, in common with Fig. 3. ⌬HbO2 dropped rapidly when the inhaled gas was switched back from carbogen to 33% O2. Both the single-exponential and the double-exponential expressions were used to obtain time constants for the rising portion of ⌬HbO2 that was due to carbogen intervention. In this case both expressions gave equally good fits, as shown in Fig. 8共b兲 and Table 1. For the decay process, we obtained 1decay ⫽ 0.6 ⫾ 0.2 min and 2decay ⫽ 6.6 ⫾ 1.7 min with R ⫽ 0.94 for the double-exponential fitting, whereas the singleexponential fitting resulted in ⫽ 2.8 ⫾ 0.4 min with R ⫽ 0.88. For comparison the rat was also challenged with 100% O2. In summary, we observed dynamic changes in HbO2 that were due to carbogen intervention for both breast and prostate tumors. In most cases these changes were modeled better by a double-exponential
Fig. 7. 共a兲 Influence of respiratory challenges 共switching from air to carbogen兲 on the values of HbO2 and Hbt of a large rat prostate tumor 共8.2 cm3兲. 共b兲 The best-fitted equations are 0.090兵1 ⫺ exp关⫺共t ⫺ 12兲兾0.265兴其 ⫹ 0.064兵1 ⫺ exp关⫺共t ⫺ 12兲兾6.02兴其, with R ⫽ 0.96, and 0.140兵1 ⫺ exp关⫺共t ⫺ 12兲兾1.13兴其, with R ⫽ 0.82, for the double-exponential and the single-exponential expressions, respectively.
expression with a fast and a slow time constant than they were by a single-exponential fitting. Dynamic changes in arterial saturation preceded those in HbO2. The detailed parameters regarding tumor size, fitted time constants, corresponding magnitudes, and R2 are listed in Table 1. 4. Model for the Blood Oxygenation Dynamics of Tumors
As was shown in Section 3, the temporal changes in HbO2 caused by respiratory challenge can be fitted with an exponential equation that has either one or two time constants 共fast and slow兲. In this section, we further derive and simplify a hemoperfusion model to interpret these time constants and to correlate the experimental findings with the physiology of the tumors. To develop the model, we follow an approach used to measure regional cerebral blood flow 共rCBF兲 with diffusible radiotracers, as originally developed by Kety37 in the 1950’s. The basic model was modified in a variety of ways to adapt it to positron emission tomography studies.38,39 By analogy, we can evaluate tumor hemodynamics such as tumor blood flow 共perfusion兲 by using the respiratory-intervention gas as a tracer. 1 October 2000 兾 Vol. 39, No. 28 兾 APPLIED OPTICS
5237
In Eq. 共10b兲, f and are constants, whereas Ct is a time-dependent variable that is written as Ct共t兲. In principle, the arterial-tracer concentration Ca is a time-varying quantity. If a certain concentration of the arterial tracer is administrated continuously starting at time 0, Ca can be expressed mathematically as a constant value of Ca共0兲 after time 0. Then Eq. 共10b兲 can be solved as Ct共t兲 ⫽ Ca共0兲关1 ⫺ exp共⫺ft兾兲兴.
(11)
Equation 共11兲 indicates that, at time t after the onset of tracer administration, the local tissue 共traditionally brain兲 Ct共t兲 concentration depends on the blood flow f, the arterial time–activity curve Ca共0兲, and the partition coefficient . In response to respiratory intervention, a sudden small change is introduced into the arterial O2 saturation SaO2, and the resulting increase in arterial HbO2 concentration 共⌬HbO2artery兲 can be considered as an intravascular tracer.40 Following Kety’s method and assuming that changes in dissolved O2 are negligible,40 we have d 共⌬HbO2vasculature兲 ⫽ dt
冉
f ⌬HbO2artery ⫺
冊
⌬HbO2vasculature . ␥ (12)
Fig. 8. 共a兲 Variations in SaO2, ⌬HbO2, and Hbt of which the latter two were detected with the NIR instrument, from a large rat prostate tumor 共10.8 cm3兲 during respiratory challenge. 共b兲 The solid curves represent the best fits to the ⌬HbO2 data at the rising portion during carbogen inhalation. The fitted equations are 0.004兵1 ⫺ exp关⫺共t ⫺ 21.5兲兾0.3兴其 ⫹ 0.38兵1 ⫺ exp关⫺共t ⫺ 21.5兲兾15.6兴其 and 0.37兵1 ⫺ exp关⫺共t ⫺ 21.5兲兾14.8兴其 for the double-exponential and the single-exponential expressions, respectively, with R ⫽ 0.97 for both.
In general, the Fick principle can be stated as follows38: The rate of change of tracer concentration in a regional area of an organ equals the rate at which the tracer is transported to the organ in the arterial circulation minus the rate at which it is carried away into the venous drainage, i.e., dCt ⫽ f 共Ca ⫺ Cv兲, dt
(10a)
where f is the blood flow 共or perfusion rate兲, Ct is the tracer concentration in tissue, and Ca and Cv are the time-varying tracer concentrations in the arterial input and the venous drainage, respectively. Ca can be measured from a peripheral artery, but Cv is relatively difficult to obtain regionally. Therefore a brain– blood partition coefficient, ⫽ Ct兾Cv, was developed by Kety, and Eq. 共10a兲 becomes37
冉
冊
dCt Ct . ⫽ f Ca ⫺ dt 5238
(10b)
APPLIED OPTICS 兾 Vol. 39, No. 28 兾 1 October 2000
where f still represents blood flow 共or perfusion rate兲 and ␥ is defined as a vasculature coefficient of the tumor. The coefficient ␥ is the ratio of the HbO2 concentration change in the vascular bed to that in veins and equals 共⌬HbO2vasculature兲兾共⌬HbO2vein兲. This definition implies that a change in the venous blood oxygenation ⌬HbO2vein is proportional to a change in the Hb oxygenation in the vascular bed, ⌬HbO2vasculature. In Eq. 共12兲, f and ␥ are constants, whereas ⌬HbO2vasculature is a time-dependent variable. By analogy to Eq. 共11兲, ⌬HbO2vasculature can be solved rigorously given a constant input H0 for ⌬HbO2artery after time 0. Our data 共Figs. 3 and 8兲 demonstrate that changes in the arterial HbO2 共SaO2兲 are much faster than in the vascular bed. Then solving Eq. 共12兲 leads to ⌬HbO2vasculature共t兲 ⫽ ␥H0关1 ⫺ exp共⫺ft兾␥兲兴.
(13)
Equation 共13兲 indicates that, at time t after the onset of respiratory intervention, the change in oxygenated hemoglobin concentration in the tumor vasculature ⌬HbO2vasculature 共t兲 depends on the blood perfusion rate f, the arterial oxygenation input H0, and the vasculature coefficient of the tumor ␥. As indicated by Eq. 共8兲, our NIR instrument is able to measure an increase in the vascular HbO2 concentration ⌬HbO2vasculature. Equation 共13兲 gives an exponential of the same form as that used to fit our experimental data, indicating that the measured
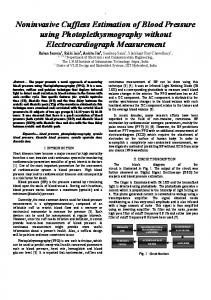
Fig. 9. Schematic diagram showing 共1兲 a tumor model with two vascular perfusion regions, 共2兲 the source and the detector fibers and their geometry with respect to the tumor model, and 共3兲 the light patterns that propagate in the tumor tissue. A represents a portion of the detected signal, which interrogates the well-perfused region, and B represents another portion of the detected signal, which passes mainly through the poorly perfused region. We have assumed that the total detected signal is the sum of A and B.
time constant is associated with the blood perfusion rate f and the vasculature coefficient ␥ of the tumor in the measured area. If the measured volume involves two distinct regions, we then involve with two different blood-perfusion rates f1 and f2, two different vasculature coefficients ␥1 and ␥2, or all four. Here it is reasonable to assume that the measured signal results from both regions, as illustrated in Fig. 9. Consequently, Eq. 共13兲 can be modified with a doubleexponential expression and two time constants as ⌬HbO2vasculature共t兲 ⫽ ␥1 H0关1 ⫺ exp共⫺f1 t兾␥1兲兴 ⫹ ␥2 H0关1 ⫺ exp共⫺f2 t兾␥2兲兴 ⫽ A1关1 ⫺ exp共⫺f1 t兾␥1兲兴 ⫹ A2关1 ⫺ exp共⫺f1 t兾␥2兲兴,
(14)
where f1 and ␥1 are the blood-perfusion rate and the vasculature coefficient, respectively, in region 1, f2 and ␥2 are the same for region 2, A1 ⫽ ␥1 H0, and A2 ⫽ ␥2 H0. The two time constants are equal to 1 ⫽ ␥1兾f1 and 1 ⫽ ␥2兾f2. Then, if A1, A2, and the two time constants are determined from our measurements, we arrive at the ratios for the two vasculature coefficients and the two blood-perfusion rates: ␥1 A1 ⫽ , ␥2 A2
f1 A1兾A2 ⫽ . f2 1兾2
(15)
With these two ratios, we can obtain insight into the tumor vasculature and blood perfusion. For example, a ratio of ␥1兾␥2 near 1 from a measurement implies that the vascular structure of the measured tumor volume is rather uniform. Then the coexistence of two time constants reveals two mechanisms of regional blood perfusion in the tumor. A large time
constant implies slow perfusion through a poorly perfused area, whereas a small time constant indicates fast perfusion through a well-perfused area. In the meantime, the ratio of the perfusion rates in these two areas can also be obtained quantitatively. Furthermore, a ratio of ␥1兾␥2 ⬎ 1 共i.e., A1兾A2 ⬎ 1兲 means that the measured signal results more from region 1 than from region 2 within the measured tumor volume. Therefore, by studying tumor blood oxygenation dynamics and obtaining time constants together with their amplitudes, we can gain important information on regional blood perfusion and vascular structures of the tumor within the measured volume. Our experimental data 共Table 1兲 reveal that all the measurements can be fitted with the doubleexponential model equivalently to or better than the single-exponential fitting. Ratios of 1兾2, ␥1兾␥2, and f1兾f2 are also shown in Table 1 for respective cases. 5. Discussion
Using NIRS, we have measured relative changes in Hbt and HbO2 in breast and prostate rat tumors in response to respiratory intervention. We have observed that respiratory challenge caused the HbO2 concentration to rise promptly and significantly in both breast and prostate tumors but that the total concentration of hemoglobin sometimes increased and sometimes remained unchanged. The dynamic changes of tumor oxygenation can be modeled by either one exponential term with a slow time constant or two exponential terms with fast and slow time constants. This relation suggests that there may be two vascular mechanisms in the tumor that are detected by the NIRS measurement. As indicated by Eqs. 共13兲 and 共14兲, these time constants are inversely proportional to the blood-perfusion rates of the measured volumes of the tumors. Based on the doubleexponential model, determination of the two time constants and their corresponding amplitudes allows us to determine the relations between the two perfusion rates and between the vascular structures, as expressed in Eq. 共15兲. Further investigation with more measured quantities may lead to quantification of each parameter individually by use of the NIR technique. To develop a model for interpreting the NIR data taken during carbogen inhalation, we have defined a vasculature coefficient ␥. It is a proportionality factor between ⌬HbO2vein and ⌬HbO2vasculature, i.e., ⌬HbO2vein ⫽ ⌬HbO2vasculature兾␥. We expect that ␥ depends on 共1兲 the oxygen consumption and 共2兲 the capillary density of the tumor. If the oxygen consumption, the capillary density, or both of the tumor are large, changes in the venous HbO2 concentration will be small; if the oxygen consumption, the capillary density, or both of the tumor are small, changes in the venous HbO2 concentration will be large. Further studies are necessary to learn more about this coefficient and to confirm our speculation. Our current NIR system allows us to quantify the 1 October 2000 兾 Vol. 39, No. 28 兾 APPLIED OPTICS
5239
ratio of ␥兾f by using the single-exponential model or to quantify the ratios of ␥1兾␥2 and f1兾f2 by using the double-exponential model. We can obtain important information on the blood perfusion of the tumor: a large time constant usually represents slow blood perfusion, whereas a small time constant indicates fast blood perfusion. The coexistence of two time constants implies a combination of well-perfused and poorly perfused mechanisms of blood perfusion. Indeed, some tumor lines have only 20% to 85% of vessels perfused.41 Furthermore, tumor structures and oxygen distribution6,42 are highly heterogeneous. Therefore it is likely that our measurement detects a well-perfused region, or a poorly perfused region, or a mixture of both in the tumor, depending on the position or the location of the source and the detector of the NIR instrument. Hull et al.22 reported carbogen-induced changes in rat mammary tumor oxygenation by using spatially resolved NIRS. To compare our results to theirs, we applied our curve-fitting procedure to their published hemoglobin saturation curve and obtained a time constant of 0.27 min 共or 16 s兲 for the rising edge, which is consistent with our fast component. Their data do not show a slow component, suggesting that their measurement was dominated by active tumor vasculature. This difference may be explained as follows: 共1兲 The tumor volume mentioned in the paper by Hull et al.22 was approximately 1.5 cm3, much smaller than the volumes of the tumors that we measured 共in Figs. 3 to 8, the largest tumor was 10.8 cm3, whereas the smallest tumor was 4.5 cm3兲. 共2兲 Their measurement was in reflectance geometry with multiple detectors located at distances 1 to 20 mm away from the source, and in the calculation the tumor was assumed to be homogenous in order to use diffusion theory. Thus their measurement was more sensitive to the superficial area of the tumor, emphasizing the tumor periphery, which is often better vascularized than the central part of the tumor.42,43 The fast component observed in our tumors is consistent with the rapid changes detected in SaO2 in the leg as measured by use of the pulse oximeter, providing further evidence that this relates to the wellvascularized, highly perfused region of the tumor. The data shown in Fig. 8 in this paper are representative of the measurement of a poorly perfused region in which the measured tumor was large and the portion for the fast oxygenation response was small. The data given in Figs. 3–5 and 7 resulted from a mixture of well-perfused and poorly perfused areas in the tumors and exhibited a mixture of fast and slow oxygenation responses to hyperoxygen conditions. It is reasonable to expect that larger tumors have more poorly perfused regions than do smaller tumors. The time constant of the slow component observed here approaches that observed previously for changes in tissue pO2 in an AT1 prostate tumor 5240
APPLIED OPTICS 兾 Vol. 39, No. 28 兾 1 October 2000
measured by use of 19F nuclear magnetic resonance spectroscopy to interrogate interstitial oxygenation.44 In general, well-oxygenated tumor regions had a large and rapid response to respiratory challenge, whereas poorly oxygenated regions were much more sluggish.45 One would indeed expect changes in vascular oxygenation to precede changes in the tissue, and combined investigations by NIRS and nuclear magnetic resonance spectroscopy in the future will provide further insight into the delivery of oxygen to tumors. Dynamic changes in vascular oxygenation have been assessed previously by several other techniques. Following the infusion of Green 2W dye intravenously into EMT-6 tumor-bearing mice, Vinogradov et al.4 were able to image changes in the surface vascular pO2. On switching from air to carbogen inhalation, they observed a very rapid increase in pO2 with a rate similar to the fast component, which we have seen here. Although the phosphorescence method provides vascular pO2, NIR methods generally provide HbO2 or SO2 because there is some uncertainty in the local affinity of hemoglobin for tumor oxygen: the pO2–SO2 dissociation curve is subject to pH, temperature, and other allosteric effectors, such as 2,3-diphosphoglycerate in the immediate milieu. A promising new approach is the blood-oxygen-level– dependent 共BOLD兲 contrast 1H MRI, which is sensitive to vascular perturbations. Robinson et al.46 explored the response to respiratory challenge in various tumors and showed reversible regional changes on switching from air to carbogen inhalation. In common with our NIR data, their changes were often biphasic with a large change occurring within the first 2 min and followed by slower increases.46 However, interpreting the BOLD MRI results is complicated by variations in vascular volume and flow, and there is no direct measure of HbO2 in tumors. The time constants are not source– detector separation sensitive. Equations 共8兲 and 共9兲 have demonstrated that ⌬HbO2 and ⌬Hbt are proportional to 1兾d, where d is the source– detector separation. This relation indicates that a different d value will only stretch or compress the entire temporal profile of ⌬HbO2, but it does not change the transient behavior of the time response. The same argument can apply to the DPF. In this study, we have assumed a DPF ratio of 1 for simplicity. If the DPF value is larger than 1, the values of ⌬HbO2 and ⌬Hbt will decrease by a factor of DPF. But this modification does not affect the time constants 1 and 2, which constitute the dynamic responses of ⌬HbO2 of the tumors to respiratory intervention. Given the evidence for intratumoral heterogeneity from MRI6,46 and histology,47 we believe it will be important to advance our NIR system to have multiple sources, multiple detectors, or both to study not only dynamic but also spatial aspects of blood oxygenation in tumor vasculature. Nonetheless, we believe the preliminary results described here are a proof of principle for the technique, laying a foundation for more extensive tests to correlate tumor size
with the rates of change of HbO2 and Hbt with respect to respiratory challenge. Although Hull et al.22 and we have focused on respiratory challenge, we note that previous NIR studies of tumors also examined the influence of chemotherapy,21 pentobarbital overdose,21 ischemic clamping,20 and infusion of perfluorocarbon blood substitute.19 These studies demonstrate the potential versatility of the NIR approach and its application for diverse future studies. In summary, we have demonstrated that the NIR technology can provide an efficient, real-time, noninvasive means for monitoring vascular oxygenation dynamics in tumors during hyperoxygen respiratory challenge. HbO2 concentrations measured from both breast and prostate tumors often exhibit a prompt rise that is followed by a gradual persistence throughout the intervention. By developing a hemoperfusion model with two exponential terms and fitting the model to the increased HbO2 data, we are able to recognize two mechanisms for blood perfusion in the tumor and to quantify the ratios of the two perfusion rates and those of the two vasculature coefficients. Thus the technique can enhance our understanding of the dynamics of tumor oxygenation and the mechanisms of tumor physiology under baseline and perturbed conditions. Moreover, it appears that the NIRS may have a great potential for monitoring tumor angiogenesis because the method can provide information on blood perfusion and oxygen consumption of the measured tumor. Appendix A A.
⌬HbO2 ⫽ HbO2共transient兲 ⫺ HbO2共baseline兲 ⫽
2 1 ⑀Hb ⌬a1 ⫺ ⑀Hb ⌬a2 , 1 2 2 1 ⑀Hb ⑀HbO ⫺ ⑀Hb ⑀HbO 2 2
where ⌬Hb and ⌬HbO2 refer to the change in the deoxyhemoglobin and the oxyhemoglobin concentrations between the baseline condition and the transient, or perturbed, condition, respectively, and ⌬a represents the change in the absorption coefficient at relative to the baseline condition. However, our current experimental setup with one source and one detector does not provide adequate information for quantifying a values for a solid rat tumor. Thus we take an approximate approach by using the modified Beer–Lambert relation to calculate ⌬Hb and ⌬HbO2. According to the modified Beer–Lambert law,10 an optical density 共OD兲 can be defined as OD ⫽ log共I0兾I兲 ⫽ a L, where I0 and I are the incident and the detected optical intensities, respectively, and L is the optical path length traveled by light inside the tissue. When an organ or a tumor undergoes a change from its baseline condition to a transient condition under physiological perturbations, a change in the OD at wavelength will occur and can be expressed as ⌬OD ⫽ OD 共transient兲 ⫺ OD 共baseline兲 ⫽ log共Ib兾It兲 ⫽ ⌬aL,
1 1 a1 ⫽ ⑀Hb Hb ⫹ ⑀HbO HbO2, 2
(A1)
2 2 a2 ⫽ ⑀Hb Hb ⫹ ⑀HbO HbO2, 2
(A2)
where ⑀Hb , and ⑀HbO are the extinction coefficients 共in 2 inverse centimeters times inverse millimoles兲 of deoxygenated and oxygenated hemoglobin, respectively, at wavelength , and HbO2 and Hb are the oxyhemoglobin and the deoxyhemoglobin concentra and ⑀HbO are constants, changes tions. Because ⑀Hb 2 in HbO2 and Hb in tissue vasculature result in changes in a. In turn, changes in HbO2 and Hb can be determined by measuring changes in a at two wavelengths and can be expressed as
⌬Hb ⫽ Hb共transient兲 ⫺ Hb共baseline兲 ⫽
1 2 ⑀HbO ⌬a2 ⫺ ⑀HbO ⌬a1 2 2 2 Hb
⑀
1 HbO2
⑀
1 Hb
⫺⑀
2 HbO2
⑀
,
(A3)
(A5)
where Ib and It are measured optical intensities under baseline and transient conditions, respectively. Thus we arrive at
Derivation
It has been shown that, in the NIR range, the major light absorbers in tissue are oxygenated and deoxygenated hemoglobin molecules.24,25 With this knowledge, the absorption coefficients 共in inverse centimeters兲 at two wavelengths can be associated with the concentrations of HbO2 and Hb by
(A4)
⌬a ⫽ log共Ib兾It兲兾L.
(A6)
With our current NIR instrument, we can obtain the ratios of 共Ib兾It兲1 and 共Ib兾It兲2 from the tumor measurement. By assuming a constant path length, i.e., L1 共baseline兲 ⬇ L2 共baseline兲 ⬇ L1 共transient兲 ⬇ L2 共transient兲 ⬇ L, we next substitute Eq. 共A6兲 into Eqs. 共A3兲 and 共A4兲 and arrive at Eqs. 共5兲 and 共6兲 for calculations of tumor hemoglobin oxygenation dynamics. Note that Ib, It have been replaced with Ab, At in Eqs. 共5兲 and 共6兲. B.
Justification
The assumption of a constant path length as given above makes it possible to use relatively simple equations, for example, Eqs. 共5兲 and 共6兲, to quantify the ⌬Hb and the ⌬HbO2 of tumors under respiratory intervention. However, in principle, the optical path length L through tissue is wavelength dependent and could be variable under physiological perturbations. Therefore it is useful to know whether the relative error for calculated ⌬Hb and ⌬HbO2 caused by this assumption is within a reasonable range. According to the diffusion approximation, the optical path length L of the NIR light traveling in tissue can be expressed approximately as24 L⫽
冑3 2
d
冉冊 ⬘s a
1兾2
,
1 October 2000 兾 Vol. 39, No. 28 兾 APPLIED OPTICS
(A7) 5241
where d is the source– detector separation and a and ⬘s are the absorption and the reduced scattering coefficients, respectively. Because in the NIR region the ⬘s of tissue is not sensitive to either wavelength or perturbation, we assume that a change in L results from only a change in a, which is both wavelength and perturbation dependent. With this assumption, Eq. 共A7兲 leads to ⌬L 1⌬a . ⫽⫺ L 2a
(A8)
Equation 共A8兲 allows us to determine the relative errors of ⌬L兾L that are caused by 共a兲 the wavelength dependence of a and 共b兲 the perturbation dependence of a in the tumor. For case 共a兲, we calculated this error by using a758 ⫺ a782 2a758 under the baseline and the perturbed conditions; for case 共b兲, we employed a 共transient兲 ⫺ a 共baseline兲 2a 共baseline兲 at both ⫽ 758 nm and ⫽ 782 nm for the error calculation. The a values used here were taken from Hull et al.22 Although the rat tumor used in their study was different from ours, the absorption coefficients of the tumors should be in a similar order and follow a similar dynamic trend. The calculation shows that, with 758 and 782 nm under carbogen perturbation, the maximum value of ⌬L兾L is 12%. This result implies that the assumption of a constant path length that was used for Eqs. 共5兲 and 共6兲 gives rise to a maximal relative error of 12% in L. On the basis of Eqs. 共5兲 and 共6兲 关or Eqs. 共7兲 and 共8兲兴, we arrive at ⌬X兾X ⫽ ⫺⌬L兾L, where X can be ⌬HbO2, ⌬Hb, or ⌬Hbt. Thus the assumption of a constant path length leads to a maximal relative error of 12% for the magnitude of the changes that we detected with regard to respiratory challenge. Although 12% is not completely negligible, the measurement and the calculation with the assumption of a constant path length are still worthwhile. Such an approach makes it possible, as a first-order approximation, to quantify the ⌬Hbt and the ⌬HbO2 of tumors under respiratory intervention, providing deep insight into tumor vascular phenomena and mechanisms of modulating tumor physiology for therapeutic enhancement. This study was supported in part by The Whitaker Foundation RG-97-0083 共H. Liu兲, The American Cancer Society RPG-97-116-010CCE 共R. P. Mason兲, and The Department of Defense Breast Cancer Initiative BC962357 共Y. Song兲. We thank Peter P. Antich and Eric W. Hahn for their continued collegial support. 5242
APPLIED OPTICS 兾 Vol. 39, No. 28 兾 1 October 2000
References 1. L. Gray, A. Conger, M. Ebert, S. Hornsey, and O. Scott, “The concentration of oxygen dissolved in tissues at time of irradiation as a factor in radio-therapy,” Br. J. Radiol. 26, 638 – 648 共1953兲. 2. M. Ho¨ckel, K. Schlenger, B. Aral, M. Mitze, U. Schaffer, and P. Vaupel, “Association between tumor hypoxia and malignant progression in advanced cancer of the uterine cervix,” Cancer Res. 56, 4509 – 4515 共1996兲. 3. T. Y. Reynolds, S. Rockwell, and P. M. Glazer, “Genetic instability induced by the tumor microenvironment,” Cancer Res. 56, 5754 –5757 共1996兲. 4. S. A. Vinogradov, L.-W. Lo, W. T. Jenkins, S. M. Evans, C. Koch, and D. F. Wilson, “Noninvasive imaging of the distribution of oxygen in tissues in vivo using near-infrared phosphors,” Biophys. J. 70, 1609 –1617 共1996兲. 5. J. A. O’Hara, F. Goda, K. J. Liu, G. Bacic, P. J. Hoopes, and H. M. Swartz, “The pO2 in a murine tumor after irradiation: an in vivo electron paramagnetic resonance oximetry study,” Radiat. Res. 144, 222–229 共1995兲. 6. R. P. Mason, A. Constantinescu, S. Hunjan, D. Le, E. W. Hahn, P. P. Antich, C. Blum, and P. Peschke, “Regional tumor oxygenation and measurement of dynamic changes,” Radiat. Res. 152, 239 –245 共1999兲. 7. D. T. Delpy and M. Cope, “Quantification in tissue nearinfrared spectroscopy,” Philos. Trans. R. Soc. London B 952, 649 – 659 共1997兲. 8. M. Fabiani, G. Gratton, and P. M. Corballis, “Noninvasive near-infrared optical imaging of human brain function with subsecond temporal resolution,” J. Biomed. Opt. 1, 387–398 共1996兲. 9. R. Wenzel, H. Obrig, J. Ruben, K. Villringer, A. Thiel, J. Bernarding, U. Dirnagl, and A. Villringer, “Cerebral blood oxygenation changes induced by visual stimulation in humans,” J. Biomed. Opt. 1, 399 – 404 共1996兲. 10. M. Cope and D. T. Delpy, “A system for long-term measurement of cerebral blood and tissue oxygenation in newborn infants by near-infrared transillumination,” Med. Biol. Eng. Comput. 26, 289 –294 共1988兲. 11. B. Chance, E. Anday, S. Nioka, S. Zhou, L. Hong, K. Worden, C. Li, T. Murray, Y. Ovetsky, D. Pidikiti, and R. Thomas, “A novel method for fast imaging of brain function, noninvasively, with light,” Opt. Express 2, 411– 423 共1998兲, http:兾兾www.epubs. osa.org兾opticsexpress. 12. A. M. Siegel, J. A. Marota, J. Mandeville, B. Rosen, and D. A. Boas, “Diffuse optical tomography of rat brain function,” in Optical Tomography and Spectroscopy of Tissue III, B. Chance, R. R. Alfano, and B. J. Tromberg, eds., Proc. SPIE 3597, 252– 261 共1999兲. 13. S. Homma, T. Fukunaga, and A. Kagaya, “Influence of adipose tissue thickness on near-infrared spectroscopic signals in the measurement of human muscle,” J. Biomed. Opt. 1, 418 – 424 共1996兲. 14. M. Ferrari, Q. Wei, L. Carraresi, R. A. De Blasi, and G. Zaccanti, “Time-resolved spectroscopy of the human forearm,” J. Photochem. Photobiol. B: Biol. 16, 141–153 共1992兲. 15. M. Ferrari, R. A. De Blasi, S. Fantini, M. A. Franceschini, B. Barbieri, V. Quaresima, and E. Gratton, “Cerebral and muscle oxygen saturation measurement by a frequency-domain nearinfrared spectroscopic technique,” in Optical Tomography, Photon Migration, and Spectroscopy of Tissue and Model Media: Theory, Human Studies, and Instrumentation, B. Chance and R. R. Alfano, eds., Proc. SPIE 2389, 868 – 874 共1995兲. 16. H. Long, G. Lech, S. Nioka, S. Zhou, and B. Chance, “CW imaging of human muscle using near-infrared spectroscopy,” in Advances in Optical Imaging and Photon Migration, J. G. Fujimoto and M. S. Patterson, eds., Vol. 21 of OSA Trends in
17.
18.
19.
20.
21.
22.
23.
24.
25.
26.
27.
28.
29.
30. 31.
32.
Optics and Photonics Series 共Optical Society of America, Washington, D.C., 1998兲, pp. 256 –259. B. Chance, S. Nioka, J. Kent, K. McCully, M. Fountain, R. Greenfield, and G. Holtom, “Time-resolved spectroscopy of hemoglobin and myoglobin in resting and ischemic muscle,” Anal. Biochem. 174, 698 –707 共1988兲. B. M. Fenton, S. F. Paoni, J. Lee, C. J. Koch, and E. M. Lord, “Quantification of tumor vasculature and hypoxia by immunohistochemical staining and HbO2 saturation measurements,” Br. J. Cancer 79, 464 – 471 共1999兲. H. D. Sostman, S. Rockwell, A. L. Sylva, D. Madwed, G. Cofer, H. C. Charles, R. Negro-Villar, and D. Moore, “Evaluation of BA 1112 rhabdomyosarcoma oxygenation with microelectrodes, optical spectrometry, radiosensitivity, and MRS,” Magn. Reson. Med. 20, 253–267 共1991兲. F. Steinberg, H. J. Ro¨hrborn, T. Otto, K. M. Scheufler, and C. Streffer, “NIR reflection measurements of hemoglobin and cytochrome aa3 in healthy tissue and tumors,” Adv. Exp. Med. Biol. 428, 69 –77 共1997兲. R. G. Steen, K. Kitagishi, and K. Morgan, “In vivo measurement of tumor blood oxygenation by near-infrared spectroscopy: immediate effects of pentobarbital overdose or carmustine treatment,” J. Neuro-Oncol. 22, 209 –220 共1994兲. E. L. Hull, D. L. Conover, and T. H. Foster, “Carbogen-induced changes in rat mammary tumor oxygenation reported by nearinfrared spectroscopy,” Br. J. Cancer 79, 1709 –1716 共1999兲. M. S. Patterson, B. Chance, and B. C. Wilson, “Time-resolved reflectance and transmittance for the noninvasive measurement of tissue optical properties,” Appl. Opt. 28, 2331–2336 共1989兲. E. M. Sevick, B. Chance, J. Leigh, S. Nioka, and M. Maris, “Quantitation of time- and frequency-resolved optical spectra for the determination of tissue oxygenation,” Anal. Biochem. 195, 330 –351 共1991兲. H. Liu, A. H. Hielscher, F. K. Tittel, S. L. Jacques, and B. Chance, “Influence of blood vessels on the measurement of hemoglobin oxygenation as determined by time-resolved reflectance spectroscopy,” Med. Phys. 22, 1209 –1217 共1995兲. S. J. Matcher, M. Cope, and D. T. Delpy, “In vivo measurements of the wavelength dependence of tissue-scattering coefficients between 760 and 900 nm measured with time-resolved spectroscopy,” Appl. Opt. 36, 386 –396 共1997兲. E. W. Hahn, P. Peschke, R. P. Mason, E. E. Babcock, and P. P. Antich, “Isolated tumor growth in a surgically formed skin pedicle in the rat: a new tumor model for NMR studies,” Magn. Reson. Imaging. 11, 1007–1017 共1993兲. Y. Yang, H. Liu, X. Li, and B. Chance, “Low-cost frequencydomain photon migration instrument for tissue spectroscopy, oximetry, and imaging,” Opt. Eng. 36, 1562–1569 共1997兲. H. Y. Ma, Q. Xu, J. R. Ballesteros, V. Ntziachristors, Q. Zhang, and B. Chance, “Quantitative study of hypoxia stress in piglet brain by IQ phase modulation oximetry,” in Optical Tomography and Spectroscopy of Tissue III, B. Chance, R. R. Alfano, and B. J. Tromberg, eds., Proc. SPIE 3597, 642– 649 共1999兲. P. R. Bevington, Data Reduction and Error Analysis for the Physical Sciences 共McGraw-Hill, New York, 1969兲. W. H. Press, B. P. Flannery, S. A. Teukolsky, and W. T. Vetterling, Numerical Recipes 共Cambridge U. Press, Cambridge, 1988兲. KaleidaGraph, Version 3.08 共Synergy Software, 2457 Perkiomen Avenue, Reading, Pa. 19606, 1996兲.
33. J. L. Hintze, NCSS, Version 6.0, User’s Guide II: Statistical System for Windows 共Number Cruncher Statistical Systems, Kaysville, Utah, 1996兲. 34. J. B. Fishkin and E. Gratton, “Propagation of photon-density waves in strongly scattering media containing an absorbing semi-infinite plane bounded by a straight edge,” J. Opt. Soc. Am. A 10, 127–140 共1993兲. 35. W. G. Zijlstra, A. Buursma, and W. P. Meeuwsen-van der Roest, “Absorption spectra of human fetal and adult oxyhemoglobin, deoxyhemoglobin, carboxyhemoglobin, and methemoglobin,” Clin. Chem. 37, 1633–1638 共1991兲. 36. H. Liu, C. L. Matson, K. Lau, and R. R. Mapakshi, “Experimental validation of a backpropagation algorithm for threedimensional breast tumor localization,” IEEE J. Select. Top. Quantum Electron. 5, 1049 –1057 共1999兲. 37. S. S. Kety, “The theory and applications of the exchange of inert gas at the lungs and tissue,” Pharmacol. Rev. 3, 1– 41 共1951兲. 38. H. Watabe, M. Itoh, V. Cunningham, A. A. Lammertsma, P. Bloomfield, M. Mejia, T. Fujiwara, A. K. P. Johes, T. Johes, and T. Nakamura, “Noninvasive quantification of rCBF using positron emission tomography,” J. Cerebr. Blood Flow Metab. 16, 311–319 共1996兲. 39. S. S. Kety, “Cerebral circulation and its measurement by inert diffusible racers,” Israel J. Med. Sci. 23, 3–7 共1987兲. 40. A. D. Edwards, C. Richardson, P. Van Der Zee, C. Elwell, J. S. Wyatt, M. Cope, D. T. Delpy, and E. O. R. Reynolds, “Measurement of hemoglobin flow and blood flow by near-infrared spectroscopy,” J. Appl. Physiol. 75, 1884 –1889 共1993兲. 41. H. J. J. A. Bernsen, P. F. J. W. Rijken, T. Oostendorp, and A. J. van der Kogel, “Vascularity and perfusion of human gliomas xenografted in the athymic nude mouse,” Br. J. Cancer 71, 721–726 共1995兲. 42. R. P. Mason, P. P. Antich, E. E. Babcock, A. Constantinescu, P. Peschke, and E. W. Hahn, “Noninvasive determination of tumor oxygen tension and local variation with growth,” Int. J. Radiat. Oncol. Biol. Phys. 29, 95–103 共1994兲. 43. B. P. J. van der Sanden, A. Heerschap, A. W. Simonetti, P. J. F. W. Rijken, H. P. W. Peters, G. Stuben, and A. J. van der Kogel, “Characterization and validation on noninvasive oxygen tension measurements in human glioma xenografts by 19F-MR relaxometry,” Int. J. Radiat. Oncol. Biol. Phys. 44, 649 – 658 共1999兲. 44. S. Hunjan, R. P. Mason, A. Constantinescu, P. Pescheke, E. W. Hahn, and P. P. Antich, “Regional tumor oximetry: 19F NMR spectroscopy of hexafluorobenzene,” Int. J. Radiat. Oncol. Biol. Phys. 41, 161–171 共1998兲. 45. S. Hunjan, D. Zhao, A. Constantinescu, E. W. Hahn, P. P. Antich, and R. P. Mason, “Tumor oximetry: an enhanced dynamic mapping procedure using fluorine-19 echo planar magnetic resonance imaging,” Int. J. Radiat. Oncol. Biol. Phys. 共to be published兲. 46. S. P. Robinson, F. A. Howe, L. M. Rodrigues, M. Stubbs, and J. R. Griffiths, “Magnetic resonance imaging techniques for monitoring changes in tumor oxygenation and blood flow,” Semin. Radiat. Oncol. 8, 198 –207 共1998兲. 47. B. M. Fenton, “Effects of carbogen plus fractionated irradiation on KHT tumor oxygenation,” Radiother. Oncol. 44, 183–190 共1997兲.
1 October 2000 兾 Vol. 39, No. 28 兾 APPLIED OPTICS
5243