Biogeosciences, 7, 1065–1073, 2010 www.biogeosciences.net/7/1065/2010/ © Author(s) 2010. This work is distributed under the Creative Commons Attribution 3.0 License.
Biogeosciences
Ocean acidification affects iron speciation during a coastal seawater mesocosm experiment E. Breitbarth1,2 , R. J. Bellerby1 , C. C. Neill1 , M. V. Ardelan3 , M. Meyerh¨ofer4 , E. Z¨ollner4 , P. L. Croot4 , and U. Riebesell4 1 Bjerknes
Centre for Climate Research, University of Bergen, Bergen, All´egaten 55, 5007 Bergen, Norway of Chemistry, University of Otago, P.O. Box 56, Dunedin 9054, New Zealand 3 Norwegian University of Science and Technology, Department of Chemistry, 7491 Trondheim, Norway 4 Leibniz Institute of Marine Sciences (IFM-GEOMAR), D¨ usternbrooker Weg 20, 24105 Kiel, Germany 2 Department
Received: 31 May 2009 – Published in Biogeosciences Discuss.: 9 July 2009 Revised: 8 February 2010 – Accepted: 16 February 2010 – Published: 19 March 2010
Abstract. Rising atmospheric CO2 is acidifying the surface ocean, a process which is expected to greatly influence the chemistry and biology of the future ocean. Following the development of iron-replete phytoplankton blooms in a coastal mesocosm experiment at 350, 700, and 1050 µatm pCO2 , we observed significant increases in dissolved iron concentrations, Fe(II) concentrations, and Fe(II) half-life times during and after the peak of blooms in response to CO2 enrichment and concomitant lowering of pH, suggesting increased iron bioavailability. If applicable to the open ocean this may provide a negative feedback mechanism to the rising atmospheric CO2 by stimulating marine primary production.
1
Introduction
Paleoclimate data indicate significant effects from the deposition of iron in aeolian dust on ocean biogeochemistry with feedbacks on global climate (Watson et al., 2000). Studies of artificial and natural iron input have demonstrated iron control of phytoplankton productivity and CO2 drawdown over vast oceanic regions (Boyd et al., 2007; Blain et al., 2007; Pollard et al., 2009) and in coastal upwelling regions (Bruland et al., 2001; Hutchins and Bruland, 1998). Temporal control of iron on phytoplankton productivity was also ob¨ urk et al., 2002). served in a Norwegian fjord system (Ozt¨
Correspondence to: E. Breitbarth (
[email protected])
Iron solubility in surface seawater is low, ranging in the picomolar and low nanomolar levels depending on temperature, and the speciation is largely controlled by organic complexation and photochemical redox processes (Kuma et al., 1996; Sunda and Huntsman, 2003; Kuma et al., 1992; Liu and Millero, 2002). In addition to iron binding organic compounds such as humic and fulvic acids that are generally present in coastal seawater, phytoplankton blooms can affect Fe(III)-complexation, which affects the dissolved Fe fraction and photoreactivity (Croot et al., 2001; Kuma et al., 1992; Rue and Bruland, 1995). Ligand production is generally facilitated via zooplankton and protist grazing, microbial production, and potentially also by phytoplankton cell degradation (Heldal et al., 1996; Barbeau et al., 1996; Hutchins and Bruland, 1994). In return, iron bioavailability to prokaryotic or eukaryotic phytoplankton differs among types of organic iron complexation, such as chelation by siderophores or porphyrins (Hutchins et al., 1999). Fe(III)-complexation is interlinked with Fe(II) production in marine water, mainly via supplying a substrate for photoreduction in sunlit surface ¨ urk et al., 2004; Barbeau et waters (Kuma et al., 1992; Ozt¨ al., 2001, 2003). Other sources of Fe(II) include reduction of colloidal Fe (Wells and Mayer, 1991; Johnson et al., 1994; Rijkenberg et al., 2005), biological Fe(III) reduction (e.g. Maldonado and Price, 2001; Shaked et al., 2004), and suboxic and anoxic deep water as well as sediments (Hopkinson and Barbeau, 2007; Moffett et al., 2007; Breitbarth et al., 2009; Hansard et al., 2009). Fe(II) is generally considered bioavailable but rapid reoxidation to Fe(III) in temperate and tropical waters results in limited concentrations of Fe(II). Half-life times of Fe(II)
Published by Copernicus Publications on behalf of the European Geosciences Union.
1066 range in the order of minutes and are largely dependent on temperature, oxygen and hydrogen peroxide concentrations, and pH (Santana-Casiano et al., 2005; Millero et al., 1987; Millero and Sotolongo, 1989), with presently limited knowledge about the role of organic Fe(II) complexation in natural seawater. However, the contribution of Fe(II) to phytoplankton nutrition may be significant in the open ocean (Roy et al., 2008), continental shelf waters (Ussher et al., 2007), as well as in estuarine waters (Breitbarth et al., 2009). Despite our growing knowledge of iron biogeochemistry in seawater, we currently have little information on the effects of ocean acidification thereon. Seawater pH affects phytoplankton physiology (Fu et al., 2008; Hare et al., 2008; Riebesell, 2004) and thus indirect effects via phytoplankton exudates that complex iron may also alter biological influences on iron solubility and cycling. Further, the photoreduction of organic Fe-ligand complexes is an important pathway for Fe(II) production in the euphotic zone (King et al., 1993) and moreover Fe(II) oxidation rates are strongly pH dependent (e.g. Santana-Casiano et al., 2005). Based on estimates of unabated CO2 emissions, oceanic uptake of anthropogenic CO2 will lower surface ocean pH from a pre-industrial 8.25 to an estimated 7.85 within this century, and further by up to 0.7 units by 2300 (Caldeira and Wickett, 2003; Jacobson, 2005). This change far exceeds any glacial-interglacial differences (Caldeira and Wickett, 2003) and thus may have profound effects on the biogeochemistry of iron in seawater. The Pelagic Ecosystem CO2 Enrichment Study (PeECE III) studied natural phytoplankton blooms under atmospheric CO2 scenarios of 350, 700, and 1050 µatm pCO2 in a coastal mesocosm experiment (Schulz et al., 2008). We used this unique opportunity to study iron chemistry in phytoplankton blooms grown simultaneously at different partial pressures of CO2 . We particularly measured dissolved iron concentrations, as well as Fe(II) levels and oxidation rates over the course of the PeECE III mesocosm study to determine if ocean acidification may affect iron speciation in seawater.
2
Methods
The experimental work was carried out from 15 May through 9 June 2005 at the National Mesocosm Facility located at the Espeland Marine Biological Station at the Raunefjord (60.3◦ N, 5.2◦ E), University of Bergen, Norway. Nine polyethylene (PE) enclosures (2 m diameter, 10 m deep, hereafter called mesocosms), were moored to a raft about 200 m from shore. The enclosures were filled simultaneously by pumping unfiltered fjord water from 13.5 m depth. The mesocosms were capped with gastight and light transparent (95% UV permeability) tents. Atmospheric CO2 concentrations within three mesocosms each were adjusted to 350, 700, and 1050 µatm pCO2 . The water was bubbled at target CO2 until equilibrium was reached (∼2 days). Phytoplankton blooms were initiated with NaNO3 and Na2 HPO4 Biogeosciences, 7, 1065–1073, 2010
E. Breitbarth et al.: Ocean acidification affects iron speciation additions to target concentrations of 16 and 0.8 µmol kg−1 . Daily samples for all parameters except for trace metals, trace gases, dissolved inorganic carbon (DIC), and alkalinity were taken as a bulk sample using a 5m long, ∼6 cm diameter flexible plastic tube to obtain depth integrated values. The pH values are calculated based on daily measurements of total alkalinity (TA) and dissolved inorganic carbon (DIC) in the mesocosm upper mixed layer and are expressed on the total pH scale. TA was measured using the classical Gran electrotitration method (Gran, 1952) (precision ± 4 µmol kg−1 ). DIC was measured by coulometric titration (Johnson et al., 1987) with a precision of 2 µmol kg−1 . Chl-a concentrations were determined using HPLC (Barlow et al., 1997) and particulate organic carbon (POC) was measured on an elemental analyzer (EuroEA 3000, EuroVector) (Ehrhard and Koeve, 1999). Please see Schulz et al. (2008) for more details about the experimental set-up of the PeECE III study and its general experimental outcome, as well as Engel et al. (2005) for a specific description of the mesocosm design and CO2 perturbation technique used. Fe samples were obtained from 2.5 m depth through PTFE tubing using a PE syringe and passed into 50 mL PE vials using a 3-way valve, which allowed for flushing the sampling line by pumping mesocosm water to waste prior to each sampling. The valve and sampling port were protected by plastic bags (Minigrip) at all times. The filled vials were immediately bagged and transported to the lab, where further handling and filtration took place inside a class-100 laminar flow bench. Filtration for dissolved iron analysis was performed using a PTFE vacuum filtration unit and 45 mm 0.2 µm polycarbonate membranes (Whatman). All filters, sampling and filtration equipment were trace metal cleaned by washing with HCl (1 mol L−1 ) and subsequent high purity water (MilliQ) rinses and protected by double bags (Minigrip) for storage and transport. Exposure of the sampling equipment to outside air was kept to the absolute minimum time necessary to perform the sampling at the mesocosms. Total unfiltered iron (tFe) and dissolved iron (dFe, 0.2 µm filtered) measurements were conducted using chemiluminescence flow injection analysis (CL-FIA) (Bowie et al., 1998) using a commercially available CL-FIA instrument (Waterville Analytical, USA) and focused on the period of strong bloom development and pH shifts (days 7–13) and a post bloom measurement (day 23). The instrument was equipped with a 50 cm (1.2 mL) sample loop and no sample preconcentration steps were applied. All reagents used were of high purity (Fluka, trace select or trace select ultra for HCl and NH3 ; Sigma BioUltra for Na2 SO3 ; Sigma Ultra for Na2 CO3 ), with the exception of Luminol (Sigma BioChemika). Purified water (Millipore, MilliQ) was used for all reagent preparations. Calibrations were done using standard additions. A 10 mmol L−1 primary Fe(II) standard solution was prepared from a Merck Titrisol Fe(II) standard in 0.1 mol L−1 HCl. Secondary standards were prepared immediately prior to use by serial dilution of the primary standard www.biogeosciences.net/7/1065/2010/
Fig. 1
Fig. 2
80 70
700
60 50 40
500 300
30 20
100 0
5
10
15
20
25
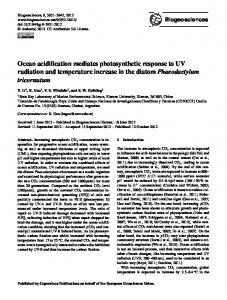
day Fig. 1. Development of pCO2 (dots) and POC (lines) over the course of the mesocosm experiment shown as the mean values of the high (red), mid (grey), and low CO2 (green) treatments. See Schulz et al. (2008) for the complete data set.
using 0.01 mol L−1 HCl. All standard additions were kept below 0.1% volume to reduce the effect of lowering the sample pH to a minimum. Fe(II) was determined based on Croot and Laan (2002) using the same CL-FIA instrument and reagents. For this purpose the instrument was installed inside an instrument shack on the mesocosm raft during days 20 and 22 of the experiment. Similar to the total and dissolved Fe samples, water was collected from 2.5 m depth through PTFE tubing using a PE syringe, which here was immediately followed by 0.2 µm filtration (Whatman polycarbonate membrane) from the collection syringe and injection into the CL-FIA system. The exact time that had passed between sampling and injection into the analyzer was noted and the chemiluminescent signal decay was fitted to an exponential function, which allowed calculation of the Fe(II) concentration at the time of sampling. The Naperian log transformed chemiluminescent signals over time of five successive analysis cycles yield a linear signal decrease and the slope represents the Fe(II) oxidation rate constant (kox s−1 ). Predicted Fe(II) oxidation rates were further calculated based on Millero et al. (1987) after calculating the [OH− ] concentration of the water using the CO2 SYS program (Lewis and Wallace, 1998), taking seawater carbonate chemistry measurements and oxygen concentrations into account. Fe(II) calibration curves were obtained using standard additions on seawater sampled from the respective mesocosms that was aged to allow oxidation of any Fe(II) present. 3
Results and discussion
CO2 perturbation and phytoplankton bloom development resulted in pH values of 7.67–7.97, 7.82–8.06, and 8.13–8.26 at 1050, 700, and 350 µatm pCO2 , respectively during days 3–12 and relatively constant levels thereafter (Figs. 1 and www.biogeosciences.net/7/1065/2010/
8.25
12
8.15
10
8.05
8
7.95
6
7.85
4
7.75
2
7.65
-1
900
pH
100 90 POC (μM)
p CO2 (μatm)
1100
1067
chl-a (μg L )
E. Breitbarth et al.: Ocean acidification affects iron speciation
0 0
5
10
15
20
25
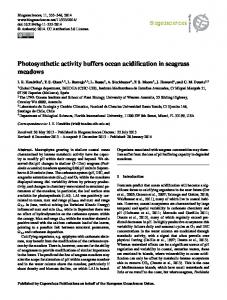
day Fig. 2. Development of pH (dots) and Chl-a (lines) over the course of the mesocosm experiment shown as the mean values of the high (red), mid (grey), and low CO2 (green) treatments. See Schulz et al. (2008) for the complete data set.
2). The peak of the bloom was marked by Chl-a concentrations at days 9 (low CO2 ) and 10 (mid and high CO2 ) and resulted in particulate organic carbon (POC) concentrations that peaked at days 10 (low CO2 , 91.9 µmol L−1 ) and 11 (mid and high CO2 , 98.9 and 97.4 µmol L−1 respectively) (Figs. 1 and 2). Seawater temperature increased over the course of the study from 9.5 ◦ C, peaked at 11.6 ◦ C on day 20 and decreased again to 10.4 ◦ C on day 25, with a most rapid increase from 9.9–11.3 ◦ C between days 14 and 17 (Fig. 3). No significant difference in temperature was found between mesocosm enclosures. Temperature increased from initially 9.5 ◦ C to a peak of 11.6 ◦ C on day 20, after which temperature dropped again to 10.4 ◦ C by day 25 (Fig. 3). In contrast, oxygen saturation, which ranged between 340 and 360 µmol kg−1 on day 3, dropped most prominently during the period of rapid temperature increase and reached lowest levels of 286–305 µmol kg−1 on day 19, with the high CO2 treatments showing elevated oxygen saturation overall (Fig. 3). See Schulz et al. (2008) for more details about the bloom development. The Chl-a and POC biomasses in the three pCO2 treatments are not markedly different. Nevertheless, our experiments show significantly higher dissolved iron (