The 2012 Biomedical Engineering International Conference (BMEiCON-2012)
On the Development of EEG based Emotion Classification Khunawat Luangrat, Yunyong Punsawad and Yodchanan Wongsawat Department of Biomedical Engineering, Faculty of Engineering, Mahidol University, Thailand Email:
[email protected],
[email protected] and
[email protected]
Abstract—This paper proposes an investigation on classification of the positive and negative emotions via the use of electroencephalogram (EEG). EEG bandpowers are extracted as the feature of interest. Two simple decision rules to classify positive and negative emotions are proposed, i.e. 1) using both the left and right frontal information and 2) using only one side of the left or right frontal information. First decision reports low accuracy while the second decision rule can achieve higher accuracy between 80 to 90%. This can be concluded that the proposed method is possible for the realtime emotion classification in neuroeconomics. Index Terms— Electroencephalogram, EEG, Emotion
I. INTRODUCTION Emotion is the expression of mental state that is affected or active by motivation. Factors influenced to emotion consist of mood, temperament, personality behavior, and physiological factors, such as neurotransmitters and hormones. Emotion can be classified into two main groups, i.e. positive and negative. Movie and music are the example of motivation to initiate the positive and negative emotions. Since emotion is controlled by brain, electroencephalogram (EEG) that is the signal that represents electrical activities of the brain is also one possibility to quantitatively investigate the human emotion. Disturbance of auditory and visual can make emotion change to negative and well evaluated via EEG technique in [1]. Furthermore, there are many physiological data such as skin conductance, skin temperature variations, blood pressure and heart rate which can indicate the mental state [2]. Neuroeconomics is the study of the essence of human behavior to economics by employing the human neurophysiological phenomena. Advertisement media is one of the promising neuroeconomic case studies. The good advertisement movies can lead customers to have more attention. Since media is possible to be used as a motivation to influence the emotion. This paper proposes the use of EEG together with the other physiological data to classify the emotion into negative or positive type. Advertisements movie of campaign to abstain from drinking were used for arousal evaluation in two states of emotion, i.e. happy or sad. There are some previous studies on the EEG-based emotion classification of positive and negative emotion. Dan Nie et al studied a relationship between EEG and emotion by using the Oscar movie clips. The emotional content of each
978-1-4673-4892-8/12/$31.00 ©2012 IEEE
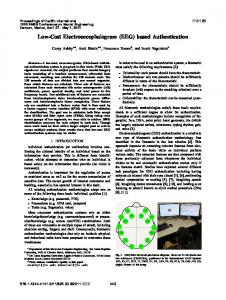
movie clip are compared with the self-assessment manikin (SAM) [3]. Many researches also focus on the feature extraction and classification method for emotion state recognition by following Fig.1. For example, the employing of machine learning algorithms to distinguish EEG signals while subjects are self-reported their emotional states during the music listening. These finding reported high accuracy [4]. Moreover, the use of GA-Fisher classifier and EEG were utilized for emotion classification. It yield a good classification accuracy on four emotions [5]. Furthermore, the combinations of feature extraction and classification methods that are 1) time-frequency analysis method and linear classifiers. 2) K-nearest neighbor (KNN) and linear discriminant analysis (LDA) are used to classify emotions (happy, surprise, fear, disgust, and neutral) via the use of EEG signals. The results show good performance [6]. According to the previous works, EEG can be possibly used for emotion state classification. However, all of researches are off-line emotion classification. This work would like to propose the framework for on-line emotion monitoring for serving the real-time multimedia evaluation in neuroeconomics.
EEG Acquisition
Signal Processing
Positive/Negative Emotion
Feature Extraction
Emotion Classification
Fig. 1. Schematic of EEG-based emotion classification
II. PROPOSED METHODS The proposed methodican be separated into two part, i.e. 1) investigation for EEG electrode placement location, 2) EEG feature extraction and classification methods.
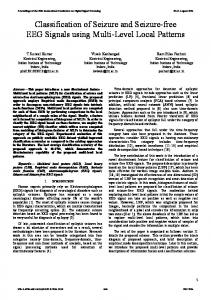
A. Investigation for EEG electrode placement location A.1 Data Acquisition and Signal Processing Four volunteer subjects are used for observing the brain activity during sad and happy states of emotion. Each subject watch sad and happy advertisement movies. A 32channel of EEG amplifiers BIOSEMITM is used for recording the EEG signal with the sampling rate of 2048 Hz. For preprocessing, the acquired signals are down sampling to 256 Hz and then the 3-40Hz digital bandpass filter is applied. The online available EEGLAB software (www.sccn.ucsd.edu/eeglab) is employed to report the graphical color display of the EEG rhythms for each frequency band. A.2 Results According to the average topographic brain mapping among all four subjects (Fig.2), we can easily summarized as in Table I that the right frontal lobe illustrates the difference between happy and sad emotions. TABLE I BRAIN RESPONSE WITH EMOTION STIMULATION
Emotion
EEG Band
Happy
Alpha Beta
Sad
Alpha
Beta
Fig. 2. Topographic brain mapping in EEG band (Alpha, Beta and Gamma) of emotion on Happy and Sad state
B. EEG feature extraction and classification methods B.1 Multimedia Advertisement There are two multimedia advertisements video clips used in this study. The first clip is a comedy about the slow response of the drunken, so this clip is called “happy”. The second clip is about the real accident from the drunken driver. This clip is a sad story, so this clip is called “sad”. Both clips are 45 seconds long.
Brain activity Left Frontal Right Frontal Response Response No response No response
Gamma Alpha
No response No response
No response No response
Beta Gamma
Response No response
Response Response
Happy
Gamma
Sad
Fig. 3. Paradigm of emotion state stimulation
B.2 Data Acquisition EEG data is recorded by BIOPACTM system with the sampling rate of 200 Hz. We use the channels selected according to the Section A.2, i.e. frontal lobe at F3, F4, and use both ears as references. B.3 Feature Extraction Each EEG dataset (while watching happy clip and sad clip) contains 9000 sample (sampling rate = 200 Hz, time = 45 seconds). We can separate the feature of EEG signals into four frequency bands, i.e. theta (4 – 7 Hz), alpha (8 – 13 Hz), beta (14 – 30 Hz) and gamma (35 – 45 Hz). Power spectral density (PSD) via Welch periodogram is used. Before starting, we need to collated baseline value (BL) from EEG in resting period. After that we can record the EEG band power of interest (P) can calculate by as follows: BLi Fj = ¦ PSD(f)
i= ș,ȕ,Į,Ȗ, j=3,4 (1)
Pi Fj = ¦ PSD(f)
i= ș,ȕ,Į,Ȗ, j=3,4 (2)
PSD is a magnitude of power spectrum density. i represents the frequency band, i.e. theta , alpha, beta, gamma. j can be selected as frontal lobe EEG position F3 or F4, and f is the frequency content (Hz).
B.4 Decision making According the topographic brain mappingg, we found that frontal lobe can efficiently distinguish betw ween happy and sad. Therefore, two decision rules aree proposed 1) involvement between left and right frontal annd 2) one side of left or right frontal relation. 1) Involvement between left and right fronntal lobe In the first method, we compare the PSD between b the right and left hemisphere while watching the clipps. We calculate the PSD of the base line every 2 seconds and a calculate the average energy of theta, alpha, beta and gamma. g For the selected happy and sad data, we calculate thhe PSD every 2 seconds and subtract with the base line to finnd the increasing of the energy. Happy data is designed whenn οF3 is higher than οF4. Similarly, Sad data is designed whhen οF3 is lower than οF4 (Table II), ¨F3 = | BLi F3 - Pi F3| ¨F4 = | BLi F4 - Pi F4|
TABLE II A RIGHT FRONTAL THE RESULTS OF INVOLVEMENT BETWEEN LEFT AND
Features Alpha Beta Gamma
Happy
Sad
¨F3 > ¨F4
¨F4 > ¨F3
TAB BLE IV THE RESULTS OF INVOLVEMENT BETTWEEN LEFT AND RIGHT FRONTAL LOBE Emotion
Features
Happy H 3 35% 62.5% 62.5%
Alpha Beta Gamma
Sad 35% 60% 50%
TA ABLE V THE RESULTS OF ONE SIDE OF O LEFT OR RIGHT FRONTAL LOBE Frontal
Feature
LEFT
RIGHT
Emotion Happy
Sad
Alpha Beta
96%
92%
Alpha Beta
84%
80%
According to Table IV, tw wo-class classification accuracy of the first decision rule is approximately 50 % where the maximum accuracy of usiing alpha band is 35%, the maximum accuracy of usingg beta band is 62.5%, and the maximum accuracy of using gamma band is 62.5%. According to Table V, ressults of second decision rule can achieve higher accuracy thaan the first one. The accuracies are ranging between 80 to 96 %. Left and right frontal area of the brain with second decision rule presents a good performance for emotion classsification.
2) One side of left or right frontal lobe We calculate the PSD of the selected dataset. After that we make the comparison between the alpha acctivity in happy state and sad state then compare the beta from fr F3 channel with the same method as shown in Table III. TABLE III THE RESULTS OF INVOLVEMENT BETWEEN LEFT AN ND RIGHT FRONTAL
Features
Happy
Sad
F3
PĮ F3 ( constant )
PĮ F3 ( increase)
F4
Pȕ F4 (constant )
Pȕ F4 ( increase)
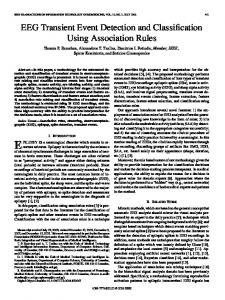
III. EXPERIMENT AND RESULTTS There are six volunteer subjects, 3 meen and 3 women ages between 22 – 24 years old in this study. We start recording a baseline of EEG for 10 seconds as shown in Fig 3. Next, we record the EEG while playing “hhappy” clip, then stop the clip for 1 minute. After that, start to play “sad” clip. Then, redo the experiments again for 5 tim mes for each clip per one subject. For every features (theta, alpha, beta and gamma), we compare the energy of the riight hemisphere (F3) and left hemisphere (F4) of the frontal brain. The data 2 seconds from while watching happy clip was selected for 20 the whole data (40 seconds). Hence, for one o subjects, we have 2 sets of data from happy data and sad data. Experimental setup is shown in Fig. 4.
Fig. 4 Expperimental setup
IV. CONCLUSION N AND FUTURE WORKS In this paper, we have prresented a simple method which can recognize an emotion state that can achieve a high accuracy. The EEG bands caan utilize to extract a EEG signal into each state of emotion .W We can used left or right frontal with second decision for emootion classification. This finding is also synchronized withh the neuroscience since F3
represents the motivation and F4 represents the selective attention index of the brain. The proposed method can be efficiently used in real time emotion state classification in neuroeconomics. More accurate classifier can also be developed. ACKNOWLEDGMENT This work is supported in part by the Thai Health Promotion Foundation and the government funding of Mahidol University, Thailand. REFERENCES [1] N. Dan, et al. EEG-based emotion recognition during watching [2]
[3]
[4] [5]
[6]
movies. 5th International IEEE/EMBS Conference in Neural Engineering (NER), 2011 G. Chanel, K. Ansari-Asl, and T. Pun. Valence-arousal evaluation using physiological signals in an emotion recall paradigm. in Systems, Man and Cybernetics, ISIC. IEEE International Conference on. 2007. L. Mu and L. Bao-Liang. Emotion classification based on gamma-band EEG, Annual International Conference of the IEEE, EMBC in Engineering in Medicine and Biology Society. 2009. L. Yuan-Pin, et al., EEG-Based Emotion Recognition in Music Listening. Biomedical Engineering, IEEE Transactions on. 57(7): p. 1798-1806. Z. Sheng, G. Jie, and C. Zhijie. Analysis of Emotion EEG Classification Based on GA-Fisher Classifier. in Complexity and Data Mining (IWCDM), 2011 First International Workshop on. M. Murugappan, R. Nagarajan, and S. Yaacob. Appraising human emotions using Time Frequency Analysis based EEG alpha band features. in Innovative Technologies in Intelligent Systems and Industrial Applications, 2009. CITISIA 2009.