IOP Conference Series: Materials Science and Engineering
Related content
PAPER • OPEN ACCESS
Optical Properties and Microstructure of Barium Titanate Thin Film (BaTiO3) for Solar Cell Applications To cite this article: A U L S Setyadi et al 2018 IOP Conf. Ser.: Mater. Sci. Eng. 333 012035
- X-Ray Diffraction Study of Barium Titanate Thin Films Kiyoshi Sakaue, Yoshiyuki Takakura, Hikaru Terauchi et al. - Composition Control of Barium Strontium Titanate Thin Films Prepared by Chemical Vapor Deposition Masahiro Kiyotoshi, Kazuhiro Eguchi, Keitaro Imai et al. - Optical and ferroelectric properties of ruthenium-doped BaTiO3 nanocubes Babusona Sarkar, Kaushik Chakrabarti, Kajari Das et al.
View the article online for updates and enhancements.
This content was downloaded from IP address 181.214.191.54 on 06/04/2018 at 13:35
International Conference on Advanced Materials for Better Future 2017 IOP Publishing IOP Conf. Series: Materials Science and Engineering 333 (2018) 012035 doi:10.1088/1757-899X/333/1/012035 1234567890‘’“”
Optical Properties and Microstructure of Barium Titanate Thin Film (BaTiO3) for Solar Cell Applications A U L S Setyadi1, Y Iriani2*, F Nurosyid2 1
Department of Physics, Graduate Program, Sebelas Maret University Surakarta, Indonesia 2 Department of Physics, Faculty of Mathematics and Natural Sciences, Sebelas Maret University, Surakarta, Indonesia *E-mail:
[email protected] Abstract. Barium Titanate thin films were prepared with variations in the number of layers and variation of the solution on a Quartz substrate using the sol-gel method with spin coating technique, at rotation speed 3000 rpm for 30 seconds. The first solution was made with heated and the second with stirred and heated. In this experiment, BaTiO3were heated at 900oC for 2 hours. The characterization of optical properties was performed by UV-Vis spectrometer and microstructural characterization was performed by X-Ray Diffraction (XRD).Variation of layers number affects the intensity of the diffraction peaks. The more layers of the intensity are also greater. The variation of solution making process affects the intensity of diffraction peak. The process of making the solution with stirred and heated has greater intensity than the process of solution by simply heating it. When stirred at the same time heated to produce atoms diffuses more easily with other atoms so the bonds between atoms are more orderly and strong. The process of making the solution in the heated is larger in the crystallite size of than preparation of solution by stirred and heated. The stirred which the solution is produced influences the appearance of the size of the crystal. Variation number of layers influences the absorbance value of layer. The absorbance increases with increasing number of layers. The absorbance of the sample was made with heated the higher than with stirred and heated.
1. Introduction The thin film gave new hope in the development of solar cell devices due to its low cost and good material stability [1][2]. Thin Film can be made with several methods there are vacuum method and nonvacuum method. The vacuum method consists of Pulsed Laser Deposition (PVD), Ablation Laser, ion planting and Chemical Vapour Deposition CVD[1][3]. For nonvacuum methods consisting of electrodeposited, Dip Coating, Spin Coating, Electrophoresis, Screen Printing, Pyrolysis [1], and Chemical Solution Deposition or sol-gel method[3]. The sol-gel method is a way of making the thin film by the sol-gel method above the substrate, then prepared by spin coating at a certain rotational speed. This method is superior because the stoichiometric easily controlled with either [4]. Ferroelectric has material that great potential as a new photovoltaic material, as a driving light and an optical sensor [5]. Material features have included in the ferroelectric material spontaneous polarized regions, the formation of the hysteresis curve (curve relationship between polarization and electric field)[2]. Ferroelectric is a material has a spontaneous polarization in the absence of electric field interference from outside material with Curie Temperature (Tc) [6]. Polarization is the application of the field resulting in the existence of a ferroelectric material. The connection between
Content from this work may be used under the terms of the Creative Commons Attribution 3.0 licence. Any further distribution of this work must maintain attribution to the author(s) and the title of the work, journal citation and DOI. Published under licence by IOP Publishing Ltd 1
International Conference on Advanced Materials for Better Future 2017 IOP Publishing IOP Conf. Series: Materials Science and Engineering 333 (2018) 012035 doi:10.1088/1757-899X/333/1/012035 1234567890‘’“”
electrical polarization and electric field in the sample is indicated by the formation of the hysteresis curve [7]. One of the materials can be used in producing the thin film is Barium Titanate (BaTiO 3). BaTiO3 has an interesting properties that have been used for 60 years that is chemically and mechanically very stable, exhibits ferroelectric properties above room temperature, has Curie temperature 120oC [7], high dielectric constant [8] at room temperature ≥1500, low dielectric loss [2] , enormous band gap energy [8]. Barium titanate is used in applications such as capacitors [2], highdensity multilayer ceramic capacitors [9], Ferroelectric Random Access Memory (FRAM), Dynamic Random Access Memory (DRAM), characteristic of piezoelectric can be used for microactuator and sensor, characteristic of polarizability can be used Nonvolatile Ferroelectric Random Access Memories (NvFeRAMs) [10]. The BaTiO3 ferroelectric material has used as a solar cell material since it generally has a gap energy ± 3 eV and a conductivity of 105 S/cm so that a small band gap can enhance the photovoltaic effect of ferroelectrics [5]. In this study, BaTiO3 was made using Chemical Solution Deposition (sol-gel method) with spin coating process at rotation speed 3000 rpm. Annealing at 400°C was held for 30 minutes, 900°C was held for 2 hours with a heating rate of 5°C/min. The variations have made in this study are a variation of the number of layers and variation of solution making process. The BaTiO3 thin layer is characterized using XRD to obtain crystal structure information. Characterization of BaTiO3 optical properties uses UV-Vis Spectrophotometer. 2.
Experimental
2.1 Preparation of Solutions The materials used in this study were Acetic Acid [(CH3COOH)], Barium Acetate [Ba (CH3COO)2], Titanium Isopropoxide [Ti (C12O4H28)] and Etylen Glycol (HOCH2CH2OH). Preparation of BaTiO3 solution using the sol-gel method with molarity 0.4 M. In the preparation of this solution has two different treatments i.e. first treatment, the solution was made by heated and stirred; second treatment, the solution was made just heated. Step early, Acetic Acetic and Barium Acetate powder are mixed. The solution was heated at 60°C for 30 minutes to obtain a homogeneous solution. Both solutions were added with Titanium Isopropoxide and heated at 60°C for 30 minutes. The third Ethylen Glycol was added to the solution and heated to 60°C for 30 minutes. The solution is heated again at 90oC for 30 minutes.After the BaTiO3 solution was stored for 24 hours, then deposition of the solution above the Quartz substrate by spin coating technique at a rotation speed of 3000 rpm for 30 minutes. To get some layers could be repeated by dripping the solution above the Quartz substrate and then rotated with a predetermined rotation speed. The next step was the sample heated at temperature 120oC for 5 minutes. Then the substrate has been coated, annealing with a temperature of 400oC with a resistance time of 30 minutes, 900oC with a hold time of 2 hours with a heating rate of 5oC/minute. 2.2 Characterization of thin film The Barium Titanate thin film was characterized using XRD equipment, Bruker D8 Advance to obtain crystal structure information with wavelength 1.54184 Ǻ, the increment of 0,1105 and θ of 10o60o. The result of the characterized were data by showing the relationship between 2θ with intensity. Data were plotted in the origin software so that a graph showing the diffraction peaks of the sample appears. The peaks diffraction was compared to the ICDD database so that it could be known that the peaks were the diffraction peaks of the sample. From the diffraction peaks can be known the value of Full Width Of Half Maximum (FWHM), could be known the level of crystallinity, crystallite size, and crystal structure of the sample. The crystallinity level of a material could be determined by following equation (1). Crystallinity = (1)
2
International Conference on Advanced Materials for Better Future 2017 IOP Publishing IOP Conf. Series: Materials Science and Engineering 333 (2018) 012035 doi:10.1088/1757-899X/333/1/012035 1234567890‘’“”
The crystallite size of BaTiO3 thin layer can be calculated using the Scherrer equation in the equation (2) (2) The value of β is the FWHM value, θ is the diffraction angle, k is the Scherrer constant of 0.9, and λ is the wavelength of X-ray. Barium Titanate's optical characterization used UV-Vis spectrophotometer with wavelengths between 200-800 nm. The UV-Vis test result data was plotted in the origin software so that a graph showing the value of the relationship between absorbance and wavelength occurs. The absorbance test was performed to see the thin film absorption spectra of BaTiO3. Spectroscopy used to detect the properties of absorbance, transmittance, and reflectance of thin film BST. The data obtained from these measurements are further processed to obtain the absorbance characteristics of BaTiO3. Absorption in the film takes place through the excitation of electrons from the filled or valence states into an empty state (conduction). 3.
Result and Discussion
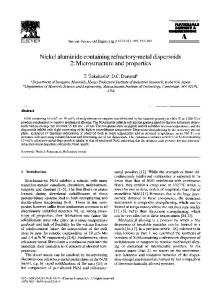
3.1 Microstructure Characterization of microstructure has done using XRD equipment. From the test results obtained in the form of the diffraction pattern was a graph showing the relationship between the intensity (I) with the receding diffraction (2θ). The formation of crystal fields on characterization using XRD is laid with the appearance of peaks of diffraction patterns that have been matched with ICDD databases. The diffraction data of BaTiO3 has been identified with database # 812205.
(a)
(b) Figure 1. Diffraction pattern BaTiO3 variation of (a) layers number (b) solution making process
3
International Conference on Advanced Materials for Better Future 2017 IOP Publishing IOP Conf. Series: Materials Science and Engineering 333 (2018) 012035 doi:10.1088/1757-899X/333/1/012035 1234567890‘’“”
Figure 1 is pattern diffraction BaTiO3 that has matched the database Figure 1 (a) The XRD result for variation of layers number. It is known that there is a peak of BaTiO3 in 3 layers and 5 layers sample marked with a sign (•). The presence of the BaTiO3 peak indicates that the BaTiO3 solution has not fully reacted (not yet homogeneous). Sample 5 layers have peaks of BaTiO 3 appeared more peaks of BaTiO3 3 layers. The number of layers resulted in the more BaTiO3 peaks. The highest intensity in the 3layersand 5layerssample was at the field of BaTiO3 crystals (1 0 1). Quantitatively, the greatest peak intensity based on the variation of the number of layers in each diffraction pattern is shown in table 1. The thinner the number of layers so the higher the intensity of the diffraction peak. Figure 1(b) is diffraction pattern for variation of solution making process. It is known that there is a peak of BaTiO3 in the sample with a sign (•).In stirred samples, more BaTiO3 peaks appear than in heating samples. The temperature at which the solution was produced influences the appearance of the BaTiO3 peak. The intensity of the sample was stirred higher than the heated sample. Quantitatively, the greatest peak intensity in each diffraction pattern based on the variation of the solution was to saw in table 2. When given the effect of stirrer on the sample make it can increase the intensity of diffraction peak. When it was heated and stirred the solute atoms can diffuse from one to the other so that the reaction can occur perfectly and the atoms were arranged regularly [12]. Table 1. Intensity field (1 0 1) for variation of layers number Number of Layers
Intensity (Count)
3 Layers
2053
5 Layers
2305
Table 2. Intensity of 5 layers for variation of solution making process Solution Treatment
Intensity (Count)
Heated and Stirred [BaTiO3 (0 0 1 )]
3547
Heating [BaTiO3 (1 0 1)]
2305
The crystallinity level of a material could be determined by following equation (1). The BaTiO3 sample with the number of layers was 5 layers with the preparation of the heated solution has a crystallinity rate of 55%. Samples 3 layers made with heated have a crystallinity level of 45%. Sample 5 layers made with heated and stirred solution has a crystallization rate of 65%. From the calculation of the level of crystallinity, sample 5 layers, preparation with heated and stirred solution have the highest level of crystallinity, the second largest sequence in the 5 layer sample with heated. The lowest crystallinity value in the sample was 3 layers made by the heated solution. This proved to be stirring and heating during manufacture. Heating and stirring cause the atom to diffuse more easily with other atoms so that the bonds between atoms are more orderly and stronger. The crystallite size of the BaTiO3 thin layer can be calculated using the Scherrer equation in the equation (2) showing the connection between FWHM and crystallite size (D) of each sample with the variation number of different layers and the variation made of the solution. The FWHM value of the BaTiO3 sample is calculated by the origin software used to calculate the crystallite size. The result of BaTiO3 crystallite size calculation can be seen in table 3. Based on the table. 3 it can be seen that the size of the crystal with the variation number of layers of 3 layers is greater than the 5 layers. The value of crystallite size with the variation of preparation the solution 5 layers with stirred and heated is bigger than the sample with heated so that the making of the solution with heated is better than the preparation of the solution by stirred and heated.
4
International Conference on Advanced Materials for Better Future 2017 IOP Publishing IOP Conf. Series: Materials Science and Engineering 333 (2018) 012035 doi:10.1088/1757-899X/333/1/012035 1234567890‘’“”
Table 3. Crystallinity, FWHM and Crystallite size of BaTiO3 thin films Sample 5 Layer Stirred and Heated
Crystallinity (%) 65
FWHM 0,356449
Crystallite Size (nm) 3,960
5 Layer heated
55
0,366766
3,927
3 layer heated
45
0,331099
4,347
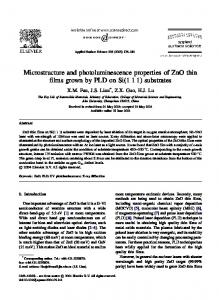
3.2 Optical properties Figure 2 shows the absorption spectra of the BaTiO3 films, (a) variation number of layers (b) variation of solution making process. The results of the absorbance characterization in Fig. 2 (a) show that the sample with maximum layers of 5 layers absorbs light in the range 300-345 nm has a peak of 0.891 and minimum the absorbs light in the range 770-800. Samples with a maximum number of layers of 3 layers absorbing light in the range 300-335 nm have a minimum peak of 0.72999 absorbing light in the range 770-800. Figure 2 (b) shows that the sample with the number of layers 5 layers made by heated solution, maximum absorbing the light in the range 300-345 nm has a peak of 0.8691 and the minimum absorbance the light in the range 770-800. Samples with 5 layers made by stirred and heated solution have maximum absorbance light in the 360-380 nm range and have peak 0.14873, minimum absorbing light in the range 200-230. The sample 5 layers preparation with stirred and heated solution shows different absorbance values. The sample 5 layers preparation with the stirred and heated solution have a small absorbance value. This indicates that the stirred at which the solution was made has an effect on the absorbance value. The heating during the preparation of the solution allowed the solution to be homogeneous so that in the sample with the stirred solution it was suspected to be homogeneous.
(a) (b) Figure 2. Graph of absorbance BaTiO3 (a) variation of layers number (b) variation of solution making process At the point of maximum absorbance shows that the electron cannot absorb energy at that wavelength so that the given energy was simply passed only [13]. As the number of layers increases, the absorbance of the BaTiO3 layer increases, so the absorbance increases with layer thickness. The
5
International Conference on Advanced Materials for Better Future 2017 IOP Publishing IOP Conf. Series: Materials Science and Engineering 333 (2018) 012035 doi:10.1088/1757-899X/333/1/012035 1234567890‘’“”
gap energy is analyzed to determine whether the material are a conductor, a semiconductor or an insulator [13]. 4.
Conclusion
Based on the result of the penetration done, it can be concluded that the variation of layers number and variation of solution making process has an effect on BaTiO3 microstructure and absorbance. Variation of layers number affects the intensity of the diffraction peaks. The more layers of the intensity are also greater. The variation of solution making the process affects the intensity of diffraction peak. The process of making the solution with stirred and heated has greater intensity than the process of the solution by simply heating it. When stirred at the same time heated to produce atoms diffuses more easily with other atoms so the bonds between atoms are more orderly and strong. The process of making the solution in the heated is larger in the crystallite size of than preparation of solution by stirred and heated. The stirred which the solution is produced influences the appearance of the size of the crystal. Variation number of layers influences the absorbance value of layer. Absorbance increases with increasing number of layers. The absorbance of a sample was made with heated the higher than with stirred and heated. References [1] Irzaman, Putra I R, Aminullah, Syafutra H, Alatas H. 2016. Science Direct. 33 607 – 614. [2] Vijatovic M M, Bobić J D, Stojanović B D.2008. History and Challenges of Barium Titanate Science of Sintering. 40 155-165. [3] Iriani Y, Jamaludin A, Nurhadi A. 2016. J. Physics. 776 [4] Iriani Y, Saputri D F, Hadiati S, Ramelan A R, Variani V I. 2014. Adv Mat. Res. 911 205-209 [5] Jiang W, Cai W, Lin Z, Fu C. 2013. Mat. Res. Bull.. 48 3092–3097. [6] Hutauruk F J, Kusumandari, Iriani Y. 2016. Jurnal Fisika dan Aplikasinya. 12 120-123. [7] Safitri R D, Subarwanti Y, Supriyanto A, Jamaluddin A, Iriani Y. 2016. Jurnal Fisika dan Aplikasinya. 12 112-115 [8] Gao H, Cao J, Liu L, Yang Y. 2011. J. Mol. Struc. 1003 75–81. [9] Ramakanth S, Raju K C J. 2014. Solid State Comm. 187 59-63. [10] Hadiati S, Ramelan A H, Variani V I, Hikam M, Soegijono B, Saputri D F, Iriani Y. 2014. Jurnal Fisika dan Aplikasinya. 10 37-43 [11] Zaidah A, Suwarni, Supriyanto A, Jamaluddin A, Iriani Y. 2015. Jurnal Fisika Dan Aplikasinya.11 82-55. [12] Kwei, G.H., Lawson, A.C., & Billinge, J.L. 1993. J. Physics Chem. 97 2368-2377. [13] Liman J, Harsono B , Rohman T T, Trimukti U , Khalid M , Roharti E , Irzaman. 2015. Jurnal Fisika Indonesia. 111 1410-2994.
6