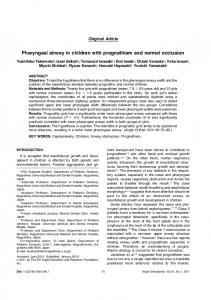
Original Article
Dentoskeletal effects of functional appliances vs bimaxillary surgery in hyperdivergent Class II patients Adebimpe O. Ibitayoa; Valmy Pangrazio-Kulbershb; Jeff Bergerc; Burcu Bayirlid ABSTRACT Objective: To compare treatment outcomes of growing and nongrowing Class II patients characterized by mandibular retrusion and increased vertical dimension. Materials and Methods: Seventeen patients (mean age 9 years 5 months) were treated with a Bionator fabricated with posterior bite block and high-pull headgear, while 15 patients (mean age 23 years 6 months) received Le Fort I osteotomy for maxillary impaction and mandibular advancement. These groups were compared with 17 nontreated control subjects from the Bolton and Michigan growth studies. Lateral cephalograms taken for the functional group at T1 (initial records), T2 (completion of functional appliance treatment), and T3 (completion of comprehensive treatment) were compared with radiographs taken at T1 (initial records), T2 (immediate post surgery), and T3 (1 year post surgery) for the surgical patients. A null hypothesis of no difference in treatment outcomes between the functional and surgical groups was proposed. A mixed-design analysis of variance was used to compare changes within and between groups. Significance was set at P # .002. Results: In the functional appliance group, the mandible showed a more favorable growth direction and rotation. Both groups had stable results over time and finished treatment with similar cephalometric measurements. Conclusion: Both the functional appliances and orthognathic surgery resulted in similar dentoskeletal treatment changes. The control groups did not self correct either in the anteroposterior or vertical dimensions. (Angle Orthod. 2011;81:304–311.) KEY WORDS: Long-face syndrome, Functional appliances; Bimaxillary surgery
anterior facial height with a frequent downward rotation of the posterior maxilla resulting in a downward and backward rotation of the mandible and a tendency for a Class II malocclusion.2,3 The prevalence of skeletal open bite in North American children was reported as 3.5% in the general population, with the highest prevalence occurring in the African-American population and the lowest prevalence in the MexicanAmerican population.4,5 One of the primary goals of early treatment is to restrain and control excessive vertical maxillary growth especially in the posterior region, preventing downward and backward rotation of the mandible and possibly even producing forward rotation of the mandible with continued growth.3 Early treatment is advocated to reduce treatment needs in the adult dentition when surgery may be the best option.6–10 Functional appliances, multi-bracket techniques with extractions, high-pull headgears, vertical-pull chin cups, bite blocks, and any combinations of the above have been used to control excessive vertical dimension.3,6,11
INTRODUCTION A skeletal open bite is characterized by clockwise rotation of the mandible, total maxillary alveolar hyperplasia, vertical maxillary excess, and a high mandibular plane angle.1,2 The primary distinguishing characteristic is manifested by an elongated lower Private practice, San Antonio, Tex. Adjunct Professor, Department of Orthodontics, University of Detroit Mercy, Detroit, Mich; private practice, Sterling Heights, Mich. c Adjunct Professor, Department of Orthodontics, University of Detroit Mercy, Detroit, Mich; private practice, Windsor, Ontario, Canada. d Associate Professor, Department of Orthodontics, University of Detroit Mercy, Detroit, Mich. Corresponding author: Dr Jeff Berger, Department of Orthodontics, Graduate Orthodontics University of Detroit Mercy, 2700 Martin Luther King Jr Blvd, Detroit, MI 48208-2576 (e-mail:
[email protected]) a b
Accepted: August 2010. Submitted: June 2010. 2011 by The EH Angle Education and Research Foundation, Inc.
G
Angle Orthodontist, Vol 81, No 2, 2011
304
DOI: 10.2319/060110-297.1
FUNCTIONAL APPLIANCE VS SURGERY
The Bionator fabricated with posterior bite blocks, high-pull headgear, or vertical-pull chin cup has been used to correct a skeletal open bite. Several studies have reported that the use of the Bionator in conjunction with extra-oral forces was more effective than the use of a single method for open bite correction.12–15 Long-term studies of the stability of activator and headgear therapy revealed variable results. Pancherz16 reported an improvement in vertical and sagittal relationships in high angle cases. However, a relatively high rate of relapse was noted with atypical tongue function. Lehman et al.,17 found long-term stability in 83% of patients treated with combined activator and headgear therapy. Surgical approach to the treatment of long face patients almost always involves maxillary impaction with Le Fort I osteotomy, with or without mandibular advancement and/or genioplasty.2 Multiple studies revealed long-term stability of the surgically impacted maxilla, while mandible advancement showed varying degrees of relapse.18–20 Hoppenreijs et al.20 concluded that patients with anterior open bites, treated with a Le Fort I osteotomy in one-piece or in multi-segments, with or without bilateral sagittal split osteotomy, exhibited good skeletal stability of the maxilla. Rigid maxillary and mandibular fixation produced the best stability.21–24 Swinnen et al.25 reported stability of surgical open bite correction 1 year post treatment. Mandibular relapse is a common occurrence and is attributed to several factors including amount of advancement, increase in the gonial arc, and decrease in mandibular plane angle. 23,25,26 Berger et al. 27 reported that early correction of Class II dentoskeletal malocclusions with functional appliances yields favorable results without the possible untoward effects of surgery. This study was designed to compare the treatment outcomes of patients with hyperdivergent Class II malocclusions treated either with a functional appliance (Bionator with posterior bite block and high-pull headgear) or surgical maxillary impaction and mandibular advancement. MATERIALS AND METHODS Thirty-two consecutively treated patients, who had the required cephalograms, were divided into two groups of 17 growing and 15 nongrowing patients. The orthodontic and functional treatments in both groups were performed by the same orthodontist, while the surgical procedures involved the same oral surgeon. The growing patients received a Bionator with posterior bite blocks (a wax bite registration of 5 mm in thickness at the first molar region) and high-pull headgear followed by full edgewise appliance. The
305 outer bow of the headgear was adjusted to coincide with a vector of force through the center of rotation of the maxilla. The nongrowing patients were treated surgically with maxillary impaction and mandibular advancement via bilateral sagittal split ramal osteotomy and stabilized with internal rigid fixation. A control group of 22 nontreated Class II vertical cases (10 from the Bolton brush growth study and 12 from the Michigan growth study) were matched with the experimental sample according to the inclusion criteria as follows: SNA angle 80u–85u; SNB angle 76u 6 3u; ANB angle $ 4.5u; FMA . 28u; SN-GoGn . 35u; Wits appraisal 3 mm 6 1 mm; Class II molar relationship; overjet of at least 4 mm; cervical vertebral maturation (CVM) stage II–III for the functional group; and CVM stage of V for the surgical group.28 The functional group and their nontreated controls had a starting CVM stage of II or III, while the surgical group and controls had a CVM stage of V. The functional group consisted of 10 girls with mean age of 10 years 4 months (range 9 to 11 years 2 months) and seven boys with mean age of 10 years 10 months (range 9 years 2 months to 13 years 1 month). The mean CVM stage was 2.3 at the start of treatment. Lateral cephalograms were obtained at T1 (2 months prefunctional appliance therapy), T2 (1 month postfunctional treatment), and T3 (post-fixed appliance or phase II; mean time of 2.5 years postfunctional treatment). CVM staging was 4.5 at the end of treatment. The total functional treatment time was 1 year 11 months (range 10 months to 36 months), and the average total observation time (T1 to T3) was 4.6 years. The surgical group consisted of 8 women (mean age of 21.6 years) and 7 men (mean age of 24.5 years) with a CVM stage of V. Lateral cephalograms were taken at T1 (1.5 years presurgery), T2 (2 weeks post surgery), and T3 (1 year post surgery). The mean total treatment time was 2 years 9 months (range 1 year 10 months to 3 years 5 months). The experimental groups were compared with a matched control group consisting of 17 nontreated patients from the Bolton and Michigan growth studies. All 17 patients (CG1) were matched with the functional group, while 15 of the original 17 (CG2) were matched with the surgical group when they achieved full skeletal maturation as evidenced by CVM stage V and further assessed by superimpositions. The recordings at T2 were reproduced and compared with the recordings of the surgical group at T3 in keeping with the findings of Baccetti et al.,29 which, in a study of Class II controls, showed very little growth changes between subjects from late puberty to early adulthood beyond the achievement of complete cervical maturation. The cephalometric radiographs obtained were digitized Angle Orthodontist, Vol 81, No 2, 2011
306
IBITAYO, PANGRAZIO-KULBERSH, BERGER, BAYIRLI
Figure 1a,b. Linear measurements. (1) Co-ANS. (2) Co-A. (3) Co-Gn. (4) N-ANS. (5) ANS-Me. (6) N-Me. (7) S-Go. (8) U6-PP. (9) Overjet. (10) Overbite. (11) Wits. (12) PFH:AFH.
and corrected for magnification. The Dolphin 10.5 software was used to obtain the cephalometric measurements (Figures 1 through 3). Repeated measures analysis of variance (ANOVA) was used to assess the comparability of the groups at the outset and over time. Given a significant ANOVA, the difference was explored via Tukey-Kramer tests. Significance was determined to be P # .002. RESULTS
five statistical significant differences were found in those measurements associated with growth. Comparison of Treatment Effects: Functional vs Control (Table 2) Angular measurements. When comparing the changes between the functional and control groups, the SNB was statistically larger and ANB was statistically smaller in the functional group (T2–T1).
Comparison of Starting Forms The experimental samples were compared before treatment to determine the similarities between them and to assist in interpreting the results (Table 1). The
Figure 2. Angular measurements. (1) SNA. (2) SNB. (3) U1-SN. (4) L1-SN. (5) ANB. (6) SN-Occl plane. (7) SN-PP. (8) IMPA. (9) FMA. (10) SN-GoGn. Angle Orthodontist, Vol 81, No 2, 2011
Figure 3. Soft tissue measurements. (1) Facial angle. (2) NLA (nasolabial angle). (3) ULL. (4) LLL. (5) ULP. (6) LLP. (7) UL-E. (8) LL-E.
307
FUNCTIONAL APPLIANCE VS SURGERY Table 1. Comparison of Starting Forms: Functional (F) vs Surgical (S) Functional vs Surgical Measurement
T1 (F)
T1 (S)
Mean
t Value
P Value
80.14 74.55 6.08 104.94 47.29 19.22 8.02 92.95 30.72 38.12
78.47 73.41 5.06 106.70 46.91 17.42 6.75 91.78 31.73 39.20
2.14 1.15 1.02 21.76 0.38 1.72 1.33 1.67 21.01 21.08
1.58 1.03 1.91 20.84 0.16 1.46 1.10 0.45 20.96 21.07
.12 .31 .06 .40 .87 .16 .28 .66 .34 .29
91.17 88.78 114.62 66.79 52.84 115.85 69.28 20.21 2.90 6.98 4.10 59.92
93.23 90.45 124.42 74.79 54.52 126.48 73.91 24.63 0.50 7.86 4.75 59.12
22.06 21.67 29.80 28.00 21.68 210.63 24.64 24.42 2.40 20.88 20.07 0.89
20.86 20.68 23.09 23.71 21.22 23.73 22.14 24.33 2.92 21.35 20.65 1.19
.39 .50 .002* .0004* .22 .0003* .03 .0001* .01 .18 .52 .24
218.18 114.79 22.59 1.97 22.12 19.26 20.57 23.34
217.57 116.38 23.59 1.23 22.29 22.56 21.77 25.83
20.61 20.80 21.00 0.74 0.18 23.30 1.20 2.50
20.31 20.18 20.72 0.84 0.14 23.37 1.25 2.54
.76 .86 .47 .40 .89 .001* .22 .01
Angular SNA, degrees SNB, degrees ANB, degrees U1-SN, degrees L1-SN, degrees SN-Occl, degrees SN-PP, degrees IMPA, degrees FMA, degrees SN-GoGn, degrees Linear Co-ANS, mm Co-A, mm Co-Gn, mm ANS-Me, mm N-ANS, mm N-Me, mm S-Go, mm U6-PP, mm Overbite, mm Overjet, mm Wits, mm PFH:AFH Soft Tissue Facial angle, degrees NLA, degrees LLL, mm ULP, mm LLP, mm ULL, mm LL-E, mm UL-E, mm * P # .002.
The IMPA did not change after functional treatment (T2–T1). At the end of fixed appliance therapy (T3– T2), the lower incisors were more flared in the functional treatment group. An overall reduction of FMA and SN-GoGn was evident in the functional group (T2–T1 and T3–T1). Linear measurements. The overjet, overbite, and Wits values were reduced significantly in the functional group (T3–T1). The posterior facial height (S-Go) increased significantly in the functional group (T2–T1 and T3–T2). However, the overall increase did not appear significant at the end of the observation period (T3–T1) due to a substantial increase in the control sample. The PFH:AFH ratio increased significantly in the functional group at T2–T1, and this increase was sustained at the end of the observation period (T3–T1). There was a significant restriction on anterior maxillary growth (T2–T1 and T3–T1) and significant increase in mandibular length in the functional group (T3–T2 and T3–T1). Greater upper molar intrusion was
noted in the functional group as compared with the controls, but this difference was not statistically significant at all time points. Soft tissue measurements. There was a decrease in facial angle, an increase in upper lip length, and lower lip protrusion in the functional sample; however, these changes were not statistically significant. Comparison of Treatment Effects: Surgical vs Control (Table 3) Angular measurements. The SNB increased significantly (T2–T1 and T3–T1), and a significant reduction was noted in the ANB for the surgical group (T2–T1 and T3–T1). The FMA and the SN-GoGn decreased significantly in the surgical group (T2–T1 and T3–T1). Although an increase in the SN-Occl was noted (T2–T1 and T3–T1), this change was not statistically significant in the surgical group. SNA, U1-SN, and L1-SN showed no significant differences between the two groups (T3–T1). Angle Orthodontist, Vol 81, No 2, 2011
308
IBITAYO, PANGRAZIO-KULBERSH, BERGER, BAYIRLI
Table 2. Differences Over Time Between Functional (F) and Control (C) Groups
Measurement
F
C
F
C
T2–T1
T2–T1
t Value
20.42 1.64 22.08 25.05 1.59 1.02 20.44 20.73 21.37 21.17
20.34 20.26 20.08 20.13 21.11 20.22 20.18 20.07 20.06 1.35
3.43 1.63 7.75 5.92 1.76 7.94 6.55 0.84 21.17 23.33 24.29 1.91 0.75 2.34 20.06 21.14 20.57 1.68 20.66 21.51
F
C
P Value
T3–T2
T3–T2
t Value
P Value
T3–T1
T3–T1
t Value
P Value
20.13 3.44 24.54 22.59 2.03 1.50 20.36 20.47 22.75 25.29
.89 .001* .0001* .01 .05 .14 .71 .64 .01 .0001*
0.02 0.32 20.32 5.56 23.76 20.31 0.98 4.17 20.54 20.30
20.14 0.84 20.96 1.13 1.19 22.68 20.11 20.25 0.34 21.06
0.24 20.94 1.45 2.33 23.71 2.88 1.56 3.17 21.85 1.61
.81 .35 .15 .02 .0004* .01 .12 .002* .07 .11
20.39 1.97 22.39 0.48 22.14 0.72 0.60 3.41 21.90 21.46
20.48 0.58 21.04 1.00 0.08 22.90 20.29 20.32 0.28 0.28
0.13 2.51 23.08 20.27 21.67 4.38 1.28 2.67 24.60 23.66
.89 .01 .003 .79 .10 .0001* .21 .01 .0001* .0005*
6.41 5.65 8.46 4.88 3.23 7.34 3.96 2.03 0.48 0.26 0.45 20.64
22.19 23.26 20.43 0.87 21.64 0.37 2.41 21.82 22.31 26.97 26.52 4.17
.03 .001* .67 .39 .11 .71 .02 .07 .02 .0001* .0001* .0001*
0.12 1.01 4.18 1.56 1.79 3.92 2.93 2.85 0.07 20.65 20.03 0.50
5.16 4.69 8.58 3.59 3.04 7.07 5.50 2.92 0.49 20.28 0.63 0.87
23.71 22.99 22.67 21.71 21.39 21.97 22.39 20.11 20.78 20.71 20.90 20.61
.0004* .004 .001* .09 .17 .05 .02 .91 .44 .48 .37 .55
3.51 2.59 11.78 7.44 3.52 11.78 9.45 3.69 21.25 23.98 24.32 2.41
11.58 10.34 17.04 8.48 6.28 14.41 9.45 4.96 0.98 20.02 1.08 0.23
25.93 26.28 23.19 20.88 23.05 21.65 20.01 21.93 23.11 27.68 27.43 3.56
.0001* .0001* .002* .38 .003 .11 .99 .06 .003 .0001* .0001* .0007*
24.55 10.10 22.86 21.43 20.24 20.36 0.08 20.58
2.80 21.16 1.69 0.27 20.21 1.96 20.74 20.85
.01 .25 .09 .79 .83 .05 .46 .39
20.56 0.27 0.73 0.45 2.22 0.44 20.73 21.33
0.19 4.20 0.35 20.68 21.88 0.35 20.02 20.09
20.40 20.59 0.23 1.04 2.65 0.08 20.71 21.14
.69 .56 .82 .30 .01 .93 .48 .26
0.26 2.66 0.65 20.70 1.62 2.04 21.49 22.91
24.36 14.30 22.51 22.11 22.12 20.01 0.06 20.68
2.44 21.73 1.91 1.29 2.42 1.97 21.56 22.05
.02 .09 .06 .20 .02 .05 .12 .04
Angular SNA, degrees SNB, degrees ANB, degrees U1-SN, degrees L1-SN, degrees SN-Occl, degrees SN-PP, degrees IMPA, degrees FMA, degrees SN-GoGn, degrees Linear Co-ANS, mm Co-A, mm Co-Gn, mm ANS-Me, mm N-ANS, mm N-Me, mm S-Go, mm U6-PP, mm Overbite, mm Overjet, mm Wits, mm PFH:AFH Soft tissue Facial angle, degrees NLA, degrees LLL, mm ULP, mm LLP, mm ULL, mm LL-E, mm UL-E, mm * P # .002.
Linear measurements. The surgical group experienced a significant reduction in overjet and Wits (T2– T1 and T3–T1). Although the upper molars to palatal plane U6-PP showed a decrease from T3 to T1, this change was not statistically significant. All other measurements associated with the anteroposterior and vertical position of the maxilla, as well as mandibular length did not show significant changes over time (T3–T1). Soft tissue measurements. The facial angle increased significantly in the surgical group (T3–T1). The NLA decreased in both groups, but these changes were not statistically significant at all times studied. Comparison of Treatment Effects: Surgical vs Functional (Table 4) Angular measurements. There were no statistically significant differences in SNA, SNB, ANB, U1-SN, SNPP, and IMPA between the functional and surgical groups over time (T3–T1). However, values for both Angle Orthodontist, Vol 81, No 2, 2011
FMA and SN-GoGn showed a statistical difference (T2–T1), but these differences were not significant over time (T3–T1). Linear measurements. All measurements associated with growth were significantly less in the functional group (T2–T1) due to the difference in skeletal maturation between the two groups. However, these differences became insignificant over time (T3–T1). NANS increased significantly in the functional group when compared with the surgical group (T3–T1). Wits appraisal decreased equally in both groups. There were no statistical differences long term for overbite and overjet (T3–T1). Soft tissue measurements. Values between the two groups demonstrated no statistical differences over time. DISCUSSION When comparing the functional group with the controls, the maxilla experienced a slight restriction
309
FUNCTIONAL APPLIANCE VS SURGERY Table 3. Differences Over Time Between Surgical (S) and Control (C) Groups
Measurement
S
C
S
C
T2–T1
T2–T1
t Value
P Value
T3–T2
T3–T2
1.21 3.21 21.97 20.63 21.39 1.54 0.29 4.09 23.58 23.00
0.25 0.38 20.12 20.35 0.04 21.01 0.05 0.39 20.11 20.39
1.65 5.13 24.82 20.16 20.75 3 0.31 1.83 26.96 25.54
.11 .0001* .0001* .87 .46 .004 .76 .07 .0001* .0001*
0.35 0.63 20.28 0.75 20.77 20.04 20.93 0.57 0.25 0.01
0.66 20.66 2.47 20.93 20.14 20.88 2.24 20.31 20.37 24.35 25.22 2.31
0.41 0.21 0.63 0.82 0.07 1.05 1.26 1.19 20.19 20.11 0.35 0.65
0.24 20.88 1.38 22.12 20.27 22.10 0.95 22.63 20.19 25.75 27.92 2.48
.81 .38 .17 .04 .79 .04 .35 .01 .85 .0001* .0001* .02
3.15 27.75 21.40 0.93 1.65 0.98 20.47 20.69
21.04 23.53 0.45 0.36 0.27 0.01 20.57 0.07
2.18 20.78 21.35 0.65 1.04 1.16 0.10 20.72
.03 .44 .18 .52 .30 .25 .92 .48
S
C
t Value P Value T3–T1
T3–T1
t Value
P Value
0.00 0.00 0.00 0.00 0.00 0.00 0.00 0.00 0.00 0.00
0.60 1.15 20.73 0.42 20.41 20.05 21.22 0.28 0.50 0.03
.55 .26 .47 .68 .69 .96 .23 .78 .62 .98
1.57 3.84 22.25 0.11 22.17 1.50 20.65 4.65 23.33 22.99
0.25 0.38 20.12 20.35 0.04 21.01 0.05 0.39 20.11 20.39
2.25 6.28 25.54 0.26 21.16 2.95 20.92 2.11 26.46 25.52
.03 .0001* .0001* .79 .25 .005 .36 .04 .0001* .0001*
20.25 0.51 1.32 0.51 20.85 20.75 21.53 20.31 1.02 0.19 20.70 20.72
0.00 0.00 0.00 0.00 0.00 0.00 0.00 0.00 0.00 0.00 0.00 0.00
20.24 0.52 0.99 20.61 21.08 20.81 21.49 20.54 1.07 0.26 20.99 21.08
.81 .60 .33 .54 .29 .42 .14 .59 .29 .79 .32 .29
0.41 20.15 3.79 21.43 20.99 21.63 0.71 20.61 0.65 24.15 25.92 1.59
0.41 0.21 0.63 0.82 0.07 1.05 1.26 1.19 20.19 20.11 0.35 0.65
0.00 20.36 2.37 22.73 21.35 22.91 20.54 23.17 0.88 25.48 28.91 1.41
1.00 .72 .02 .01 .18 .01 .59 .003 .38 .0001* .0001* .17
2.14 21.05 0.21 0.58 0.51 20.61 21.04 20.41
0.00 0.00 0.00 0.00 0.00 0.00 0.00 0.00
1.11 20.19 0.15 0.67 0.38 20.74 21.04 20.38
.27 .85 .88 .51 .70 .46 .31 .70
5.29 28.80 21.19 1.51 2.16 0.37 21.51 21.09
21.04 23.53 0.45 0.36 0.27 0.01 20.57 0.07
3.30 20.97 21.20 1.32 1.42 0.43 20.94 21.10
.002* .34 .23 .19 .16 .67 .35 .28
Angular SNA, degrees SNB, degrees ANB, degrees U1-SN, degrees L1-SN, degrees SN-Occl, degrees SN-PP, degrees IMPA, degrees FMA, degrees SN-GoGn, degrees Linear Co-ANS, mm Co-A, mm Co-Gn, mm ANS-Me, mm N-ANS, mm N-Me, mm S-Go, mm U6-PP, mm Overbite, mm Overjet, mm Wits, mm PFH:AFH Soft tissue Facial angle, degrees NLA, degrees LLL, mm ULP, mm LLP, mm ULL, mm LL-E, mm UL-E, mm * P # .002.
in forward growth as a result of headgear therapy. These findings are supported by Pancherz,16 Weislander,30 and Weislander and Lagerstrom,31 while Lehman et al.17 found a marked restriction of maxillary growth. The functional appliance treatment produced a counterclockwise rotation of the mandible, which contributed to a reduction of the ANB angle. These findings were similar to those obtained from previous studies.16,17,30,32–34. The significant reduction of the SNOccl plane in the control group during the entire observation period (T3–T1) indicates a continuation of downward growth of the posterior maxillary dentoalveolar complex. This unfavorable growth pattern was prevented in the functional group. The upper incisors showed no statistically significant differences between the two groups across the time points. Similar findings were reported by Berger et al.27 The significant increase in the PFH:AFH ratio was the result of vertical condylar growth expressed as the condyle was displaced from the fossa.35 The functional appliance
treatment had little effect overall on mandibular length, a finding that was similar to that obtained by other investigators.27,31,36 However, this finding contrasted with that of other studies17,30,34 where a significant lengthening of the mandible was reported. When comparing the surgical group with the controls, similar effects to those observed in the functional group were noted. These findings are similar to those of other investigators.25,27,37,38 Even though the SN-GoGn did not show a significant difference between treatment and control subjects, it is important to note that this measurement was 3u smaller in the treatment group when compared with the controls (T3–T1), indicating a closure of the mandibular plane angle. The significant increase in the SN-Occl plane in the surgical group reflected a greater degree of surgical posterior maxillary impaction as reported by others.25 The anteroposterior position of the maxilla remained relatively unchanged in the surgical group, indicating that only maxillary impaction was obtained with surgery. Angle Orthodontist, Vol 81, No 2, 2011
310
IBITAYO, PANGRAZIO-KULBERSH, BERGER, BAYIRLI
Table 4. Differences Over Time Between Functional (F) and Surgical (S) Groups
Measurement
F
S
F
S
T2–T1
T2–T1
t Value
20.43 1.64 22.08 25.05 1.59 1.02 20.37 20.73 21.36 21.17
1.21 3.21 21.97 20.63 21.39 1.54 0.29 4.09 23.58 23.00
3.43 1.66 7.78 5.92 1.74 7.95 6.55 0.84 21.16 23.33 24.30 1.91 0.78 2.34 20.05 21.14 20.58 1.65 20.66 21.51
F
S
P Value
T3–T2
T3–T2
t Value
T3–T1
T3–T1
t Value
22.18 22.30 20.24 21.98 1.49 20.49 20.75 22.29 3.83 3.49
.03 .03 .81 .05 .14 .63 .45 .03 .0003* .0009*
0.02 0.32 20.32 5.56 23.76 20.31 1.05 4.17 20.53 20.30
0.35 0.63 20.28 0.75 20.77 20.04 20.93 0.57 0.25 0.01
20.45 20.46 20.10 2.15 21.49 20.25 2.27 1.71 21.35 20.59
.66 .65 .92 .04 .14 .8 .03 .09 .18 .56
20.39 1.97 22.39 0.48 22.14 0.72 0.66 3.41 21.89 21.46
1.57 3.84 22.25 0.11 22.17 1.50 20.65 4.65 23.33 22.99
22.61 22.74 20.33 0.16 0.01 20.73 1.5 20.59 2.48 2.91
.01 .01 .74 .87 .99 .47 .14 .56 .02 .01
0.66 20.66 2.47 20.93 20.14 20.88 2.24 20.31 20.37 24.35 25.22 2.31
2.32 2.01 3.28 5.81 2.02 6.57 3.85 1.69 20.77 1.32 1.15 20.57
.02 .05 .02 .0001* .05 .0001* .0003* .09 .44 .19 .26 .57
0.12 1.04 4.22 1.56 1.78 3.93 2.92 2.85 20.06 20.65 20.03 0.50
20.25 0.51 1.32 20.51 20.85 20.75 21.53 20.31 1.02 0.19 20.70 20.72
0.30 0.46 1.79 1.75 2.82 3.48 3.98 4.65 21.04 21.09 0.83 1.71
.76 .65 .08 .08 .01 .001* .0002* .0001* .30 .28 .41 .09
3.51 2.63 11.81 7.44 3.51 11.79 9.45 3.69 21.25 23.98 24.32 2.41
0.41 20.14 3.79 21.43 20.99 21.63 0.71 20.61 0.65 24.15 25.92 1.59
2.59 2.40 4.97 7.53 4.83 9.99 7.80 6.35 21.84 0.23 1.98 1.14
.01 .02 .0001* .0001* .0001* .0001* .0001* .0001* .07 .82 .05 .26
3.15 27.75 21.40 0.93 1.65 0.98 20.47 20.69
21.16 1.67 1.00 21.99 21.48 0.70 20.19 20.84
.25 .10 .32 .05 .15 .48 .85 .41
20.53 0.27 0.73 0.46 2.20 0.41 20.73 21.33
2.14 21.05 0.21 0.58 0.51 20.61 21.04 20.41
21.30 0.22 0.39 20.12 1.12 1.08 0.30 20.94
.19 .83 .69 .91 .27 .28 .77 .35
0.29 2.66 0.66 20.70 1.61 2.01 21.49 22.91
5.29 28.80 21.19 1.51 2.16 0.37 21.51 21.09
22.43 1.90 1.37 22.13 20.37 1.74 0.02 21.84
.02 .06 .18 .04 .72 .09 .98 .07
P Value
P Value
Angular SNA, degrees SNB, degrees ANB, degrees U1-SN, degrees L1-SN, degrees SN-Occl, degrees SN-PP, degrees IMPA, degrees FMA, degrees SN-GoGn, degrees Linear Co-ANS, mm Co-A, mm Co-Gn, mm ANS-Me, mm N-ANS, mm N-Me, mm S-Go, mm U6-PP, mm Overbite, mm Overjet, mm Wits, mm PFH:AFH Soft Tissue Facial angle, degrees NLA, degrees LLL, mm ULP, mm LLP, mm ULL, mm LL-E, mm UL-E, mm * P # .002.
When comparing the two treatment groups, the significant differences between the two groups could be attributed to growth. No significant differences were found in the angular measurements as supported by other investigators.27 The significant decrease in SNPP and N-ANS in the surgical group demonstrated a greater effect on maxillary impaction than that obtained with functional appliances. The significant increase in the PFH:AFH ratio in the functional group demonstrated vertical growth at the condyles, which was not present in the surgical group. CONCLUSION N Both the functional appliances and orthognathic surgery resulted in similar dentoskeletal treatment changes. The control groups did not self correct either in the anteroposterior or vertical dimensions. Angle Orthodontist, Vol 81, No 2, 2011
REFERENCES 1. Proffit WR, Fields HW, Sarver DM. Contemporary Orthodontics. 4th edition. St Louis, Mo: Mosby; 2007. 2. Schendel SA, Eisenfeld J, Bell WH, Epker BN, Mishelevich DJ. The long face syndrome: vertical maxillary excess. Am J Orthod. 1976;70:398–408. 3. Proffit WR, White RP, Sarver DM. Contemporary Treatment of Dentofacial Deformity. St Louis, Mo: Mosby; 2003: 150–161. 4. Proffit WR, Fields HW Jr, Moray LJ. Prevalence of malocclusion and orthodontic treatment need in the United States: estimates from the NHANES III survey. Int J Adult Orthodon Orthognath Surg. 1998;13:97–106. 5. Kelly JE, Sanchez M, Van Kirk LE. An Assessment of the Occlusion of Teeth of Children 6–11 Years. Washington, DC: National Center for Health Statistics; 1973:3. US Public Health Service DHEW Pub No 130. 6. Sankey WL, Buschang PH, English J, Owen AH III. Early treatment of vertical skeletal dysplasia: the hyperdivergent phenotype. Am J Orthod Dentofacial Orthop. 2000;118: 317–327.
FUNCTIONAL APPLIANCE VS SURGERY
7. Schudy F. Vertical growth versus anteroposterior growth as related to function and treatment. Angle Orthod. 1964;34: 75–93. 8. Bjo¨rk A. Prediction of mandibular growth rotation. Am J Orthod. 1969;55:585–599. 9. Nielsen IL. Vertical malocclusions: etiology, development, diagnosis and some aspects of treatment. Angle Orthod. 1991;61:247–260. 10. Pearson LE. Vertical control in treatment of patients having backward rotational growth tendencies. Angle Orthod. 1978; 48:132–140. 11. Ng CS, Wong WK, Hagg U. Orthodontic treatment of anterior open bite. Int J Paediatr Dent. 2008;18:78–83. 12. Weinbach JR, Smith RJ. Cephalometric changes during treatment with the open bite bionator. Am J Orthod Dentofacial Orthop. 1992;101:367–374. 13. Arat M, Iseri H. Orthodontic and orthopedic approach in the treatment of skeletal open bite. Eur J Orthod. 1992;14: 207–215. 14. Ngan P, Wilson S, Florman M, Wei SH. Treatment of Class II open bite in the mixed dentition with a removable functional appliance and headgear. Quintessence Int. 1992;23:323–333. 15. Cozza P, Mucedero M, Baccetti T, Franchi L. Early orthodontic treatment of skeletal open-bite malocclusion: a systematic review. Angle Orthod. 2005;75:707–713. 16. Pancherz H. The mandibular plane angle in activator treatment. Angle Orthod. 1979;49:11–19. 17. Lehman R, Romuli A, Bakker V. Five year treatment results with a headgear—activator combination. Eur J Orthod. 1988;10:309–318. 18. Remmers D, Van’t Hullenaar RW, Bronkhorst EM, Berge´ SJ, Katsaros C. Treatment results and long-term stability of anterior open bite malocclusion. Orthod Craniofac Res. 2008;11:32–42. 19. Ding Y, Xu TM, Lohrmann B, Gellrich NC, Schwestka-Polly R. Stability following combined orthodontic-surgical treatment for skeletal anterior open bite—a cephalometric 15year follow-up study. J Orofac Orthop. 2007;68:245–256. 20. Hoppenreijs TJ, Freihofer HP, Stoelinga PJ, Tuinzing DB, van’t Hof MA, van der Linden FP, Nottet SJ. Skeletal and dento-alveolar stability of Le Fort I intrusion osteotomies and bimaxillary osteotomies in anterior open bite deformities. A retrospective three-centre study. Int J Oral Maxillofac Surg. 1997;26:161–175. 21. Fischer K, von Konow L, Brattstro¨m V. Open bite: stability after bimaxillary surgery—2-year treatment outcomes in 58 patients. Eur J Orthod. 2000;22:711–718. 22. Kierl MJ, Nanda RS, Currier GF. A 3-year evaluation of skeletal stability of mandibular advancement with rigid fixation, J Oral Maxillofac Surg. 1990;48:587–592. 23. Dolce C, Van Sickels JE, Bays RA, Rugh JD. Skeletal stability after mandibular advancement with rigid versus wire fixation. J Oral Maxillofac Surg. 2000;58:1219–1227. 24. Ellis E, Gallo JW. Relapse following mandibular advancement with dental plus skeletal maxillomandibular fixation. J Oral Surg. 1986;44:509–515.
311 25. Swinnen K, Politis C, Willems G, et al. Skeletal and dentoalveolar stability after surgical-orthodontic treatment of anterior open bite: a retrospective study. Eur J Orthod. 2001;23:547–557. 26. Gassman CJ, Van Sickels JE, Thrash WJ. Causes, location, and timing of relapse following rigid fixation after mandibular advancement. J Oral Maxillofac Surg. 1990;48: 450–454. 27. Berger JL, Pangrazio-Kulbersh V, George C, Kaczynski R. Long-term comparison of treatment outcome and stability of Class II patients treated with functional appliances versus bilateral sagittal split ramus osteotomy. Am J Orthod Dentofacial Orthop. 2005;127:451–464. 28. Baccetti T, Franchi L, McNamara JA Jr. An improved version of cervical vertebral maturation (CVM) method for the assessment of mandibular growth. Angle Orthod. 2002; 72:316–323. 29. Baccetti T, Stahl F, McNamara JA Jr. Dentofacial growth changes in subjects with untreated Class II malocclusion from late puberty through young adulthood. Am J Orthod Dentofacial Orthop. 2008;135:148–154. 30. Weislander L. Intensive treatment of severe class II malocclusions with a headgear-Herbst appliance in the early mixed dentition. Am J Orthod. 1984;86:1–11. 31. Weislander L, Lagerstrom L. The effect of activator treatment on class II malocclusions. Am J Orthod. 1979; 75:20–26. 32. Gasson N, Lavergne J. The maxillary rotation: its relation to the cranial base and the mandibular corpus. An implant study. Acta Odontol Scand. 1977;35:89–94. 33. Defraia E, Marinelli A, Baroni G, Franchi L, Baccetti T. Early orthodontic treatment of skeletal open-bite malocclusion with the open-bite bionator: a cephalometric study. Am J Orthod Dentofacial Orthop. 2007;132:595–598. 34. Almeida MR, Henriques JF, Almeida RR, Almeida-Pedrin RR, Ursi W. Treatment effects produced by the Bionator appliance. Comparison with an untreated Class II sample. Eur J Orthod. 2004;26:65–72. 35. Baltromejus S, Ruf S, Pancherz H. Effective temporomandibular joint growth and chin position changes: Activator versus Herbst treatment. A cephalometric roentgenographic study. Eur J Orthod. 2002;24:627–637. 36. Weislander L. Long term effect of treatment with headgearHerbst appliance in the early mixed dentition. Stability or relapse? Am J Orthod Dentofacial Orthop. 1993;104: 319–328. 37. Lohrmann B, Schwestka-Polly R, Na¨gerl H, Ihlow D, KubeinMeesenburg D. The influence of functional orthodontics and mandibular sagittal split advancement osteotomy on dental and skeletal variables—a comparative cephalometric study. Eur J Orthod. 2006;28:553–560. 38. Pangrazio-Kulbersh V, Berger JL, Kaczynski R, Shunock M. Stability of skeletal Class II correction with 2 surgical techniques: the sagittal split ramus osteotomy and the total mandibular subapical alveolar osteotomy. Am J Orthod Dentofacial Orthop. 2001;120:134–143.
Angle Orthodontist, Vol 81, No 2, 2011