has a tangential feed inlet (Wills, 1997). Two of the fundamental parameters that are used for representing hydrocyclone efficiency include: cut size, d50, which.
Prediction of hydrocyclone performance using artificial neural networks by M. Karimi*, A. Dehghani*, A. Nezamalhosseini*, and Sh. Talebi*
Artificial neural networks (ANNs) have found their applications in the modelling of unit operations of mineral processing plants. In this research, laboratory-scale tests were conducted, using a three-inch diameter Mozley hydrocyclone. Main parameters included pressure drop at inlet, solid per cent, vortex and apex diameter were adjusted. The corrected cut size (d50c) and the flow rates of underflow and overflow were determined. Multi layers perceptron (MLP) feed forward network architectures were designed to predict the responses. The results showed a good correlation between experimental and network output, for corrected cut size and flow rates. Keywords: hydrocyclone, artificial neural network, corrected cut size, flow rates.
Introduction The hydrocyclone is one of the most versatile types of industrial centrifugal separators. Due to its simple design, low cost, easy operation and low floor space requirement, the hydrocyclone has found an important role in mineral processing plants as a solid-liquid separator. A typical hydrocyclone consists of a conical shape vessel, open at its apex, or underflow, joined to a cylindrical section which has a tangential feed inlet (Wills, 1997). Two of the fundamental parameters that are used for representing hydrocyclone efficiency include: cut size, d50, which represents the size of particles that have an equal chance of going either with the overflow or underflow, and flow recovery to underflow, Rf, which depends on flow rates to overflow (Of ) and underflow (Uf ) (Svarovsky, 1984). A partition curve is used to determine d50, which provides the relationship between the weight fraction of each particle size in the overflow and underflow streams. Flow recovery to the underflow is calculated from the dilution rates of three streams. In practical applications, the d50 is corrected by assuming that a fraction of the heavier particles are entrained in the The Journal of The Southern African Institute of Mining and Metallurgy
VOLUME 110
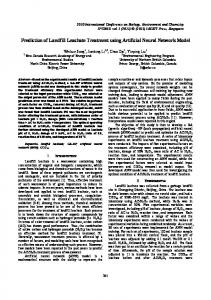
Experiments Laboratory-scale tests were conducted, using a three-inch diameter Mozley hydrocyclone. An experimental design method was employed in conducting the tests. In each test, the main input parameters were adjusted and samples from feed, overflow, and underflow were collected (Figure 2). Feed with different solid per cent was prepared. Samples from each
* Department of Mining and Metalllurgical Engineering, Yazd University, Yazd, Iran. © The Southern African Institute of Mining and Metallurgy, 2010. SA ISSN 0038–223X/3.00 + 0.00. Paper received Jun. 2009; revised paper received Dec. 2009. REFEREED PAPER
MAY 2010
207
▲
Synopsis
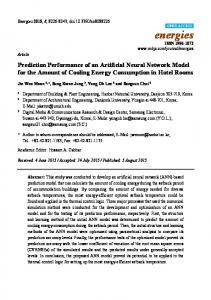
overflow system, which is equivalent to the fraction of water in the underflow. This correction of d50 is designated as d50c (Figure 1). Mathematically, the d50c and Rf can be estimated by empirical models such as Lynch and Nageswararao (Lynch, 1997). However, empirical models are not able to consider all the effective parameters. Artificial neural networks (ANNs) were used to predict d50c (Eren et al. 1996). Many nonconventional operational variables such as water and solid split ratios, overflow and underflow densities, and apex and vortex flow rates were considered as the input parameters. Wander Waltt (1993) has introduced a ‘feed forward neural network’ as a useful tool for modelling in minerals engineering and the prediction of a hydrocyclone partition curve. In this research, the d50c and flow rates of underflow and overflow have been predicted, using ANNs. Pressure drop at inlet, feed solid per cent, vortex and apex diameters have been selected as network input parameters. The overall performance of the hydrocyclone has been validated by the analysis of the correlation coefficient (R2), mean square error (MSE), and comparison of predicted and actual values.
T r a n s a c t i o n
P a p e r
Prediction of hydrocyclone performance using artificial neural networks
Figure 1—Corrected vs. actual cut size for test No. 7
Pressure Gauge
Valve Valve
Pump Figure 2—Schematic diagram of the experimental setup
▲
208
MAY 2010
VOLUME 110
REFEREED PAPER
The Journal of The Southern African Institute of Mining and Metallurgy
Prediction of hydrocyclone performance using artificial neural networks To train a neural network for prediction purposes and evaluate its performance, at least three data-sets, training, cross validation and test, are necessary. Therefore, 30 sets of data were subdivided into three subsets, 19 training, 6 cross validation and 5 test data (see Appendix A). Table I presents the results of the optimized MLP on the test data used for prediction of the output. In order to compare the results, four statistical indices including mean squared error (MSE), normalized mean squared error (NMSE), mean absolute error (MAE), and R2 were used to compare the results. MSE is the mean of the squared deviation between the actual and the estimation. It is a measure of accuracy for estimation, which takes into account both the bias and the error variance. MAE measures the average absolute deviation between actual and the estimate. R2 is an evaluator for the percentage of variation of the actual data explained by the predicted data. It was observed (Table II) that the selected MLP demonstrated a good prediction of d50c. The comparison of the experimental and the predicted values with MLP is graphically shown in Figure 4. This figure illustrates a good estimation of hydrocyclone d50c, using the multilayer perceptron neural network.
steam were taken, when the hydrocyclone was working in a steady-state condition. A laser diffraction method was used to determine the size distribution of samples. The performance parameters were then calculated.
Result and discussion The d50c, Uf and Of, were used as output variables. In order to estimate these variables, parameters such as pressure drop at inlet, solid per cent, vortex and apex diameter, were used as input variables. The complex relationship between input and output patterns was captured through a network via a set of connection weights, which were adjusted during training of the networks. The network captures an input-output relationship through training and acquires a certain prediction capability to produce an output for a given input. In order to decrease error and increase generalization capability, two separate networks were designed, for the prediction of corrected cut size, and Uf and Of. In the following paragraphs the procedures of designing optimal networks is explained.
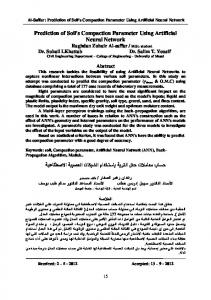
Corrected cut size prediction The network architecture used for analysis was a multilayer perceptron (MLP) feed forward neural network. The MLP architecture is capable of employing different activation functions in hidden and output layers. The MLP used for the prediction of d50c has three layers: the input layer, one hidden layer, and the output layer. The selected optimized network includes 4 neurons in the hidden layer (Figure 3). Among various activation functions available, such as tanh, threshold, linear, sigmoid and Gaussian, the logistic sigmoid function showed the best performance for activation of the hidden layer.
Prediction of flow rates to underflow and overflow In order to design optimum net, several trial and error tests were conducted. An MLP network with 4-2-2 architecture was selected for prediction purposes (Figure 5.). A logistic sigmoid function was used for activation of the hidden layer. Optimized neural networks, which are applied for hydrocyclone performance prediction, have only one hidden layer, with a small number of hidden units; therefore they are able to produce appropriate results in a very short time.
Table I
d50c network evaluation using test data Pressure drop (psi) 17.5 15 17.5 17.5 17.5
Solid %
Vortex diameter (mm)
Apex diameter (mm)
d50
d50 output
6 4 6 6 6
19 25 19 19 19
16.25 20 23.75 16.25 16.25
5.79 7.65 11.64 5.09 6
4.78 6.50 8.93 4.78 4.78
Solid per cent Vortex diameter (d50c)
Pressure drop Apex diameter
Input layer
Hidden layer
Output layer
The Journal of The Southern African Institute of Mining and Metallurgy
VOLUME 110
REFEREED PAPER
MAY 2010
209
▲
Figure 3—Optimized MLP architecture for d50c
T r a n s a c t i o n
P a p e r
Prediction of hydrocyclone performance using artificial neural networks Table II
Statistical results for d50c Performance
Cut size
MSE NMSE MAE Min abs error Max abs error R2
2.264 0.407 1.284 0.313 2.715 0.977
Figure 4—Measured and predicted d50c, for test data set
Solid per cent Vortex diameter
Uf
Pressure drop
Of
Apex diameter Input layer
Hidden layer
Output layer
Figure 5—Optimized MLP architecture for Uf and Of
The same data-set was applied for training, validation and test purposes (Appendix A). Table III demonstrates the results of the optimized MLP on the test data used for the prediction of Uf and Of. Statistical parameters were calculated (Table IV) and revealed that ANN is highly capable of estimating the flow rates. Figures 6 and 7 display the measured versus output data for hydrocyclone underflow and overflow flow rates.
▲
210
MAY 2010
VOLUME 110
REFEREED PAPER
According to these figures, the selected network has enough accuracy for underflow and overflow flow rates’ approximation.
Conclusions In this paper, the application of artificial neural networks, using two feed forward neural networks, for the estimation of the hydrocyclone corrected cut size (d50c) and underflow (Uf) The Journal of The Southern African Institute of Mining and Metallurgy
Prediction of hydrocyclone performance using artificial neural networks Table III
Uf and Of network evaluation using test data Pressure drop (psi) 20 17.5 20 20 20
Solid per cent
Vortex diameter (mm)
Apex diameter (mm)
Underflow flow rate (t/h)
Overflow flow rate (t/h)
Underflow flow rate (t/h) Output
Overflow flow rate (t/h) Output
4 6 8 4 4
13 19 25 13 25
12.5 16.25 12.5 20 20
2.41 2.85 1.48 4.67 3.60
1.59 2.98 6.05 0.18 4.41
2.43 2.82 1.44 5.20 4.16
2.05 3.20 5.63 0.43 4.31
T r a n s a c t i o n
Table IV
Statistical results for Uf and Of Performance
Underflow flow rate
Overflow flow rate
MSE NMSE MAE Min abs error Max abs error R2
0.119 0.102 0.237 0.026 0.558 0.989
0.124 0.029 0.334 0.092 0.454 0.994
P a p e r
Figure 6—Measured and predicted Uf, for test data-set
The Journal of The Southern African Institute of Mining and Metallurgy
VOLUME 110
REFEREED PAPER
MAY 2010
211
▲
Figure 7—Measured and predicted Of, for test data-set
Prediction of hydrocyclone performance using artificial neural networks and overflow (Of ) flow rates was investigated. The effects of input parameters such as pressure drop at inlet, solid per cent, vortex and apex diameter, were evaluated, using a laboratory-scale hydrocyclone. The d50c was estimated, with an R-squared value of 97.7%, using an optimized three-layer perceptron, with 4-4-1 architecture. Also an optimized three layers perceptron with 4-2-2 architecture could predict the Uf and Of , with R-squared values of 98.9% and 99.4%, respectively. Promising results can be obtained using ANNs for efficient automatic control of hydrocyclones.
estimation of hydrocyclone parameter d50c with unusual input variables. IEEE 46, 1996, pp. 908–912. LYNCH, A.J. Mineral crushing and grinding circuits their simulation, optimization, design and control, 1977, Elsevier Scientific Publishing. SVAROVSKY, L. Hydrocyclones. 1984, Lancaster, PA, USA Technomic. NAPIER-MUNN, T.J., MORRELL, S., MORRISON, R.D., and KOJOVIC, T. Mineral Comminution Circuits: Their Operation and Optimization. 1996, Australia, JKMRC. WANDER WALT, T.J. and BERNARD, E. Neural nets for the simulation of mineral processing operations, 1993, South Africa, Elsevier Scientific Publishing. WILLS, B.A. Mineral Processing Technology, An Introduction to the practical
References
aspects of ore treatment and mineral processing, 6th edition, 1992,
EREN, H., FUNG, CH., WONG, K., and GUPTA A. Artificial Neural Networks in
Pergamon Press, Oxford.
◆
Appendix A Experimental data Data
No.
Pressure
Solid
Vortex
Apex
Underflow flow
Overflow flow
Cut
drop (psi)
per cent
diameter (mm)
diameter (mm)
rate (t/h)
rate (t/h)
size
1
17.5
6
19
8.75
0.86
4.27
15.81
0.11
2
17.5
6
19
16.25
2.89
3.08
6.74
0.46
separation
Training
Validation
Test
▲
212
Rf
3
15
4
13
20
4.16
0.11
13.98
0.85
4
20
4
13
20
4.67
0.18
12.64
0.91
5
15
4
25
20
3.20
3.80
7.65
0.47
6
17.5
2
19
16.25
2.61
2.94
5.89
0.44
7
20
4
13
12.5
2.41
1.59
1.94
0.52
8
12.5
6
19
16.25
2.36
2.40
6.32
0.47
9
17.5
6
19
16.25
2.85
2.98
6.00
0.51
10
20
8
25
12.5
1.48
6.05
9.75
0.14
11
22.5
6
19
16.25
3.23
3.44
9.74
0.48
12
17.5
6
19
16.25
2.85
3.01
4.28
0.47
13
17.5
10
19
16.25
3.00
3.13
5.19
0.46
14
17.5
6
19
16.25
5.59
5.99
5.43
0.44
15
17.5
6
31
16.25
1.90
5.33
9.62
0.23
16
17.5
6
19
16.25
2.74
2.94
5.09
0.47
17
17.5
6
19
23.75
6.81
0.81
11.64
0.91
18
20
4
25
20
3.60
4.41
6.65
0.47
19
20
8
13
20
5.01
0.06
16.01
0.88
20
15
8
13
20
4.52
0.12
12.52
0.87
21
20
8
13
12.5
2.43
1.52
2.32
0.53
22
20
4
25
12.5
1.01
5.97
10.18
0.13
23
15
8
25
12.5
1.53
5.11
11.09
0.16
24
17.5
6
7
16.25
3.10
1.00
3.24
0.67
25
20
8
25
20
3.92
4.60
5.68
0.46
26
15
8
25
20
3.54
3.99
6.48
0.48 0.50
27
15
4
13
12.5
2.00
1.25
2.16
28
17.5
6
19
16.25
2.82
3.09
5.79
0.49
29
15
4
25
12.5
1.02
5.05
11.08
0.13
30
15
8
13
12.5
2.23
1.39
3.69
0.47
MAY 2010
VOLUME 110
REFEREED PAPER
The Journal of The Southern African Institute of Mining and Metallurgy