Articles
Review of existing and emerging technologies for the production of biofuels in developing countries Philippe Girard and Abigaïl Fallot Biomass Energy Research Unit, Forest Department of CIRAD Centre de Coopération Internationale en Recherche Agronomique pour le Développement (CIRAD) 73, rue Jean-François Breton - TA 10/16 - 34398, Montpellier Cedex 5 - France E-mail:
[email protected]
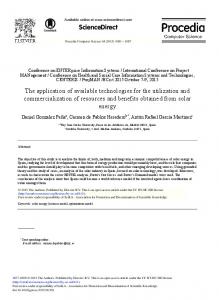
The present energy crisis has reactivated worldwide the interest in biofuels, particularly in developing countries that are dependent on import of petroleum products and may have, in terms of land availability and climatic conditions, the potential for large-scale biomass production. Various routes are possible for converting biomass into transport fuel. Technologies and processes are described and fuel properties compared to those of the fuels they are supposed to substitute. Emphasis is given to the first generation biofuels, biodiesel and bioethanol, as the second-generation biofuels using whole biomass are still at an early stage of development and would require long and strong public support to be available on an industrial scale. A big consideration is biomass supply, as these resources may affect land availability and competition with food and feed production. These aspects are addressed in a separate paper. Small-scale stand-alone power generation is briefly discussed, as is the possible use of straight vegetable oil (SVO). The main barrier to the development of biofuel is economic. That is why cost considerations are developed. However, assessing the cost of biofuel is not easy because the feedstock biomass accounts for the largest part of the total costs and therefore the total cost depends greatly on national policy and subsidy frameworks. The paper concludes with some socio-economic considerations and discusses opportunities for implementing transport biofuel programmes in developing countries. 1. Introduction World energy supply is largely dependent on conventional petroleum products and most of the expected increases in oil demand in the medium term will come from the transport sector, with the largest growth from developing countries. Consequently, the transport sector will become responsible for about one-third of the world’s future greenhouse gas (GHG) emission growth [IEA, 2004] and oil prices may reach dramatically high levels. A number of alternative fuels for transport are potentially available and are currently being used or investigated at different stages of development worldwide (see Figure 1). Today, the term biofuels mostly refers to ethanol and esterified vegetable oil. New products such as methanol, dimethyl ether, Fischer-Tropsch (FT) diesel and ethanol from lignocellulosic feedstock, called second generation biofuels, are benefiting from active R&D programmes. Long-term investigation deals with third generation biofuels, such as hydrogen for fuel cells. Transport biofuel production pathways are numerous and technology choices are closely linked to the biomass type considered. Nevertheless, most biofuels can have the interesting advantages of: • being compatible with existing vehicle engines, in contrast to compressed or liquefied natural gas; and 92
• being amenable to blending with conventional fuels within existing equipment and infrastructure. Upstream, biomass is a local resource that can contribute to the diversification of energy supply and potentially create employment for cultivation, harvesting, transport and fuel preparation. Well-managed, biomass yields carbon emission-saving fuels when substituted for fossil fuels. Amongst renewable energy sources, biomass appears to be the most important in terms of technical and economic feasibility. It is therefore today considered a major future energy source for development and industry, arousing growing interest worldwide, not only for use in transport. Improving energy security and reducing CO2 emissions are primary goals for the development of alternative fuel policies. In many developing countries, saving oil and independence from it may often take precedence as petroleum product imports are a major source of foreign currency expenditure. Large natural gas reserves or the availability of land for energy crops in a given region may influence fuel and, consequently, technology choices. Different lobbies, including engine manufacturers and oil companies, do play significant roles favouring minimal or no modification of the existing types of engine or refuelling infrastructure. Government willingness to support local industry and agriculture will also influence these
Energy for Sustainable Development
z
Volume X No. 2
z
June 2006
Articles
Figure 1. Production pathways for transport fuels from alternatives to crude oil, adapted from [Van Thuijl et al., 2003]. HTU (= “hydrothermal upgrading”) is a registered trademark for a new second-generation biofuel production process being developed in the Netherlands.
choices. As drivers for the development of alternatives to conventional transport fuel are often not technical, it is difficult to assess technology development trends solely on the basis of their technical characteristics. The developing world encompasses countries of very heterogeneous characteristics, particularly where biofuel production opportunities are concerned. Indeed, population density and dynamics, climatic conditions, available infrastructure and capital, land ownership patterns, etc., vary widely from country to country. However, some common characteristics underlie the potential importance of biofuel production and technology choices in developing countries. • The resource: developing countries with high levels of biomass productivity are mostly tropical. In most developing countries, agriculture is the sector on which the major part of the population depends. • The energy sector: energy consumption levels are low, or even very low, but they are increasing rapidly with standards of living and industrialization. Therefore the lock-in effect in favour of fossil fuel may be easier to overcome for alternative energy sources, such as biofuels. For this reason, the technology review presented in this paper is not limited to first generation biofuels such as ethanol from sugar cane or biodiesel from oil crops. It also considers more innovative second generation biofuels offering wider prospects in the short to medium term (within ten years) and possibly leapfrogging, instead of following step by step, paths taken by industrialised countries. • Poverty challenge: given their immediate priorities and levels of unsatisfied basic needs, developing countries are probably not in a position to invest in very longterm R&D from which results cannot be expected
before decades, even if some third generation biofuel technologies may offer more definitive solutions to energy problems. Accounting for these specificities, the purpose of this paper is to give an overview of feedstock and process technologies for biofuel production with a focus on established processes and considerations for emerging technologies of potential interest to developing countries. 2. Biomass feedstock for biofuel processes Biomass that can be converted to biofuels is of two different origins: • conventional agricultural products such as oilseeds and sugar- or starch-rich crops; and • lignocellulosic products and residues. A brief description of the most important feedstocks potentially available in tropical countries is given in the following sections. It should be noted that when taking into account these resources some may have alternative uses and their real availability for energy uses may be limited. 2.1. Conventional agricultural products 2.1.1. Sugar-rich crops Ethanol is traditionally produced from the fermentation of glucose (sugar) by yeast. Therefore sugar cane and sugar beet, which both contain a substantial amount of sugar, constitute the main source of ethanol production worldwide, though the US production from maize is nowadays almost as important in volume as that from sugar cane in Brazil. Other suitable sources of sugar are molasses (a by-product of the sugar industry) and sweet sorghum. According to IEA [2004], about 60 % of the world’s ethanol production comes from sugar crops and molasses, mainly from sugar cane. The Centre-South
Energy for Sustainable Development
z
Volume X No. 2
z
June 2006
93
Articles
region of Brazil, benefiting from good soils and adequate rainfall, is the largest (80 to 85 % of the total Brazilian production [Moreira, 2003]) region of sugar cane and ethanol production with the world’s cheapest production cost, where almost half of the sugar cane production is transformed into ethanol. One advantage of sugar cane is that it is a well-established crop in terms of cultivation, breeding, harvesting and processing. When operated at high efficiency, sugar cane mills and associated distilleries can be a source of extra electricity to be sold to the grid or contributing to rural electrification. As access to electricity is also a major challenge for many developing countries, sugar cane offers this opportunity of polygeneration. Many developing countries are already producing sugar cane. Therefore, the Brazilian production framework is a potentially interesting object of replication. However, crop requirements (water and soil) limit the land available for sugar cane and land availability will certainly constitute a critical limiting factor. Sugar beet is used in Europe [Poitrat, 2005], with a feedstock cost much higher than that of sugar cane. The uses of other sources of biomass such as fruits and to a certain extent sweet sorghum (with present varieties) might be limited by cost-effectiveness. Research is still needed to develop their cultivation. 2.1.2. Starch-rich crops Because starch is easily converted into sugars, the largest part of ethanol produced in OECD (Northern) countries comes from cereals. The potential feedstock includes maize, wheat, potato, cassava, and sweet potato. Maize, which accounts for 90 % of US ethanol production, is by far the largest feedstock used for ethanol production worldwide [ERFA, 2005]. In the conversion of grain to ethanol, only the starchy part of the feedstock is used, which represents a relatively small percentage of the total plant mass, in particular when compared to the cellulosic part (husk and straw for wheat). Even starchy grain alone when used for ethanol production results in numerous coand by-products such as animal feed, gluten, high-fructose maize syrups, and others. 2.1.3. Oilseeds Vegetable oils can be extracted from several types of seeds and fruit pulps. Rapeseed oil, palm oil and sunflower oil are the most common industrial feedstocks, particularly for biodiesel production. Feedstocks are characterized by the type and concentration of their fatty acids: generally, saturated, mono-unsaturated, or poly-unsaturated. Choice of the oils to be used depends on process chemistry and economics. For the process itself, the main difference between different vegetable oils (or fats) is the amount of free fatty acids that are associated with the triglycerides as well as the content of other contaminants such as odour compounds that can reduce the quality of the glycerine produced. Free fatty acids present in oil will react with alkali catalyst used to facilitate the esterification reaction to form soap, an undesirable reaction that deactivates the catalyst. Feedstocks with similar compositions can be used interchangeably in processes designed for those compositions, enabling the use of lower-cost feedstocks when 94
they are available. For biodiesel, the ideal feedstock is composed of 100 % triglyceride because the triglyceride will react with three molecules of methanol to produce three molecules of methyl ester (biodiesel) and one molecule of glycerol. As with starchy crops, biofuel production from oil crops results in co- and by-products, namely animal feed from cake. This by-product is of importance for some developing countries, e.g., in many countries in Africa where animal feed availability is problematic. In Burkina Faso oil extracted from cotton seed is as cheap as or often cheaper than cotton seed cake sold for animal feed. The vast potential of biodiesel from oil biomass is under investigation in several countries such as India, which decided in 2003 to aim at 20 % biodiesel blending by 2011, or Brazil which launched its national biodiesel programme in December 2004 [CenDoTec, 2004]. Concrete plans are being formulated to use wastelands for tree-borne oilseed plantations such as Jatropha curcas and other interesting native oil-rich plants as they do not compete with food crops. Data on productivity are limited and to a certain extent contradictory [Riedacker and Roy, 1998]. However, plant selection and improvement of agricultural practices are likely to increase productivity. The amount of oil biomass potentially available for energy on a country-by-country basis is not a fixed estimate. Indeed, production, demand, exports and prices greatly depend on area actually planted, climatic conditions, percentage of oil extracted from seeds, food and feed demand, competing uses, and even exchange rates. 2.2. Lignocellulosic products and residues The main components of a plant are neither sugar nor starch but cellulose, hemi-cellulose and lignin, as illustrated in Table 1. Lignocellulosic biofuel feedstocks are potentially more abundant and cheaper than feedstocks from conventional agriculture (e.g., seeds) because they compete less directly with food crops. In principle, there are numerous potential benefits from developing and improving biofuel production from cellulose with second generation biofuels: conflicts with land use for food production are reduced, since residues can be used or plantations can use set-aside land, incomes for farmers can be improved through better use of by-products, potential and yield in terms of toe/ha (tonnes of oil equivalent biofuel per hectare of land required) can be increased, and net GHG emissions can be reduced, there are opportunities to use set-aside land and poorer soils for energy plantations such as short rotation and fast-growing tree species (willow, poplar, eucalyptus), and there is the possibility of using residues and municipal solid waste (MSW). 2.2.1. Wood Woody biomass, including wood itself and forest and wood-processing industry residues, accounts for the largest fraction of renewable energy used globally today. It represents more than 60 % of the total primary energy consumption for many developing countries and can reach up to 80 % or more for the poorest African countries (Mali, Niger, etc.). Wood is a well-known product and presents interesting characteristics such as relatively high
Energy for Sustainable Development
z
Volume X No. 2
z
June 2006
Articles
Table 1. Residues (lignocellulosic fraction) and dry weight ratio of straw to grain for different crops [Lal, 2005] Crops
Residue amount on dry weight basis (t/ha/yr)[1]
Range of straw/grain ratio[2]
Barley
4.3
0.82-2.50
Maize
10.1
0.55-1.50
Cotton
6.7
0.95-2.0
Rapeseed
-
1.25-2.0
Soybean
-
0.8-2.6
Rice
6.7
0.75-2.5
Sorghum
8.4
0.85-2.0
Wheat
5.0
1.10-2.57
Notes 1. These data are average figures that may vary over a wide range depending on soil fertility, the use of fertilisers and pesticides, and the quality and the variety of the seeds. 2. The lowest grain yield generally corresponds to the largest straw (residue) yield. It results from the low quality of seeds typically used in several developing countries.
density and a low level of impurities compared to other kinds of biomass. It therefore constitutes a perfect feedstock for biofuel production. However, partly due to these properties, it is also widely used for ther making other products, e.g., paper, timber, particle board and fibreboard, and consequently constitutes one of the most expensive feedstocks. Wood residues, consisting of logging residues (tops, branches) and process residues (off-cuts, sawdust) from wood industries, and demolition wood, constitute a large potential which might be available at lower prices compared to logs. The availability of these resources depends on the efficiency of the industry they come from. Typical residue yield from a tropical sawmill for export is between 15 and 20 % of the total biomass (full tree), or 30 to 45 % of the actual biomass (e.g., logs) delivered to the sawmill. These biomass types vary in composition, volume and quality (particularly moisture content – from 12 to 55 % on a dry basis), depending on the processing steps and soils of origin. Depending on particle size, the bulk density may also vary significantly, which often requires a preliminary pre-treatment in order to make it appropriate for downstream processing. 2.2.2. Energy plantations Energy plantations are grown and harvested to specifically provide energy. They are already well established, e.g., in Brazil where eucalyptus plantations supply charcoal to the steel industry [Claret, 2003] and logs to pulp/paper mills. Plantations can be grown on lower-quality land, hence do not necessarily compete with other agricultural activities aimed at food production. They also require fewer inputs (pesticides and fertilizers). However, particular attention should be paid to species selection and large monocultures. In the long term, the highest potentials will result from the use of local and mixed species together with agro-forestry practices preserving biodiversity. The productivity of a plantation varies according to many factors
relating to species and plant selection, plantation, and maintenance techniques. In addition, the location plays a large part in the productivity. When water is not the limiting factor, tropical countries benefit from favourable climatic conditions, allowing two to three times higher productivity than in temperate countries. In Brazil [Lima, 1996], significant gains in productivity were achieved with the adoption of more intensive forestry techniques (preparation of the soil, fertilization, breeding, etc.); from an average 15 m3/ha/year productivity in 1967 to 21 m3/ha/year today. With the introduction of new materials and through clone selection, 40 m3/ha/year has been achieved [Wichert, 2005]. If the full tree utilisation maximises the short-term biomass yield, it can also mean greater removal of soil nutrients. If the nutrient balance is not carefully controlled, it can affect wood yields and biodiversity. Thus, the plantation sustainability would require an increasing use of fertilisers. It is therefore important to find an appropriate balance between high biomass yields and long-term fertility of soils. Achieving such a balance is relatively easy in practice, since the largest part of the hydrocarbon content of a tree is bound in stems, while the majority of nutrients are contained in leaves and branches. Hence, after felling, it is the common practice in eucalyptus plantations in Brazil for example to leave the whole tree on the ground for a couple of weeks. During this period, along with a significant drop in moisture, the leaves and small branches drop off, returning nutrients to the soil [Kornexl, 2001]. Growing dedicated herbaceous crops for energy purposes is also possible. However, information on various aspects of their cultivation is still limited despite intensive research, particularly in the USA and the EU. The main herbaceous species considered for energy application are miscanthus, switch grass and cane fibre. Compared with short rotation forest plantation, herbaceous crops have lower moisture content, from 10 to 30 %, but are bulkier products, increasing transportation costs. Their ash content is higher (from 3 to 12 % for miscanthus and sunflower stalks, respectively [Agrice, 1998]); with a broader composition, including some undesirable compounds which may create rapid deactivation or poisoning of processing catalysts, as well as some corrosion and slag problems with some high-temperature conversion processes such as gasification. 2.2.3. Agri-based residues Agriculture and agro-industries are currently large providers of biomass resources. The availability of residue byproducts depends on objectives pursued for the corresponding main crop and on world market prices. Byproducts do not exhibit autonomous market behaviour. Depending on the criteria authors refer to, the total world potential is enormous, varying from to 9.5 EJ/year [Vaitilingom, 2005] to 55 EJ/year [Hall, 1993]. If these figures appear significant, the real availability is much less in practice, limited by a number of factors. China and India by far present the largest agri-based residue potential. This is mainly due to their rice by-products, straw and husk, which represent 83 and 71 % of their respective agricultural
Energy for Sustainable Development
z
Volume X No. 2
z
June 2006
95
Articles
residue potentials. Rice straw accounts for 56 % of the global potential of the top ten residues, followed by bagasse (15 %) and rice husk and cotton stalks at 10 % each. The net availability of residues per hectare depends on the crop itself and its specific residues-to-crop ratio (see Table 1) as well as on climatic conditions and alternative uses. Residues are a source of fertiliser, sometimes the only one. Thus an important fraction of the biomass is or should be left or reintroduced on the soil. Farmers also consume a significant fraction as bed material for livestock and animal feed. Due to bans on field-burning and the development of more intensive livestock practices, straw is largely available in industrialised countries. However, in tropical countries, alternative uses and the weakness of infrastructure for transport currently limit its availability. The same remark applies to cotton stalks, corn cobs and other herbaceous feedstock. Nevertheless, it can be assumed that a significant share of the straw would be available particularly in countries with economies in transition because the production in these countries generally results in greater availability than needed. Cane trash and bagasse are produced during the harvesting and milling period of sugar cane, which normally lasts 5 to 7 months. Cane trash consists of sugar cane tops and leaves. Nowadays, it is mostly burnt in the field as sugar mills are already largely self-sufficient in energy. The bagasse produced is already used in existing sugar mills to meet their own electricity and heat demand. However, existing milling and power generation equipment have limited efficiency and a large part of this bagasse could be available through energy efficiency programmes. Of the world’s sugar mills, more than half have a potential for electricity export generating capacity greater than 5 MWe (and in many cases much greater than 5 MWe). Bagasse and cane trash constitute an important potential source of biofuel feedstock. However, upgrading techniques and equipment adequately might not benefit transport fuel production because in many countries (India, Thailand, Philippines, etc.) real incentives exist to produce electricity, e.g., through independent power producer (IPP) arrangements, but similar incentives for biofuel production do not exist. Rice husk, the main by-product from rice-milling, accounts for roughly 22 % of paddy weight, while the rice straw-to-paddy ratio ranges from 1.0 to 4.3, depending on the species. In general there is a large excess of rice husk, whose disposal can add to the rice-millers’ costs. The type and particularly the size of the rice mill affect the real availability of rice husk. Indeed, large producers such as Indonesia and to a certain extent India present industrial sectors characterised by a large number of very small mills spread all over the country. Despite a large potential of unused rice husk, collecting this feedstock is often not economically viable. When the industry is well established, the growing demand for parboiling rice increases the use of rice husk to meet the heat needed by the mill. Large CHP plants up to 10 MWe are in operation in Thailand and in India, fed by rice husk. 96
3. Biofuel conversion technologies: state of the art The scope of this section is to describe the main supply chains for the production of different biofuels in both technical and economic terms. For each technology, the required biomass characteristics and degrees of maturity will be presented for discussion. Second generation biofuels will only be briefly presented as their maturity is expected to be effective only in ten years’ time. 3.1. Bioethanol production Ethanol can be produced from any feedstock that contains sugar or compounds such as starch or cellulose that can be converted into sugar. 3.1.1. Conversion technologies 3.1.1.1. From sugar, fermentation and distillation The oldest way of producing ethanol is fermentation of glucose recovered by soaking, crushing or chemical extraction from a sugar-rich feedstock. Glucose is fermented to alcohol using yeast and other micro-organisms. The final step purifies the alcohol by distillation to the desired concentration. In most countries making ethanol, all the water is removed to produce anhydrous ethanol (99.3 % ethanol) that can be blended with petrol. In Brazil 60 % of the ethanol is sold in hydrated form (93 % ethanol by volume, 7 % water) for use as a neat fuel. 3.1.1.2. From starch, hydrolysis then fermentation and distillation Starch consists of a long chain of glucose molecules that have to be broken down into simpler sugars by hydrolysis before their fermentation. The first step of the hydrolysis process consists of milling the grain to free the starch from the raw material. This step can be dry or wet. The starch is converted into sugar in hot dilute phase to dissolve the water-soluble starch and maintain the activity of the yeast. The starchy material is converted continuously into short-chain carbohydrates. For the development of the yeast needed for the fermentation process, the solution must be slightly acid (pH ~5.0). Therefore, hydrolysis can be achieved by the addition of dilute mineral acid to the grain slurry before cooking (acid hydrolysis process). Due to the presence of water, the ethanol produced is dilute. Through a series of distillation and dehydratation steps the ethanol is purified down to the desired concentration. Figure 2 presents the dry milling process scheme. As in the case of sugar, these technologies are well established. 3.1.1.3. From cellulose, saccharification, then fermentation and distillation For the conversion of cellulosic material to ethanol, two key steps are necessary. At first, cellulose and hemi-cellulose must be broken down into small carbohydrates. This step results in a complex mixture of a wide variety of sugars, making the second step quite challenging, since different organisms are required to ferment different sugars into ethanol. The first step is currently the subject of intense R&D worldwide and particularly in the USA as it remains the major bottleneck in the development of this route. The conversion (hydrolysis) of cellulose to sugar can be realised using diluted acid, concentrated acids or enzymes (cellulase). Enzymatic hydrolysis of cellulose is
Energy for Sustainable Development
z
Volume X No. 2
z
June 2006
Articles
Figure 2. Ethanol production from grain dry milling [Reith et al., 2001]
Table 2. Ethanol production efficiency (adapted from [IEA, 2004; Moreira, 2003; Wang, 2001; Levelton, 2000]) Biomass ethanol production
Cane
Technology route
Beet
Maize
Fermentation, distillation
Process efficiency (energy in/energy out) Ethanol production efficiency (l/dry t biomass feedstock) Well-to-wheels GHG emission compared to petrol (%) reduction/km travelled
Wheat
Hydrolysis/fermentation, distillation
Cellulosic biomass Wood
Straw
Maize residues
0.12 0.098
0.64 0.56
0.54 (dry mill) 0.75 (wet mill)
0.98 0.81
1.90 1.20
1.12
1.10
73 90
54.1 101.3
387.7 372.8
348.9 346.5
N.a. 288
330
345
N.a. 92
50 56
32 25
29 47
51 107
57
61
Note Process energy includes both biomass and non-biomass energy sources. The table gives when possible the range of estimates reported in the papers.
clearly preferred to acid hydrolysis from a process and environmental point of view. However, this route is still under development. There are numerous publications available on the subject [Sun and Cheng, 2002; NAL, 2005]. 3.1.2. Conversion efficiency of bioethanol production One of the main intrinsic drawbacks of bioethanol production processes is related to the large CO2 release into the atmosphere as a result of energy consumed to run the process. In conventional bioethanol plants based on sugar beet or starch the processing into ethanol requires 80 % of the total energy consumption (electricity 10 %, heat 70 %), while agricultural production accounts for only 20 % [ADEME-DIREM, 2002]. Bioethanol production from cellulose using side products (lignin) for combined heat and power generation would result in significant cost reduction. Process efficiency on an overall basis is the most important parameter to assess the performance of options, as it will affect the net GHG emission reduction as well as the cost. It would also have a considerable impact on the plant capacity requirement, which most probably will constitute one of the bottlenecks of some of the options. Regarding efficiency, a large number of studies have been carried out in the past 15 years, yielding a wide range of figures, because:
• the degree of maturity of the technology is not the same and it is difficult to fairly compare actual figures to expected results for “promising technologies” experimented with on a pilot-scale basis; • assessment methodologies have evolved since the first work done on the subject, particularly life-cycle analysis (LCA); • all studies do not take into account the same factors; and • the context of the study may also considerably affect the impact on the process, e.g., fuel used for the generation of the electricity used (whether from coal, nuclear or any other source). To limit distortions caused by the various sources listed above, information provided in Table 2 comes from the most recent studies. It shows that one energy unit of ethanol requires respectively 0.5 to 0.6 and 0.9 to 1.0 units of fossil energy for its production from maize and wheat, respectively. The production efficiency varies between 346 and 398 l ethanol/dry t feedstock. It represents, for maize, a productivity between 2570 and 3113 l/ha, with crop yields considered between 5.65 and 7.97 t/ha. Ethanol from sugar cane in Brazil shows the best performance in terms of both energy efficiency and net GHG emissions. This is due to the high productivity of the
Energy for Sustainable Development
z
Volume X No. 2
z
June 2006
97
Articles
tropical crop and the high degree of integration of the plant where bagasse can largely cover the plant energy needs. However, in many sugar industries worldwide, including Brazil in the North-east region, additional fossil energy is required as the process design or the equipment is too old. Nevertheless, it can be expected that the highest efficiency achieved in the best Brazilian mills will become the average value in the short term for all Brazil as well as several other countries (Thailand, India, etc.). Indeed, increasing oil prices have prompted countries to elaborate policies in favour of biofuels. In India, the government declared the use of 5 % ethanol blend in petrol mandatory in nine states and four Union Territories (areas administered by the federal government) by the end of 2003. There are limited opportunities for further energy balance improvement or cost reduction for these routes. Most of the research and development nowadays focuses on the lignocellulosic route where it is expected, as in sugar cane conversion, that lignin and other unconverted products would supply the energy process requirements and may produce additional electricity [Sims, 2004; USDOE, 1999]. The main drawback of this option may concern the type of feedstock used and the total fossil fuel required for the collection and the transport of large volumes of biomass (straw for example), or in fertilizer, depending on the type of biomass, the situation and the size of plants. 3.1.3. Economics of bioethanol production As is the case with other biofuels, the largest bioethanol cost component for sugar or starch-based production (as illustrated in Figure 3) is the feedstock (58 to 65 %), although typically about 50 % of this cost can be paid back by sale of co-products. The plant size also has a major impact on the cost. For instance, tripling the size of maize mills, dry or wet, would result in cost reductions of 0.05 to 0.06 US$/l: 40 % on specific investment and 15 to 20 % on operating costs [Moreira, 2003]. Ethanol production from lignocellulosic material is more capital intensive than conventional sugar/starch plants due to the complexity of the process. Enzymes are also very expensive (0.12 US$/l) [Wooley et al., 1999] and the hydrolysis step is long (48 to 72 hours). A study carried out by NREL for the IEA Bioenergy implementing agreement gives estimates of investment and production costs of ethanol from poplar in the US and Canada. It shows that for a 2000 t/day plant capacity (198 Ml/year), the estimated investment cost ranges between US$ 205 and 234 million and that it is expected to go down to US$ 159 million by 2010 [IEA, 2000]. These figures represent a specific capital cost between 0.139 and 0.177 US$/l, compared to 0.05 from corn (maize) in the US, between 0.06 and 0.1 from wheat or beet in the EU and 0.05 from cane in Brazil. Because bioethanol from cellulose can also benefit from cheap feedstock, it is expected to be competitive by 2010. 3.2. Vegetable oil for straight use (SVO) or biodiesel Vegetable oil can be used as fuel in a variety of ways: directly as a fuel in a boiler or a stationary genset or car or tractor engine, processed into biodiesel (fatty acid 98
esters) or processed into “bio-distillates” through refinery technology. 3.2.1 Straight vegetable oil (SVO) Fuel properties (freezing point, cetane number and viscosity), hence suitability of SVO as a transport fuel in a conventional car, vary with fatty acid composition and the presence of minor compounds such as sterols, antioxidants and phosphatides. To overcome problems and allow the use of a wider range of vegetable oils on a large scale without engine modification and with environmental impact improvements, oils (triglycerides) are transformed into smaller molecules by means of esterification with alcohol, mainly methanol (see below). 3.2.1.1. Conversion technologies and efficiency Extraction techniques are well known worldwide and most of the equipment used in several industries is manufactured in developing countries. Extraction of vegetable oil from seeds can be done mechanically or by a solvent such as hexane, for both SVO and esters. The latter results in a higher yield and is generally applied for biodiesel production. If we consider that approximately on average one litre of biomass oil plus 10 % methanol are needed to make 1 litre of biodiesel and 350 g of glycerol, the biofuel production yield is high. However, oil yields per hectare greatly vary, as illustrated in Table 3. Palm oil is certainly one of the most productive crops. However, this production is deeply related to climatic conditions (rainfall) and the quality of the soil. Direct use of vegetable oil in an indirect injection engine is possible. However, to avoid deposit and dust formation the engine should be hot, which will require double injection: once with diesel for start-up and once for SVO. Often the SVO injection is pre-heated to reduce its viscosity (4.2 cSt and 77 cSt at 20ºC respectively for diesel and rapeseed oil). With modern direct injection engines, modification of the piston is required to increase the combustion temperature and avoid deposits and unburnt oil. Several kits can be purchased, particularly in Germany [ELSBETT, 2005], with guidelines for their use online [ROULEMAFLEUR, 2005]. Their cost is approximately between US$ 700 and 2000 per unit. A quality standard has been set up specifically for SVO from rapeseed: DIN UA 632. Vegetable oils are mixtures of triglycerides from various fatty acids. The composition of vegetable oils varies with the plant source. Therefore, the chemical and physical properties of oils and the esters derived from them vary with the nature of the fatty acids. Table 4 shows the relative impact of biomass oil composition on fuel properties. Several documents report specific data on these properties for various types of feedstock as well as fatty acid esters [USEPA, 2002a]. 3.2.1.2. Economics of SVO Worldwide, the direct use of vegetable oil in tractors, cars or stationary engines for water-pumping, power generation etc., is relatively common, although not widely spread. In New Caledonia, a project aiming at using copra oil to supply energy in Ouvea island resulted in the large
Energy for Sustainable Development
z
Volume X No. 2
z
June 2006
Articles
Figure 3. Comparison of bioethanol low and high production costs breakdown, compared to gasoline on a volume basis; figures from Europe, the USA and Brazil in $/l [IEA, 2004; Laydner, 2003; Enguidanos et al., 2002] Note In the case of petrol full cost (mid-2004) is given for comparison. Low and high prices correspond to different world market prices. These figures are only indicative as great variation occurs and because cost breakdown is not always provided. The largest part of “other cost” is capital cost. Finally, costs shown do not reflect direct subsidies. Biofuel sectors are often heavily subsidised. Differences observed between the EU and the US can be partly explained by the difference in subsidy schemes in agriculture.
use of copra oil for 600 kWe of power generation, a seawater desalination unit and several water-pumping units as well as for cars and pick-ups of the cooperative [Vaitilingom et al., 2000]. The use of SVO allows farmers to avoid oil taxes and large price fluctuations. However, the feasibility of such a route is probably difficult for individual farmers considering the investments required for oil extraction, filtration, and storage, engine modifications as well as seed prices. Feasibility and economic attractiveness are much higher on the cooperative or village scale, where investments can be shared and relate to larger SVO volumes. Pilot units are under development in Brazilian Amazonia using mainly palm oil [CENBIO, 2004]. The present world SVO consumption level is not well known. In several, particularly developing, countries, SVO is or has been used on a project basis (palm oil in Malaysia, Jatropha in India). However, the use of SVO may not be compatible with some standards on emissions, for instance the European EN590 standard (see Table 5).
Compared to diesel, because combustion temperature is lower, NOx emission is reduced by 25 % for SVO in a modern diesel engine. However, CO emission can be twice as high [Hemmerlein et al., 2002]. Measurements are still needed as very few documents report data. 3.2.2. Esterification for biodiesel production Europe has largely contributed to the development of biodiesel, mainly from rapeseed. 3.2.2.1. Conversion technologies and efficiency Methyl ester is generally produced through catalytic transesterification of the oil with methanol. Oil molecules are broken apart and reformed into esters and glycerol, which are then separated from each other and purified. These processes are well known and well documented [IPEF, 2005; Van Gerpen et al., 2004; USEPA, 2001]. While a variety of esterification types exists, most processes follow the same scheme. Depending on the biomass oil, additives might be used to adjust properties and characteristics. Pre-treated oils and fats are mixed with
Energy for Sustainable Development
z
Volume X No. 2
z
June 2006
99
Articles
Table 3. Yields and some properties for vegetable oil and biodiesel per ha [Van Gerpen et al., 2004; CYBERLIPID, 2005; JATROPHAWORLD, 2005; Ballerini, 2006] Crop
Seed yield t/ha
Viscosity at 40ºC (mm2/s)
Cetane number
Oil content wt %
Litres SVO per ha
Litres biodiesel per ha
Soybean
2.67
33.1
38.1
18
481
524
Cottonseed
1.05
33.7
33.7
19
200
216
Canola
1.54
40
616
665
Sunflower
1.52
34.4
36.7
40
608
657
Peanut
3.40
40.0
34.6
25
850
920
Rapeseed
1.47
37.3
37.5
40
588
638
Mustard (spice)
1.04
40
416
452
Jatropha Palm oil
2 20 (fresh fruit bunches)
49.9
40-45
37
740
701
63.6
42
49
2760
3000
Note The very high yield of palm oil corresponds to Asian figures (Malaysia, Indonesia) and is due to generally very favourable climatic conditions, which unfortunately are not common in Africa or Latin America.
the alcohol and the catalyst, as illustrated in Figure 4. Esterification is highly efficient, with yields exceeding 99 %. Processes are batch or continuous. A batch system is usable in smaller units. The technology may appear simple but its control under industrial conditions to match transport fuel standards requires appropriate technology which may be difficult to handle for small producers even if there are no downsizing limits in principle. In Brazil, where the production of biodiesel started with seven producers, only two were able to respect the local quality standards adapted from the EU standards. Steam requirements, the use of catalysts, and quality control do not favour small-scale biodiesel plants. The lower size limit for feasibility is also very dependent on national economic contexts and oil prices. For small-scale consumption in villages or small-city stationary applications, SVO appears more favourable because total investment costs remain limited. For esterification, methanol offers better process efficiency than ethanol, given ethanol’s affinity with water. The kinetics of the esterification process with ethanol are also slower, increasing specific capital costs. New routes are under investigation in Canada and the US, particularly to convert biomass oil into hydrocarbon fuel, using conventional existing petroleum refinery technology with minor modification. This approach would allow significant cost reduction as existing infrastructure could be used. However, technical limits in terms of feedstock quality requirements and the share of biomass oil in refining volumes are still unclear. 3.2.2.2. Economics of biodiesel production by esterification The cost of seeds represents the largest part of biodiesel production costs – from 60 to 80 % of the total cost [IPEF, 2005]. Seed production costs vary widely depending on where the crop is grown: quality of soils and seeds, climate, quantity and prices of fertilizers and pesticides, etc., are all elements that will affect yields and production 100
Table 4. SVO composition and impact on fuel properties [Thyson et al., 2004] Saturated
Monounsaturated
Polyunsaturated
Cetane number
High
Medium
Low
Cloud point
High
Medium
Low
Stability
High
Medium
Low
Reduction
Medium increase
Large increase
NOx emissions
costs. For a 150 to 200 Ml per year conventional plant, total non-feedstock production costs will be less than 0.05 US$/l of biodiesel, representing only 7 to 15 % of the total production cost. Glycerine is an unavoidable co-product of biodiesel. At current glycerine market prices, glycerine credit reduces biodiesel costs by US$ 0.05 to 0.1/l of biodiesel in the EU. A large biodiesel expansion would flood the international market with glycerine. Only the development of new applications for glycerol would allow a rapid growth of the biodiesel industry. The amount and value of the co-products play a critical role in the seed oil prices as the price of oilseeds, cake and oil are intrinsically bound together. Producing or crushing seeds of high oil content is not necessarily cheaper than producing or crushing seeds with a lower oil content, all other things being equal depending on the credit that co-products offer. Some systems use fixed catalysts, reducing variable costs but raising fixed costs. Some systems are catalystfree, which might save as much as US$ 0.05/l in processing costs, but raise capital and energy costs because these systems tend to use high pressure and temperature [Reith et al., 2001]. Even if non-feedstock costs could be reduced by half, the savings are generally not enough to make biodiesel competitive with diesel fuel because of feedstock costs, as Figure 5 illustrates.
Energy for Sustainable Development
z
Volume X No. 2
z
June 2006
Articles
Table 5. Emission limit values (g/kWh) according to the engine power rate (kW) [EU, 2002] Power range (kW)
18-37
37-75
75-130
130-560
31-12-2001
31-12-2003
30-06-2003
30-06-2002
CO (g/kWh)
5.5
5.0
5.0
3.5
HC (g/kWh)
1.5
1.3
1.0
1.0
NOx (g/kWh)
8.0
7.0
6.0
6.0
PM (g/kWh)
0.8
0.4
0.3
0.2
Compliance dates for 2000/25/EC
Figure 4. General conversion process for biodiesel production from vegetable oil [Poitrat, 2004]
Table 6 presents investment costs as a function of plant capacity. It shows that economies of scale are much larger from small to medium scales than from medium to large. Costs might be lower with biodiesel produced from waste oils or fats. However, limited availability of this feedstock would limit the volume of biodiesel production and probably result in small-scale implementation with higher non-feedstock production costs. 3.3. Advanced biofuel synthesis (second generation) Promising routes to convert biomass into liquid are by means of gasification followed by syngas conversion. All biomass compounds – hemi-cellulose, cellulose and lignin – can be converted into a H2/CO rich syngas. Among obtainable fuels are methanol, diesel and petrol through Fischer-Tropsch (FT) synthesis and dimethyl ether (DME). Several comprehensive and well-documented publications
have been recently released on the subject by IEA [Moreira, 2003], ECN [Van Thuijl et al., 2003], and the European joint research centre ISPRA [Kavalov and Peteves, 2005]. They do not focus on developing countries but constitute a major source of technical information. The following review draws on these publications. The general scheme of this process, also known as biomassto-liquid (BTL) route, is summarized in Figure 6. The thermochemical routes start from a biomass feedstock, which is converted into a syngas by means of different steps consisting of: 1. pre-treatment/upgrading of biomass; 2. conversion of the biomass feedstock to a gas rich in CO and H2; 3. gas-cleaning and -conditioning; and 4. synthesis.
Energy for Sustainable Development
z
Volume X No. 2
z
June 2006
101
Articles
Figure 5. Biodiesel production cost breakdown (Europe, USA and India) in US$/l [Faaij, 2002] Notes Diesel oil costs are full cost fluctuation depending on the oil price (mid-2004). Long-term cost of biodiesel is an estimate on the basis of better use of co-products, particularly glycerol, enabled by lower glycerol cost such as polymers and ethers, and the integration with biorefineries [Thyson, 2004].
Table 6. Capital cost estimates as a function of scale [Kearney, 1998, cited in Thyson et al., 2004] Plant size (Ml/year)
Low Total investment cost (million US$)
Specific investment cost (US$/l/yr)
Total investment cost (million US$)
Specific investment cost (US$/l/yr)
4
1.9
0.475
3.1
0.775
60
9.5
0.158
15.8
0.263
150
19.7
0.131
32.8
0.218
First steps of the process are quite similar whatever the final product. Only the gas-conditioning to modify the H2/CO ratio and particularly the synthesis will be specific to the targeted fuel, i.e., methanol, FT diesel or DME. As LNG or CNG would require adaptations of both the vehicle engine and the refuelling infrastructure, its potential interest would probably be limited to countries already equipped for LNG or CNG consumption (Italy for instance). Since the biomass route will hardly compete with natural gas, we shall not go into further detail on LNG/CNG from biomass. To convert a biomass feedstock into a suitable gas for the synthesis of transport fuel, a gasification process is applied, either air/oxygen gasification, steam gasification or more advanced processes such as gasification in supercritical water. The gasification process yields a CO/H2rich gas. Depending on the oxidation agent (steam or air-oxygen), the overall maximum stoichiometry of the reaction of biomass will drive the overall gas composition. 102
High
Typical hydrogen yields are 170 kg H2 per tonne (t) of biomass for steam reforming and 140 kg H2/t of biomass for oxygen gasification followed by a shift. In the case of direct gasification processes, the heat necessary for the process is produced by the internal substoichiometric combustion of part of the biomass fed into the gasifier. Both air-blown and pure oxygen biomass gasifiers are used for direct gasification. When oxygen is used, a nitrogen-free synthesis gas is produced, but the use of oxygen leads to higher operating costs and lower global energy efficiency. Indirect gasification processes use heat that is generated by burning part of the biomass outside the gasifier or that comes from an external source of energy. The heat is generally fed to the gasifier with steam. Using steam increases the hydrogen content in the raw gas. However, due to the low temperatures applied, the tar content in the gas is still rather high. For several decades, different types of reactors have been developed for biomass gasification,
Energy for Sustainable Development
z
Volume X No. 2
z
June 2006
Articles
Table 7. Main components and properties of gases obtained via different gasification concepts [Van Thuijl et al., 2003] Gas composition vol. % dry
Air-blown atmospheric CFB
O2 atmospheric CFB
O2 pressurized CFB
H2O atmospheric
O2 pressurised entrained flow
CO
19.3
26.9
16.1
42.5
46.1
H2
15.6
33.1
18.3
23.1
26.6
CO2
15.0
29.9
35.4
12.3
26.9
CH4
4.2
7.0
13.5
16.6
0.0
44.5
0.7
12.3
0.0
0.4
N2
1.4
2.4
4.4
5.5
0.0
Net calorific value (MJ/m3)
5.76
8.85
8.44
13.64
7.43
H2/CO ratio
0.81
1.23
1.14
0.54
0.58
C2
Figure 6. General biomass gasification conversion scheme to biofuels
such as fixed beds, fluid beds and entrained beds. It is important to consider that many of the gasification concepts were originally developed and optimized for the production of electricity for which the syngas quality requirements are less strict than for synthesis applications. R&D is still needed on upstream technologies for biomass gasification/gas clean-up that are not quite ready, and a number of process configurations are being experimented with. Nevertheless, the gasification route for syngas production is already demonstrated by: • SVZ Schwarze Pumpe GmbH (Germany) producing methanol from different types of biomass and coal; and • SASOL (South Africa) for Fischer-Tropsch synthesis from coal, among others [SASOL, 2005]. Benefit should be expected from these industrial plants (particularly SASOL) even if the use of biomass entails different constraints on gasification and gas-cleaning compared to coal. The number of projects aiming at producing syngas from biomass by thermochemical processes is limited but
significantly increasing in the past couple of years in a number of countries, particularly Germany. New advanced systems are being developed with a complete biofuel production scheme, e.g., the BTL demonstration activities of Choren GmbH supported by EU (including DaimlerChrysler AG and Volkswagen among others) produced the first quantities of BTL fuels from wood chips in 2004 [Kavalov and Peteves, 2005]. The synthesis gas resulting from any thermochemical biomass conversion system contains carbon monoxide, carbon dioxide, hydrogen, methane, water and possibly nitrogen. The composition of syngas varies, depending on raw biomass composition and operating conditions, as illustrated in Table 7. Typically syngas would need further cleaning as it is contaminated by impurities, and conditioning such as shift reaction to adjust its composition in terms of H2 and CO. Basically, these operations are similar to those of existing coal- or natural gas-based systems. Thus, gas quality requirements are the same. One aspect of special importance is the presence of tar in the raw gas, with a much higher concentration and a
Energy for Sustainable Development
z
Volume X No. 2
z
June 2006
103
Articles
wider composition when biomass has been gasified rather than coal. During the last two decades, enormous efforts have been put into the development of tar removal/conversion technology, with limited success. The gas also contains other contaminants such as small char particles, chlorides, sulphur, alkali metals and nitrogen compounds, as illustrated in Table 8. These contaminants must be removed, since they would decrease the catalyst activity in the gas reformer, the shift and synthesis reactor and may cause corrosion and fouling problems in heat exchangers and pipes. Impurities can be removed using conventional cold gascleaning trains including cyclones and scrubbers. However, the very strict requirements of the synthesis catalysts make gas-cleaning the major challenge for the coming years. More advanced and efficient, but still not proven, hot gas-cleaning devices using hot gas filters and catalyst are being pursued. After being cleaned, the syngas is conditioned. Further steps then include processes such as CO2 removal and reforming. During the conditioning step, the gas hydrocarbons are converted by steam reforming to H2 and CO, over a nickel catalyst. Auto-thermal reforming is preferred as it is cheaper to operate. However, coking may occur, the prevention of which would require higher steam consumption. H2 and CO must be available in the ratios of 2 for methanol production and 2.1 for FT synthesis. As Table 7 shows, the proportion of hydrogen in the raw gas is usually lower than required. This is why the proportions of these two components must be adjusted via a water-gas shift reaction. The CO reacts with water to produce CO2 and H2. The CO2 is removed afterwards by means of chemical or physical absorption. The synthesis gas is compressed and transported to the final synthesis reactor. Biofuels produced by gasification and synthesis processes are very clean fuels as the syngas cleaning and conditioning steps are very demanding. For the production of 1 t of FT diesel about 8.5 dry t of wood are necessary, representing a yield of about 150 l of FT diesel per t of wood [Boerrigter et al., 2002]. Increasing efficiency is expected and 200 l/t should be reached through advanced gasification technology that is able to achieve a more appropriate H2/CO ratio. With such performance, fast-growing plantations under tropical climatic conditions found in various developing countries would considerably reduce FT diesel production cost. Though it can be noticed that feedstock cost will be lower than for first generation biofuels, comparing cost figures is difficult because gasification and gas clean-up technologies needed for FT production are only at an R&D or pilot-demonstration stage of production and application and main data are estimates from natural gas plants. 3.4. Biofuel end-use Most biofuels present great potential in comparison with other transport fuel alternatives due to their ability to be blended with current fuels. Blended forms require almost no modifications, either to engines or in infrastructure. Low percentages of ethanol such as 5 to 10 % are already common as blends with petrol in many countries world104
Table 8. Syngas impurities content and maximum concentration allowable in syngas for catalytic synthesis conversion Contaminant
Concentration (wt %) [Hamelinck, 2004]
Estimated gas specification (ppb)
Particles
1.33
0
HCN & NH3
0.47
20
H2S & COS
0.01
10
Alkalis
0.1
10
HCl
0.1
10
Pb & Cu
Trace
Tars (g)
0.05 to 5
Not known 0
wide. This is also true for biodiesel (esters). They both might be used pure with minor engine adaptations. The FT fuels are so close to conventional diesel that they are fully adequate to any blending percentage or can even be used pure. Table 9 lists biofuel properties, in comparison with those of diesel and petrol. These properties partly determine the engine emission levels. Compared to the fossil fuels they substitute, biofuels generally lower emissions of carbon monoxide, hydrocarbons, sulphur dioxide and particulates. Their impact on NOx is limited. However, due to the lack of experience with biosynfuels (second generation), few data are available so far regarding their potential for reducing engine emissions. GHG emissions can definitely be reduced by biofuels. Nevertheless, estimating the net impacts of using biofuels on GHG emissions is a complex issue and requires a full understanding of the fuel chain on a LCA, from biomassgrowing to final use (well-to-wheels approach). Most studies concern ethanol and biodiesel in the US or EU contexts, but only few analyse the ethanol from sugar route and the developing countries. We shall not present any result here, but we refer the reader to another article on this topic [Larson, 2005]. 3.4.1. First generation biofuels Ethanol can be used in current spark ignition engines. The octane number of ethanol is higher than that of petrol, hence ethanol has better anti-knock characteristics. This quality of the fuel can be exploited only if the compression ratio of engines is adjusted accordingly. The oxygen content of ethanol also leads to higher efficiency, which results in a cleaner combustion process at relatively low temperatures. Compatibility problems between ethanol and some components of the engines such as some types of plastics or metals are well known and have been progressively solved. As the concentration of ethanol increases, adaptation problems may also increase, depending on both the biofuel type and the engine specificities. In Brazil new cars can run indiscriminately on fuel with from 0 to almost 100 % ethanol. It is also possible to blend some ethanol into diesel. However, its low cetane number has limited its use in compression engines. The main research goal in diesel-
Energy for Sustainable Development
z
Volume X No. 2
z
June 2006
Articles
Table 9. Biofuel properties compared to those of conventional fuels Fuel properties
Ethanol
ETBE
RME
Methanol
FT diesel
Diesel
Petrol
Chemical formula
C2H5OH
C4H9OC2H5
-
CH3OH
C15-C20
C12H26
C8H15
Octane number
109
118
-
110
-
-
97
Cetane number
8-11
-
51-58
5
70-80
50
8
Vapour pressure at 15ºC
16.5
28
-
31.7
-
-
75
Density (kg/l) at 15ºC
0.80
0.74
0.88
0.79
0.78
0.84
0.75
LCV (MJ/kg) at 15ºC
26.4
36.0
37.3
19.8
44.0
42.7
41.3
LCV (MJ/l) at 15 ºC
21.2
26.7
32.8
15.6
34.3
35.7
31.0
Stoichiometric air/fuel ratio (kg air/kg fuel)
9.0
-
12.3
6.5
-
14.59
14.7
Boiling point (ºC)
78
72
N.a.
65
72
77
30-190
ethanol technology is to identify additives that would help ethanol to ignite by compression. Progress is reported in this area, particularly in the USA. Regarding engine emissions, the well established improvement is on CO emissions, which can be reduced by 25 % or even more when ethanol is blended at 10 % with petrol [USEPA, 2002a]. Other pollution impacts of ethanol are less clear. Esterified biomass oils are suitable for application in diesel engines as their viscosity, density, and cetane number are similar to those of diesel. Table 9 indicates a higher cetane number for rape methyl ester (RME) compared to regular diesel. This results in a good ignition quality, which means higher engine efficiency and a better prospect for emission reduction. RME density is slightly higher than that of diesel, compensating for the reduced energy content (in MJ/kg) of RME to some extent. Energy content per unit volume for RME and diesel are closer. The lower energy content of RME is due to its much higher oxygen content compared to diesel. Because vehicles using RME have, on an energy basis, the same fuel consumption as those running on diesel, this lower energy content leads to larger volume of fuel consumption. Biodiesel can be easily used in existing diesel engines in its pure form or in any blending ratio (more commonly in 5 to 20 % blend). Like ethanol, the use of biodiesel in pure form requires only minor engine modification to satisfy compatibility with some types of synthetic and natural rubbers. The properties of biodiesel are related to the oil it comes from. Though pure biodiesel can be used in unmodified diesel engines, blending offers the best commercial potential because of better performance and lower costs up to now. RME and soy methyl ester present better freezing point properties than palm oil methyl ester, for instance. Biodiesels have similar properties to diesel. However, they show better lubricity, no aromatic or sulphur contaminants and higher cetane number, which make for lower emissions of most of the pollutants common with petroleum products. The US Environment Protection Agency (EPA) reported that the potential for reduction of emissions of a fuel is almost linear with its biodiesel con-
centration, with the exception of NOx [USEPA, 2002b]. One of its major advantages over fossil diesel is its ability to reduce SOx emissions. Sulphur, which increases the lubricity of diesel can be replaced by a small quantity of biodiesel. 3.4.2. Second generation biofuels Methanol can be applied in almost any vehicle type and can be used as a neat fuel or mixed with other hydrocarbons. As Table 9 showed, methanol has a low cetane number, indicating poor ignition quality, which means that, as for ethanol, its use in compression ignition engines will be difficult. Methanol density is higher than that of petrol. However, the calorific value is 50 % lower than that of petrol. Because it is poisonous, extra precautions are needed, making its use difficult. An existing petrol or diesel tank at a refuelling station can be retrofitted to handle methanol for US$ 20,000 to 32,000. The capital costs of adding methanol storage and dispensers to an existing petrol station would be between US$ 55,000 and 100,000 [CEC, 1999]. Methanol is considered a potential hydrogen carrier for on-board reforming in fuel cell technologies in the long term. FT diesel is a high-quality and clean transportation fuel with favourable characteristics for application in diesel engines. FT diesel is similar to fossil diesel with regard to energy content, density, viscosity and flash point. It presents a higher cetane number. Moreover, it has a very low aromatic content, which leads to cleaner combustion. This means that particles and NOx exhaust emissions are lower. Finally, sulphur emissions are avoided, because FT diesel is sulphur-free due to synthesis requirements. It can be used in current diesel engines and the existing diesel distribution infrastructure without any modifications. DME can be produced directly from syngas in a slurrytype reactor similar to the one used for methanol synthesis. It is estimated that approximately 3 t of wood are required to produce 1 t of DME [Van Thuijl et al., 2002]. DME can also be produced from methanol, but the direct production route should be more efficient as it involves one process instead of two. Before being used as a fuel, DME was used primarily as a propellant in spray cans. This is still its primary application. It is also used as
Energy for Sustainable Development
z
Volume X No. 2
z
June 2006
105
Articles
an ignition improver in methanol engines. Even if the International DME Association expected large, economical supplies of natural gas-derived DME by 2005, it is still at an experimental stage for vehicle use. Being gaseous at ambient temperature, it would require large engine adaptation unless it is considered for blending with LPG for use in LPG engines. Increased use of DME for energy in the near term will be as a substitute for LPG in domestic (household) applications. 4. Concluding remarks Technology plays a central role in energy resource characterisation and in the assessment of potentials as well as of relative interests of competing supply chains. It intervenes at the level of exploitation, transport, conversion processes and final consumption (energy service). Technology can increase energy efficiency, enlarge possibilities in terms of resource valuation, and reduce risks and environmental impacts, if such objectives are sought. Nevertheless, aiming at those objectives with biofuel technology requires a clarification both of the objectives and the contexts in which they are pursued. In most developing countries, energy needs are considerable and linked to economic development, which at some point may be obstructed unles greater access to energy can be guaranteed under controllable conditions. To what extent can biofuel technologies offer the opportunity to reduce vulnerability towards international energy markets while increasing the value of local resources and generating employment? The answer needs to take into account that local biomass resources are specific to a context and might be different from those already used for biofuels. Moreover, the demand for liquid biofuels might also follow different patterns in developing countries than those in industrialised countries. Unless those specificities are taken into account, biofuel technologies might fail to efficiently serve developing countries’ interests. The more capital-intensive biofuel industries would require large investments, the availability of which are largely dependent on domestic priorities. 4.1. Energy for development Large international sponsors, in relation to the UN Millennium Development Goals [AdO, 2004], more and more often mention the locally established energy-poverty link. At the macro-economic level, growth in developing countries goes hand in hand with a strong increase in energy needs, which puts further pressure on energy resources and prices, specifically of fossil fuel. Therefore development is commonly associated with the substitution of firewood and other traditional forms of biomass by fossil energy. However, the vulnerability of developing countries without domestic fossil fuel resources is high. The price levels to be reached and the fluctuations to be expected are difficult to predict, but there is a global consensus that the oil price will remain high, because the growing demand will soon exceed production capacities. At their present stage of development, however, except 106
for very favourable contexts (e.g., in the Centre-South region of Brazil) biofuels do not appear competitive against fossil fuels, especially second generation biofuels that would use resources not directly competing with food supply. Few countries may expect to reach low production costs in the short term. Moreover, it would not be fair at the current levels of North-South disequilibrium regarding wealth and energy consumption to put pressure on developing countries to make costly energy choices for the sake of international energy price stability and of the global environment. The relevance of biofuel energy choices for development is not trivial. Several points require discussion and further investigation. ESMAP (the World Bank’s Energy Sector Management Assistance Program) recently published a report which addresses these issues with a particular focus on Brazil [Kojima and Johnson, 2005]. Lock-in effects in favour of oil technologies hamper biofuel competitiveness. For many decades, they have benefited from learning and scale effects, making the adoption of alternatives costlier than further improvements in oil fuel supply chains. The question for biofuel technologies relates to what scale and learning effects investments in developing countries might generate. To what extent could costs decrease through technological progress but also logistical and organisational improvements within a supply chain? At what oil price levels will biofuels break even? Or, by what time horizon could a biofuel technology learning curve (giving fuel costs as a function of volume produced and time) possibly meet fossil fuel cost curves? The Brazilian case is a reference point for the production of ethanol from sugar cane. However, sugar cane is a water-intensive crop, which means its replication potential is restricted. The 2004 drought, which affected India and Thailand among other countries, has seriously frozen the interest of sugar millers in bioethanol programmes despite government incentives and the setting-up of appropriate policies. Whatever the oil price, some situations in small islands or land-locked countries with inadequate transport infrastructure to access ports or pipelines make investments in biofuel production profitable in the short term, particularly if crops and biofuel production can be located close to consumption centres. In Burkina Faso, cotton oil, already suffering from slight overproduction, might be attractively used as fuel. Its conversion into ester rather than being used as crude oil to fuel stand-alone power generation facilities needs to be questioned and investigated. Table 10 establishes the land areas needed to meet the 10 % criterion for each biofuel in European countries. This shows that land availability might be a real constraint. Land potentially available for biofuel production is mainly to be found in tropical areas [Les Echos, 2004] that are in developing countries. These lands are potentially available because food crops would not need them under most probable agro-demo-economic scenarios and because climatic conditions are often favourable. However, land availability depends on the attractiveness
Energy for Sustainable Development
z
Volume X No. 2
z
June 2006
Articles
Table 10. Land needed to produce feedstocks for biofuels under the 10 % substitution scenario: European data on yields, 1999 total world cropland [IEA/AFIS, 1999] Short term Mha Methanol from cellulose
56
Ethanol from cellulose Ethanol from starch (wheat)
4
Mha
%
8040
6
97
7
147
10
103
7
160
11
37
3
56
4
120
8
170
12
Ethanol from sugar beet Biodiesel
%
Long term
Table 11. Biofuel yields per ha (l/ha and GJ/ha) Generation
Biofuel
l/ha
GJ/ha
First
Sunflower biodiesel
1,000
35
Soybean biodiesel
500-700
17-25
Rapeseed biodiesel
1,200
42
Second
Wheat ethanol
2,500
53
Maize ethanol
3,100
65
Sugar beet ethanol
5,500
116
Sugar cane ethanol
5,300-6,500
110-140
FT biodiesel eucalyptus plantation
13,500-18,000
470-620
Methanol eucalyptus plantation
49,500-66,000
770-1030
DME eucalyptus plantation
45,000-60,000
850–1130
of biofuel plantations vis-à-vis other land uses. To what extent and in what conditions do biofuel plantations sustainably generate value for the local population? Are they the best route to development compared with other uses of land, water and workforce? By (co-)providing local energy services (for irrigation, post-harvest value-adding activities, etc.), biofuel production may stimulate domestic agricultural production and expand markets for agricultural products. However, for reasons of scale economies and proximity to large-scale fuel demand, biomass supply may need to be centralised for fuel conversion in biorefineries located near transport infrastructure. External demand being possibly strong, how would incentives compare for the satisfaction of local energy needs and that of external demand? Where are the complementarities (integration of a variety of feedstocks, simultaneous production of a variety of products, cogeneration of BTL route contributing to improving local access to electricity, etc.)? Under what conditions would complementarities hold under growing external demand at higher prices than local demand can afford? Whatever the availability of resources, biofuel development schemes need to be clarified in terms of value enhanced by different options under consideration, not only monetary value generated instantly but also within the longer term considering basic needs and development strategies.
A frequently cited benefit of biofuel production is job creation, especially in rural areas. Coelho et al. [2004] claim that the Brazilian sugar cane sector is employing around 700,000 people, responsible for around 3.5 million indirect jobs, corresponding to the production of 350 Mt of cane (not solely for the production of biofuels). Depending on the type of feedstock and the technologies used to convert it into fuels, the employment generated by a biofuel supply chain in rural areas would be more or less important. Biosynfuel production associated with fast-growing trees such as eucalyptus offers the best opportunity in terms of employment as it would mix low-, medium- and highly-skilled workers. Similarly to Brazilian plantations for charcoal for the steel industry, a better social impact should be expected as the ratio between skilled and unskilled labour is rather high. However, workforce availability might be an issue. The countries where the highest potentials lie in terms of land are not necessarily endowed with large populations. For instance, the Central African Republic has large uncultivated land and good climate conditions but the density of the population is below 10/km2 in those areas. 4.2. Appropriate biofuel technologies for developing countries The first generation biofuels in developing countries will suffer from the same handicap as in industrialised ones; the production of oilseeds or sugar/starch-rich plants will necessitate large availability of good soils and the use of fertilisers and pesticides, competing with food and feed crops. For this reason, their contribution will remain in most cases limited and costly. However, the technology is mature and could be readily implemented. The best prospects both in terms of land availability [Fallot and Girard, 2005] and yields per hectare (Table 11) are in developing countries, with biofuel technologies differing from those currently used in industrialised countries with agricultural surpluses. Clearly, potential is higher with second generation fuels, presenting a potential contribution larger than conventional biofuels. Therefore, the maturity of the technology is certainly the weak point, as only conventional biofuel technologies are operational on a large scale today. The most promising routes in terms of productivity per hectare, which may at the same time use a wider range of biomass types including lignocellulosic biomass, are not yet proven on large scales and still require intense research. Among all routes discussed earlier, FT diesel is the only one that can be readily used and which benefits from real large-scale applications, from coal up to now. Obtaining a high-quality synthesis gas from biomass for further transformation into biofuels (see above, Section 2.2.5 on pre-treatment) appears to be the crucial step in the biomass-to-liquid route. The development of second generation biofuel technologies would need significant government support, which is already aavailable in Europe and North America. It is important for developing countries that will not develop these technologies on their own to be associated with this development, as this offers the best opportunities
Energy for Sustainable Development
z
Volume X No. 2
z
June 2006
107
Articles
to acquire knowledge about second generation biofuel production. Otherwise, there is indeed a risk that developing countries end up exporting large volumes of raw biomass to be further processed in industrialised country harbour facilities with very limited impact on development. To avoid this, investment patterns require forward-looking investigation. References Agence de l’Environnement et de la Maîtrise de l’Energie-Direction des Ressources Energétiques et Minérales (ADEME-DIREM), 2002. Bilans énergétiques et gaz à effet de serre des biocarburants en France, http://www.ademe.fr/partenaires/agrice/publications/ documents_francais/synthese_bilans_energetiques_fr.pdf, décembre. Agrice, 1998. Les cultures lignocellulosiques et herbacées pour la production de biomasse à usage non alimentaire, Dossier technique Agrice. Appel de Ouagadoudou (AdO), 2004. “Accès à l’énergie et lutte contre la pauvreté et la Charte de l’accès à l’énergie pour le développement d’abord”, www.iepf.org/docs_prog04/pol_energ04/Charte_Appel_Ouagadougou.pdf; “Power to the people, sustainable energy solutions for the world’s poor”, www.itdg.org/?id=energy_for_the_poor; World Bank workshop wbln0018.worldbank.org/esmap/site.nsf/ pages/Dakar Ballerini, D., Les biocarburants 2006 – Etat des lieux, perspectives et enjeux du développement, IFP publications, Edition Technip. Boerrigter, H., Den Uil, H., and Calis, H.P., 2002. “Green diesel from biomass via FischerTropsch synthesis: new insights in gas cleaning and process design”, Pyrolysis and gasification of biomass and waste, Expert meeting, Strasbourg, France.
Kearney, M.O., 1998. The Biodiesel Plant Development Handbook, Independent Business Feasibility Group LLC, November. Kornexl, W., 2001. Environmental Assessment of Plantar Project / Minas Gerais, Prototyp Carbon Fund – Plantar October. Kojima, M., and Johnson, T., 2005. Potential for Biofuels for Transport in Developing Countries, ESMAP report 312/05. Lal, R., 2005. “World crop residues production and implications of its use as a biofuel”, Environment International, Vol. 31, No. 4, pp. 575-584. Larson, E., 2005, “Liquid biofuel systems for the transport sector: a background paper”, STAP/GEF Technical Workshop on liquid biofuels, 29 August-1 September, New Delhi. Laydner, L., 2003. The Search for New Markets, Brasil Equity Update, Brazilian Fuel Alcohol Sector, Ocotber 6. Les Echos, 2004. “La stratégie anti-CO2 de Daimler Chrysler”, 6 octobre. Levelton Engineering Ltd. (Levelton), 2000. Engineering assessment of net emissions of greenhouses gases from ethanol-gasoline blends in southern Ontario, Levelton Engineering Ltd., January. Lima, W.P., 1996. Impacto ambiental do eucalipto, Editora da Universidade de São Paulo, São Paulo, 301 pp. Moreira, J.R., 2003. “Renewable sources of energy in Brazil”, Brazilian biomass reference centre CENBIO IEA Task 39 meeting, Utrecht, the Netherlands, March. NAL, 2005. www.nal.usda.gov/ttic/biofuels/biobib.html Poitrat, E., 2004. “Les huiles végétales non estérifiées comme carburant en agriculture”, Agence de l’Environnement et de la Maîtrise de l’Energie-Direction des Energies Renouvelables, des Réseaux et des Marchés Energétiques, Département Bioressources, working document, November.
Centro Nacional de Referencia em Biomassa (CENBIO), 2004. www.cenbio.org.br
Poitrat, E., 2005. “Les performances énergétiques des filières de production de biocarburants et leur impact sur l’effet de serre”, Powerpoint presentation, Ademe, personal communication.
CenDoTec, 2004. CenDoTec bulletin No. 51, http://www.france-conesud.cl/drc_PDF/drc_bre/be51.pdf
Reith, J.H., Veenkemp, J.M., and Van Ree, R., 2001. “Co-production of bio-ethanol, electricity and heat from biomass wastes – potential and R&D needs”, ECN Report RX-01-011.
Claret, P., 2003. “Silviculture and logging”, Powerpoint presentation, personal communication at Vallourec & Mannesmann Tubes, March 24.
Riedacker, A., and Roy, S., 1998. “Jatropha (physic nut) (Jatropha curcas I.)”, in El Bassam, N. (ed.), Energy Plant Species: Their Use and Impact on Environment and Development, James and James, Science Publishers, London.
California Energy Commission (CEC), 1999. A Guide to Alternative Fuel Vehicles, fifth edition.
Coelho, S., Karekezi, S., and Lata, K., 2004, “Traditional biomass energy, improving its use and moving to modern energy use”, Bonn, Germany, www.renewables2004.de. CYBERLIPID, 2005. www.cyberlipid.org Enguidanos, M., Soria, A., Kavalov, B., and Jensen, P., 2002. Technico-economic Analysis of Bioalcohol Production In The EU: A Short Summary for Decision Makers, European Commission Joint Research Centre Report EUR 20280 EN. ELSBETT, 2005. www.elsbett.com ERFA, 2005. www.ethanolrfa.org, August. European Union (EU), 2002. “Directive 97/68/EC on the approximation of the laws of the Member States relating to measures against the emission of gaseous and particulate pollutants from internal combustion engines to be installed in non-road mobile machinery”, COM/2002/0765 final – COD 2002/0304. Faaij, A.P.C., 2002. “Biotechnology for bioenergy”, presented at Symposium on the Role of Biotechnology in Industrial Sustainability, Organisation for Economic Coorporation and Development (OECD), Antwerp, Belgium, 16-17 May, E-NWS-2002-187. Fallot, A., and Girard, P., 2005. “Spatial analysis for the assessment of biofuels potentials”, presentation paper to the STAP/GEF Technical Workshop on liquid biofuels, 29 August-1 September, New Delhi. Hall, D. , Rosillo-Calle, O., Frank; W., Robert H.; and Woods, J., 1993. “Biomass for energy: supply prospects”, in Johansson, T.B., Kelly, H., Reddy, A.K.N., and Williams, R.H., (eds..), Renewables for Fuels and Electricity, Island Press. Hamelinck, C.N., 2004. Outlook for Advanced Biofuels, Utrecht University ISBN: 90-3933691-1. Hemmerlein, N., Korte, V., and Richter, H., 2002. Performance, Exhaust Emissions and Durability of Modern Diesel Engines Running on Rapeseed Oil, SAE 910848. International Energy Agency (IEA), 2004. World Energy Outlook 2004. Automotive Fuels Information Service of the nternational Energy Agency (IEA/AFIS), 1999. Automotive Fuels for the Future – the Search for Alternatives. International Energy Agency (IEA), 2000. Liquid Fuels from Biomass: North America; Impact of Non-technical Barriers on Implementation, IEA Bioenergy implementing agreement, Task 27 final report. IPEF, 2005. www.ipef.br. JATROPHAWORLD, 2005. www.jatrophaworld.org Kavalov, B., and Peteves, S.D., 2005. Status and Perspectives of Biomass to Liquid Fuels in the European Union, European Commission Joint Research Centre ISPRA, ISBN 92-8949784-X.
108
ROULEMAFLEUR, 2005. www.roulemafleur.free.fr SASOL, 2005. www.sasol.com Sims, R.E.H., 2004. “Biomass, bioenergy and biomaterials: future prospects”, OECD workshop on biomass and agriculture, 10-13 June, Vienna, Austria. OECD code 512004011P1, pp. 37-62. Sun, Y., and Cheng, J., 2002. “Hydrolysis of lignocellulosic materials for ethanol production: a review”, Bioresource Technol. 83, pp. 1-11. Thyson, S.K., Bozell, J., Wallace, R., Petersen, E., and Moens, L., 2004. Biomass Oil Analysis: Research Needs and Recommendations, NREL/TP-510-34796, June. US Environmental Protection Agency, 2001. Bibliography of Bio diesel Studies, Office of Transportation and Air Quality, September, http://www.epa.gov/otaq/models/biodsl.htm. US Environmental Protection Agency (USEPA), 2002a. “Clean alternative fuels: Ethanol fact sheet”, US Environmental Protection Agency. US Environmental Protection Agency (USEPA), 2002b. “A comprehensive analysis of biodisel impacts on exhaust emissions”, EPA 420-P-02-001. US Department of Energy, 1999. The Technology Roadmap for Plant/crop-based Renewable Resources 2020: Research Priorities for Fulfilling a Vision to Enhance US Economic Security through Renewable Plant/crop-based Resource Use (available at http//www.eere.energy.gov/biomass/). Vaitilingom, G., 2005. Personal communication on residues potentials, CIRAD. Vaitilingom, G., Liennard, A., and Courty, P., 2000. “Crude coprah oil, a biofuel for diesel generator. More self-reliance and higher incomes”, Ist World Conference on Biomass for energy and industry, Sevilla, 5-9 June, Vol. II, pp. 1390-1393. Van Gerpen, J., Shanks, B., Pruszko, R., Clements, D., and Knothe, G., 2004. Biodiesel Production Technology August 2002-January 2004, National Renewable Energy Laboratory, US Department of Energy, NREL/SR-510-36244, July. Van Thuijl, E., Roos, C.J., and Beurskens, L.W.M., 2003. An Overview of Biofuel Technologies, Markets and Policies in Europe, ECN-C-008, January. Wang, M., 2001. Development and Use of Greet 1.6 Fuel-Cycle Model for Transportation Fuels and Vehicle Technologies, Argonne National Laboratory, ANL/ESD/TM-163. Wichert, M.C.P., 2005. Validation of the Global Data and Indication of Technical and Economic References about the Brazilian Forestry Sector, survey carried out for Cirad, 117 pp. Wooley, R., Ruth, M., Power, A., Walter, P.J., Grohmam, K., and Hinman, N.D., 1999. “A technical and economic analysis of acid-catalysed steam explosion and dilute sulphuric acid pre-treatment using wheat straw and aspen wood chips”, Appl. Biotechnol., 28/29, pp. 87-97.
Energy for Sustainable Development
z
Volume X No. 2
z
June 2006