J. Higgins, Edmund Leary, Paul J. Low, Santiago MartÃn, Richard J. Nichols, ..... Diffusion coefficients were calculated using the Randles-Sevcik equation:.
SUPPORTING INFORMATION Electrochemical single-molecule transistors with optimized gate coupling Henrry M. Osorio, Samantha Catarelli, Pilar Cea, Josef B. G. Gluyas, František Hartl, Simon J. Higgins, Edmund Leary, Paul J. Low, Santiago Martín, Richard J. Nichols, Joanne Tory, Jens Ulstrup, Andrea Vezzoli, David C. Milan and Qiang Zeng.
1.0 General Synthetic Methods for Synthesis of 2 in Main Paper All reactions were carried out under an atmosphere of dry nitrogen using standard Schlenk techniques. Dichloromethane was purified and dried using an Innovative Technology SPS400 before use, triethylamine was distilled over calcium sulfate, other solvents were standard reagent grade and used as received. No special precautions were taken to exclude air or moisture during workup except where otherwise indicated. The catalyst PdCl2(PPh3)2 was synthesized by literature methods.1 All other reagents were commercially available and used as received. NMR spectra were recorded at 23 ºC on a Varian NMR Systems 700 (1H, 699.7 MHz; 11B, 224.5 MHz; 13C, 175.9 MHz; 29Si, 139.0 MHz) or a Varian NMR Systems 600 spectrometer (19F, 564.3 MHz) using CDCl3 or CD3CN/D2O (2:1 (v/v)) as the solvent. Chemical shifts were determined relative to internal CHCl3 (1H δ = 7.26 ppm, CDCl3), internal CDCl3 (13C δ = 77.16 ppm, CDCl3), internal CHD2CN (1H δ = 1.94 ppm, CD3CN/D2O (2:1 (v/v))), internal CD3CN (13C δ = 1.32 ppm, CD3CN/D2O (2:1 (v/v)))2 external BF3·Et2O (11B δ = 0.0), external CF3C6H5 (19F δ = –63.72 ppm) and external tetramethylsilane (29Si δ = 0.0 ppm). Assignment of the 1H and 13C NMR data was supported by gradient selected 13
C,1H HMQC and HMBC experiments. EI-MS spectra were recorded on a Thermo-Finnigan
Corporation Trace GC-MS and ESI-MS were recorded on a Waters Ltd TQD mass spectrometer in positive mode. Elemental analyses were performed at the London Metropolitan University.
2.0 Viologen (12+) Synthesis In brief reaction of 1,6–dibromohexane with KSAc gave S-(6-bromohexyl)ethanethioate (5) which, on reaction with 4,4’-bipyridine (6), gave the viologen as its bromide salt; metathesis with NH4[PF6] in water then afforded 3[PF6]2.These represent minor modifications of literature routes described in references 3,4
S1
Scheme 1. Synthesis of the precursor to 1; yields are given in parentheses. N,N’-Di-(6-(thioacetyl)hexyl)-4,4’-bipyridinium bis(hexafluorophosphate) (3•[PF6]2) A solution of 3•[Br]2 (0.228 g, 0.36 mmol) in water (20 mL) was treated with an excess of ammonium hexafluorophosphate (0.585 g, 3.6 mmol, 10 eq.). A white precipitate immediately appeared. The resulting suspension was filtered, the residue washed with water (3 x 10 mL) and dried overnight in vacuo to afford 3•[PF6]2 as white powder in 96% yield. (0.236 g, 0.31 mmol). 1H NMR (400 MHz, Acetone-d6): 9.46 (d, J = 8.8 Hz, 4H, V), 8.85 (d, J = 5.8 Hz, 4H, V), 4.97 (t, J = 7.6 Hz, 4H, CH2), 2.84 (t, J = 7.4 Hz, 4H, CH2), 2.29 (s, 6H, CH3), 2.21 (m, 4H, CH2), 1.61 – 1.42 (m, 12H, CH2) ppm. 13C NMR (100 MHz, Methanol-d4): 195.0, 150.4, 145.9, 127.2, 62.4, 31.1, 29.4, 29.2, 29.0, 27.8, 25.3 ppm. m/z (HRMS, ES+, CH3OH, 60 V) 787.1547 [M + Na]+, C26H38F12N2NaO2P2S2 calc. 787.1556. HRMS spectra showed peaks of comparable intensity at 619.20 [M - PF6]+ and 473.19 [M - 2PF6]2+. N,N’-Di-(6-(thioacetyl)hexyl)-4,4’-bipyridinium dibromide (3•[Br]2). A solution of 5 (1.53 g, 6.4 mmol) and 4,4’-bipyridine (0.25 g, 1.6 mmol) in acetonitrile (15 mL) was heated to reflux for 36h, whereupon it became orange with the presence of abundant yellow precipitate. The mixture was then allowed to cool to room temperature, sonicated, filtered and the precipitate was washed with cold EtOH (20 mL) and diethyl ether (20 mL). The crude product was purified by recrystallization from boiling EtOH, and dried overnight in vacuo to afford 3•[Br]2 in 72% yield as yellow powder (0.73 g, 1.2 mmol). 1H NMR (400 MHz, Methanol-d4): 9.29 (d, J = 8.8 Hz, 4H, V), 8.69 (d, J = 5.8 Hz, 4H, V), 4.76 (t, J = 7.4, 4H, CH2), 2.87 (t, J = 7.2 Hz, 4H, CH2), 2.29 (s, 6H, CH3), 2.11 (m, 4H, CH2), 1.61 (m, 4H, CH2), 1.47 (m, 8H, CH2) ppm. 13C NMR (100 MHz, Methanol-d4): 196.4, 149.9,
S2
145.4, 126.9, 61.9, 30.9, 29.1, 29.0, 28.1, 27.6, 25.2 ppm. m/z (HRMS, ES+, CH3OH, 60 V) 474.2372 [M - 2Br]2+, C26H38N2O2S2 calc. 474.2375. S-(6-bromohexyl) ethanethioate (5) This preparation was adapted from the procedure developed by Shi et al.5 A suspension of finely ground potassium thioacetate (2.50 g, 21.9 mmol) in THF (20 mL) was added dropwise to a solution of 1,6-dibromohexane (10.68 g, 43.8 mmol) in THF (50 mL) and stirred for 24 h at room temperature. The solvent was then removed in vacuo, the residue suspended in CH2Cl2, filtered and washed with water (3 x 25 mL). The organic phase was dried over MgSO4 and filtered. After removing the solvent in vacuo, the crude product was purified by flash column chromatography on SiO2 (40 % CH2Cl2 in hexanes) to afford 5 in 82% yield as a light yellow oil (4.29 g, 17.9 mmol). 1H NMR (400 MHz, CDCl3): = 3.41 (t, J = 6.7 Hz, 2H, CH2), 2.87 (t, J = 7.2 Hz, 2H, CH2), 2.32 (s, 3H, CH3), 1.92-1.78 (m, 2H, CH2), 1.60 (m, 2H, CH2) 1.54-1.30 (m, 4H, CH2) ppm.
3.0
Electrochemistry of 2(BF4)2 in Acetonitrile Electrolytes
Cyclic voltammetry was carried out in using a Princeton Technologies VersaStat-3 potentiostat, with a platinum microdisc working electrode, a platinum wire counter electrode, and a platinum wire pseudo-reference electrode, from solutions in acetonitrile containing 0.1 M n-Bu4NPF6 as the electrolyte, ν = 100 mV s–1. Measurements with ν = 100, 200, 400 and 800 mVs–1 showed that the ratio of the anodic to cathodic peak currents varied linearly as a function of the square root of scan rate in all cases. The ferrocene/ferrocenium couple was used as an internal reference. Data manipulation was carried out using SOAS and MATLAB software packages.6,7
S3
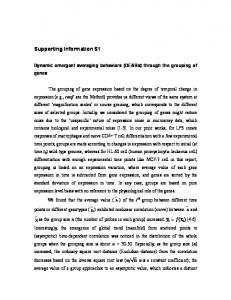
Figure S1. Cyclic voltammogram of 2(BF4)2 in acetonitrile / 0.1 M NBu4PF6 containing Fc/Fc+ at 0.0 V. Wave 1: E1/2 = 1140 mV, ΔEp = 70 mV; Wave 2: E1/2 = 741 mV, ΔEp = 73 mV. This shows good reversible electrochemistry for the reduction to the cation radical and then at more negative potentials to the neutral compound. The electrochemistry in ionic liquids (see below) essentially shows a similar pattern with some broadening in the peak separation and also some added complexity in the second cathodic wave.
4.0
Electrochemistry of 2(BF4)2in Ionic Liquids A 7.5 mM solution of 2(BF)24 in BMIM-OTf was prepared by dissolving the viologen in
methanol, and then adding the ionic liquid. The methanol was evaporated off at ~100°C for 1.5 hours with nitrogen bubbling directly in to the solution. The working electrode was a Au(111) bead, with a hanging meniscus, while the counter and reference electrodes were 0.5 mm Pt wire. All potentials were determined against an internal Fc/Fc+ reference added after the experiment. The CVs in ionic liquid of 2(BF4)2 were run at 0.1 V s-1 intervals between 0.1 and 1.0, as well as at 0.05 and 0.075 V s-1 and are shown in Figures S2.
S4
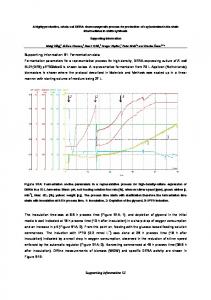
Figure S2: CV of 2(BF4)2 in BMIM-OTf showing the first reduction to the radical cation and the second reduction to the neutral compound. On going from the red to the black curve the sweep rate follows the order 1.0, 0.9, 0.8, 0.7, 0.6, 0.5, 0.4, 0.3, 0.2, 0.1, 0.075, and 0.05 V s-1.
The two expected peaks occur at -0.77 and -1.16 V vs Fc/Fc+, while the extra peak occurs at -1.29 V vs Fc/Fc+. The latter may, for example, arise from adsorption of the second reduction product (the neutral compound).
5.0
The Two Step Model Equations
To model the data we take the expression for the two-step hopping model of Kuznetsov and Ulstrup as given in reference 8: 𝑗𝑒𝑛ℎ ≈ 𝑗0 exp(−𝜆⁄4𝑘𝑇)
exp( 𝑐𝑜𝑠ℎ(
𝑒|𝑉𝑏𝑖𝑎𝑠 |⁄ 4𝑘𝑇)
Equation (1)
𝑒(0.5−𝛾)𝑉𝑏𝑖𝑎𝑠 −𝑒𝜉𝜂 ) 2𝑘𝑇
Together with: 𝑗0 = 𝑒𝑛𝜔𝑒𝑓𝑓 /2𝜋
Equation (2)
and 1 𝐿 𝜌𝐿
𝑛 ≈ 𝑒𝑉𝑏𝑖𝑎𝑠 (2𝜅
−1 1 ) 𝑅 𝜌𝑅
+𝜅
Equation (3)
S5
Assuming, κ=1 and ρL = ρR which is taken as the density of electronic states of gold near the Fermi level, we get: 2 𝑛 ≈ 𝑒𝑉𝑏𝑖𝑎𝑠 𝜌 3 𝑗0 =
And
𝑒 2 𝜌𝜔𝑒𝑓𝑓 3𝜋
𝑉𝑏𝑖𝑎𝑠
Taking e2ρωeff ≈ 1.14x10⁻⁵ C2/(eV.s) from reference 8 we get:
𝑗𝑒𝑛ℎ ≈ 1.21 × 10⁻⁶ 𝑉𝑏𝑖𝑎𝑠 exp(−𝜆⁄4𝑘𝑇)
exp( 𝑐𝑜𝑠ℎ(
𝑒|𝑉𝑏𝑖𝑎𝑠 |⁄ 4𝑘𝑇)
𝑒(0.5−𝛾)𝑉𝑏𝑖𝑎𝑠 −𝑒𝜉𝜂 ) 2𝑘𝑇
Equation (4)
Or in nA: 𝑗𝑒𝑛ℎ ≈ 1210. 𝑉𝑏𝑖𝑎𝑠 exp(−𝜆⁄4𝑘𝑇)
6.0
exp( 𝑐𝑜𝑠ℎ(
𝑒|𝑉𝑏𝑖𝑎𝑠 |⁄ 4𝑘𝑇)
𝑒(0.5−𝛾)𝑉𝑏𝑖𝑎𝑠 −𝑒𝜉𝜂 ) 2𝑘𝑇
Equation (5)
22+ Conductance Data
S6
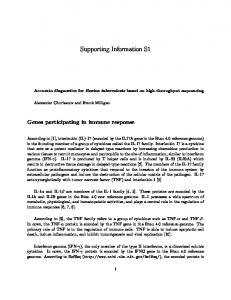
Figure S3: Conductance histograms recorded for 22+ molecular bridges in BMIM-OTf electrolyte as a function of the marked electrochemical potential (versus Fc/Fc+ at 0.0 V).
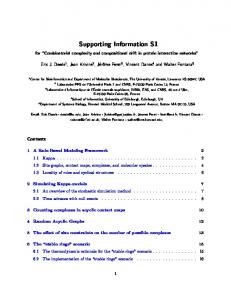
Figure S4: Single molecule conductance data (blue circles) and fitting with equation 1 in main text (solid blue lines), for 22+ in BMIM-OTf. The fitting parameters obtained from these data are ξ = 1, λ = 1.3 eV and γ = 0.52. 7.0
Break-off Distance Data
We have recorded junction breaking distance for the I(s) method as described in the literature and data for 12+ in BMIM-OTf is shown in Figure S5.
Figure S5: Junction breaking distance data for 12+ in BMIM-OTf, recorded using the I(s) method. 8.0
Diffusion Coefficients and Heterogeneous Rate Constants S7
Diffusion coefficients were calculated using the Randles-Sevcik equation: 1⁄ 2
𝑛𝐹 𝐼𝑝 = 0.4463𝑛𝐹 ( ) 𝑅𝑇
𝐴𝐷
1⁄ 1 2 𝐶𝜈 ⁄2
Where, Ip is the peak current (A), A is the area of the electrode (cm2), D is the diffusion coefficient (cm2 s-1), C is the concentration of the analyte (mol cm-3) and ν is the scan rate (V s-1). Heterogeneous rate constants were calculated by application of the Nicolson method, 9 and following the procedure detailed in ref.10 (Section 3.4). The dimensionless charge transfer parameter (Ψ) found in the Nicolson method, which is related to Ep, was calculated using the empirical equation quoted in ref.10: Δ𝐸𝑝 = 𝐴 +
𝐵 𝐶 𝐷 + 1 + 1 ⁄ 𝜓 𝜓 2 𝜓 ⁄3
Where A, B, C and D have the respective values of 81.34 mV, -3.06 mV, 149 mV and -145.5 mV, at 298 K. 9.0 UV-Vis and IR Spectroelectrochemistry 9.1 UV-Vis and IR Spectroelectrochemistry of 2•[2BF4] in Ionic Liquids A vacuum tight Hamilton syringe was used to fill the air-tight OTTLE cell. The Hamilton syringe was flushed with hot dry BMIM-OTf (to remove possible traces of moisture) and the air-tight OTTLE cell was initially filled with the ionic liquid for background correction. The cell was then filled with the warm solution of 2•[2BF4] in BMIM-OTf, using the same dry Hamilton syringe. The viscosity of the BMIM-OTf presents no problem for filling the thin (ca 0.2 mm) space in the composed OTTLE cell, including the areas of the Pt minigrid working and auxiliary electrodes. The thin-layer cyclic voltammogram was recorded at v = 2 mV s-1. A silver wire pseudoreference electrode is used in the OTTLE cell and no internal potential standard was added. The thin-layer cyclic voltammogram shows two reversible cathodic waves; however, the corresponding reverse oxidation waves were only partially observed at the expected potentials and complete re-oxidation required potentials to be considerably positively shifted. The reduction and subsequent re-oxidation steps were significantly slower in BMIM-OTf than in DMF/Bu4NPF6 or MeCN/Bu4NPF6 electrolytes and the potential had to be held for several minutes to allow the Faradaic current to drop to zero, resulting in the jagged appearance of the thin-layer cyclic voltammograms. S8
Figure S6: Thin-layer cyclic voltammogram monitoring the stepwise IR and UV-Vis spectroelectrochemistry of 10 mM 2•[2BF4] in dry BMIM-OTf in an OTTLE cell at T = 293 K. (solid line = initial reduction to radical cation (R1) and scan reversal (partial reoxidation at O1a with complete reoxidation seen at O1b); dashed line = continued reduction of radical cation to neutral molecule (R2) and scan reversal (partial reoxidation of neutral species to radical cation at O2a with complete reoxidation seen at O2b, partial reoxidation of radical cation to dication at O1a with complete reoxidation seen at O1b)). The one-electron reduction of 2•[2BF4] resulted in its complete conversion to the corresponding radical cation. Subsequent reduction of the radical cation to the neutral compound could not be taken to completion as the ionic liquid electrolyte also began to undergo reduction at these potentials. UV-Vis spectroelectrochemistry of the one-electron reduction of the radical cation shows the appearance of an intense absorption band at 388 nm while IR monitoring shows the ν(CC) band at 1634 cm–1 decrease in intensity accompanied by the growth of a band at 1660 cm–1. These observations are characteristic for the neutral form of the viologen11,12 and indicate that the ionic liquid electrolyte does not significantly affect the viologen vibrational behavior. Reoxidation of the neutral viologen led to regeneration of the radical cation then the dication, showing that the system has good reversibility in the ionic liquid.
S9
Figure S7: Reversible UV-Vis spectral changes of 2 mM 2•[2BF4] in dry BMIM-OTf accompanying the reduction of its stable radical cation to the neutral molecule within an optically transparent thin layer electrochemical (OTTLE) cell at T = 293 K.
S10
Figure S8: Reversible IR spectral changes accompanying the reduction of 10 mM 2•[2BF4] in dry BMIM-OTf from its stable radical cation to the neutral molecule within an optically transparent thin layer electrochemical (OTTLE) cell at T = 293 K. 9.2
UV-Vis and IR Spectroelectrochemistry of 2•[2BF4] in DMF and Acetonitrile
Acetonitrile was distilled from P2O5 under N2. DMF was purchased dry and bubbled with argon before use. Bu4NPF6 electrolyte was recrystallized twice from hot ethanol. Solutions contained 0.3 M Bu4NPF6 and 2 mM (UV-Vis spectroelectrochemistry) or 4 mM (IR spectroelectrochemistry) 2•[2BF4]. Thin-layer cyclic voltammograms were recorded at v = 2 mV s-1 and show two reversible cathodic waves. Unlike in BMIM-OTf, there was no significant positive shift of the anodic counter waves.
Figure S9: Thin-layer cyclic voltammogram monitoring the stepwise IR and UV-Vis spectroelectrochemistry of 2 mM 2•[2BF4] in dry DMF/Bu4NPF6 in an OTTLE cell at T = 293 K (solid line = initial reduction to radical cation and scan reversal; dashed line = continued reduction of radical cation to neutral molecule and scan reversal). UV-Vis spectroelectrochemistry of the initial one-electron reduction of 2•[2BF4] to its radical cation in MeCN results in the appearance of intense absorption bands around 400 nm and 610 nm. IR monitoring shows formation of an intense ν(C=C) band at 1635 cm–1 and an increase in absorbance from the ν(C≡C) band at 2160 cm–1. The radical cation could be reversibly reduced to the neutral form of the viologen with an intense band observed at 388
S11
nm in the UV-Vis spectrum, and IR spectroelectrochemistry showing the formation of a band at 1660 cm–1. UV-Vis and IR spectroelectrochemistry of 2•[2BF4] recorded in MeCN/Bu4NPF6 was very similar to that obtained in BMIM-OTf. This supports the conclusion that the electronic structure of the reduced species do not differ significantly with the use of an ionic liquid electrolyte.
Figure S10: Reversible UV-Vis spectral changes accompanying the reduction of 2 mM 2•[2BF4] in dry MeCN/Bu4NPF6 to its stable radical cation within an OTTLE cell at T = 293 K.
S12
Figure S11: Reversible UV-Vis spectral changes of 2 mM 2•[2BF4] in dry MeCN/Bu4NPF6 accompanying the reduction of its stable radical cation to the neutral molecule within an OTTLE cell at T = 293 K.
Figure S12: Reversible IR spectral changes accompanying the reduction of 4 mM 2•[2BF4] in dry MeCN/Bu4NPF6 to its stable radical cation within an OTTLE cell at T = 293 K. S13
Figure S13: Reversible IR spectral changes of 4 mM 2•[2BF4] in dry MeCN/Bu4NPF6 accompanying the reduction of its stable radical cation to the neutral molecule within an OTTLE cell at T = 293 K.
9.3
UV-Vis and IR Spectroelectrochemistry of 11•[2Cl] and 12•[2Cl] in Ionic Liquids
Spectroelectrochemistry of methyl-viologen dichloride (11•[2Cl]) and benzyl-viologen dichloride (12•[2Cl]) (Sigma Aldrich) was recorded in BMIM-OTf using the same procedure as for 2•[2BF4]. The thin-layer cyclic voltammograms are not shown, but were similar to those recorded for 2•[2BF4] with slow electrochemical steps and partially positively shifted reoxidation waves. The UV-Vis and IR spectra of the dications 22+, 112+ and 122+ and the corresponding radical cations (2+, 11+ and 12+) and neutral species (2, 11 and 12) are also comparable.
S14
Figure S14: Reversible UV-Vis spectral changes accompanying the reduction of 2 mM 12•[2Cl] in BMIM-OTf to its stable radical cation (12+) within an OTTLE cell at T = 293 K.
Figure S15: Reversible UV-Vis spectral changes of 2 mM 12•[2Cl] in BMIM-OTf accompanying the reduction of its stable radical cation (12+) to the neutral molecule (12) within an OTTLE cell at T = 293 K. S15
Figure S16: Reversible IR spectral changes accompanying the reduction of 10 mM 12•[2Cl] in BMIM-OTf to its stable radical cation (12+) within an OTTLE cell at T = 293 K.
Figure S17: Reversible UV-Vis spectral changes accompanying the reduction of 2 mM 11•[2Cl] in BMIM-OTf to its stable radical cation (11+) within an OTTLE cell at T = 293 K. S16
Figure S18: Reversible UV-Vis spectral changes of 2 mM 11•[2Cl] in BMIM-OTf accompanying the reduction of its stable radical cation (11+) to the neutral molecule (11) within an OTTLE cell at T = 293 K.
Figure S19: Reversible IR spectral changes accompanying the reduction of 10 mM 11•[2Cl] in BMIM-OTf to its stable radical cation (11+) within an OTTLE cell at T = 293 K. S17
Figure S20: Reversible UV-Vis spectral changes of 10 mM 11•[2Cl] in BMIM-OTf accompanying the reduction of its stable radical cation (11+) to the neutral molecule (11) within an OTTLE cell at T = 293 K.
9.4
UV-Vis and IR Spectroelectrochemistry of 11•[2Cl] in D2O
D2O was bubbled with argon before use. Solutions contained 0.3 M Bu4Br and 2 mM (UV-Vis spectroelectrochemistry) or 10 mM (IR spectroelectrochemistry) 11•[2Cl]. The reduction of 11•[2Cl] to its corresponding radical cation could be followed in D2O with UV-Vis and IR spectroelectrochemistry. The spectra of the reduced species show some differences from those recorded in ionic liquid which can be explained by the expected dimerization of the radical cation in aqueous solutions.13,14
S18
Figure S21: Reversible IR spectral changes accompanying the reduction of 10 mM 11•[2Cl] in D2O/Bu4NBr to a radical cation (11+) and its subsequent dimerization within an OTTLE cell at T = 293 K. 10.0
Error Analysis for 12+ and 22+ Conductance Data
Figure S21 and S22 show molecular conductance data for 12+ and 22+, respectively, in BMIM-OTf with errors. These errors are used to estimate fitting errors in the parameters ξ , λ and γ as quoted in the main manuscript. Errors for the conductance data for 12+ in aqueous electrolyte are taken from reference 15 and used to compute fitting errors for this aqueous data.
S19
Figure S21: The single-molecule conductance of 12+ versus electrochemical potential.
Figure S22: The single-molecule conductance of 22+ versus electrochemical potential. 11.0
Bias Voltage Data
Figure S22 shows conductance versus bias voltage for 12+ recorded under ambient conditions. The G vs V plot is relatively flat in the region between -1 and 1 V.
Figure S22: Conductance versus bias voltage for 12+ recorded under ambient conditions. The plot has been obtained using 1000 IV curves, with an automated data selection that filtered out data that did not fit to a polynomial curve.
S20
References (1) Miyaura, N.; Suzuki, A. Organic Syntheses 1990, 68, 130. (2) Fulmer, G. R.; Miller, A. J. M.; Sherden, N. H.; Gottlieb, H. E.; Nudelman, A.; Stoltz, B. M.; Bercaw, J. E.; Goldberg, K. I. Organometallics 2010, 29, 2176. (3) Gittins, D. I.; Bethell, D.; Nichols, R. J.; Schiffrin, D. J. Adv. Mater. 1999, 11, 737. (4) Haiss, W.; Nichols, R. J.; Higgins, S. J.; Bethell, D.; Hobenreich, H.; Schiffrin, D. J. Faraday Discuss. 2004, 125, 179. (5) Shi, L.; Jing, C.; Ma, W.; Li, D.-W.; Halls, J. E.; Marken, F.; Long, Y.-T. Angew. Chem. Int. Ed. 2013, 52, 6011. (6) Fourmond, V.; Hoke, K.; Heering, H. A.; Baffert, C.; Leroux, F.; Bertrand, P.; Leger, C. Bioelectrochemistry 2009, 76, 141. (7) MATLAB version 8.0.0, T. M. I., Natick, Massachusetts (USA), 2012. (8) Zhang, J. D.; Kuznetsov, A. M.; Medvedev, I. G.; Chi, Q. J.; Albrecht, T.; Jensen, P. S.; Ulstrup, J. Chem. Rev. 2008, 108, 2737. (9) Nicholson, R. Anal. Chem. 1965, 37, 1351. (10) Siraj, N.; Grampp, G.; Landgraf, S.; Punyain, K. Zeitschrift Fur Physikalische ChemieInternational Journal of Research in Physical Chemistry & Chemical Physics 2013, 227, 105. (11) Porter, W. W.; Vaid, T. P. J. Org. Chem. 2005, 70, 5028. (12) Bockman, T. M.; Kochi, J. K. J. Org. Chem. 1990, 55, 4127. (13) Brienne, S. H. R.; Cooney, R. P.; Bowmaker, G. A. Journal of the Chemical Society-Faraday Transactions 1991, 87, 1355. (14) Kim, H. J.; Jeon, W. S.; Ko, Y. H.; Kim, K. Proc. Nat. Acad. Sci. U.S.A. 2002, 99, 5007. (15) Haiss, W.; van Zalinge, H.; Higgins, S. J.; Bethell, D.; Hobenreich, H.; Schiffrin, D. J.; Nichols, R. J. J. Am. Chem. Soc. 2003, 125, 15294.
S21