MICHIGAN BASIN. *ArthurB. Loseyand Kathleen CounterBenison. Department of Geology, Central Michigan University, Mt. Pleasant, MI48858;. *Current ...
SILURIAN PALEOCLIMATE DATA FROM FLUID INCLUSIONS IN THE SALINA GROUP HALITE, MICHIGAN BASIN
*Arthur B. Loseyand Kathleen CounterBenison Department of Geology, Central Michigan University, Mt. Pleasant, MI48858; * Current address: Department of Geology, 114 Shideler Hall, Miami University, Oxford, OH45056 ABSTRACT: The SilurianSalinaGroupof the MichiganBasinconsistsof halite,carbonates, and shales. The halite was probablydeposited whenseawaterbecamerestrictedover whatis now southernMichigan. The halite consistsof: (1) bedscontainingonly chevrons,and (2) beds composedof chevron and cumulatecrystals. This indicatesshallowdepositional waters. The primaryfluid inclusionsalong growth bands in these crystals are well preserved andunaltered. These cubic, all-liquid inclusions,rangingin size from >1 to 150 IJIll, represent Silurian surface waters. These all-liquid inclusions were cooled in order to nucleate a vapor bubble. After cooling, inclusions were warmed slowly and the homogenization of the vapor bubbles to liquid was observed. The homogenization temperatures ranged from 19.8°C to 59.0°C, with the majority of the measurements falling below 40.0°C. Validity of this temperature data is strongly suggested by: (1) reproducibility of homogenization temperatureswithin 1°C; and (2) similar homogenization temperatures withinindividualgrowth bands ranging between 4 - lOOC. Therefore, these homogenization temperatures represent Silurianshallow water temperatures. In modernshallowevaporativesettings, the watertemperatures andthe airtemperatures areverysimilar. Sincepetrographyof the halite beds indicates shallow water deposition, these homogenizationtemperatures may be good proxies for Silurian air temperatures.
This may be among the first quantitative Silurian climate data. Paleoclimate data such as these may give new insightsinto modem climate and future climate trends.
INTRODUCTION
In order to understand the climate we experience today we must understand the climate of our past We do not have a complete record of past climates to provide a historical perspective for modem and future climatic problems suchas global warming. There have been numerous paleoclimate studies on ancientrocks,but mosthavebeenqualitative. For example, thepresenceof coalin therockrecordindicates that theclimatewaswet duringdeposition and evaporites indicate theclimate wasvery dry. Mostquantitative paleoclimate data have been obtained from' geologically young material. Isotopic analysis of ice cores taken from glaciers give temperatures datingbackas far as 300,000 years(Lorius et al, 1990; Bamolaet al. 1987). However, this is relatively recent paleoclimate data when compared to the Earth's age of 4.6 billion years. Few studies of older rocks have produced quantitative temperature data through other methods, including the study of fluid inclusions in evaporite minerals (Benison 1995; Benison and Goldstein 1999). Sinceevaporite minerals are dependent on evaporation, they areextremely sensitive to climate andareverygoodindicators ofpaleoclimate (Lowenstein andHardie 1985). Traditionally, evaporite deposits havebeenusedasindicators of dry climate, but moredetailedstudiescan yieldquantitative climate data such as ancient water and air temperatures. As evaporite minerals form from saline waters, they trap tiny bits of that water in their internal structure. These fluid inclusions are important because theycan be preserved remnants of ancient depositional brines and they record ancient water temperatures from which the halitegrew. Carbonates and Evaporites, v. 15, no. 1, 2000, p. 28-36.
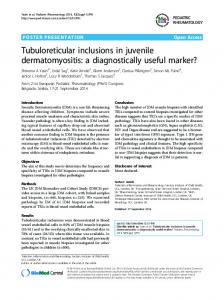
A new methodfor determining paleotemperatures from fluid inclusions in halite hasbeenproventobe effective for modem environments. This method measures the homogenization temperatures of artificially-nucleated vapor bubbles in previously all-liquid inclusions. The temperatures of modem surface waters in Death Valley and fluid inclusion homogenization temperatures within the halite grown from thesewatersweremeasured (Roberts and Spencer 1995). The surface water temperatures and the homogenization temperatures fell within the same range, indicating that fluid
surface waters in April and May
~
-I?%ZT@
2U
25
30
35
40
45
50
HOMOGENIZATION TEMPERATURE, 0 C
Figure 1. Comparison of seasonal surface water temperatures at Death Valley and homogenization temperatures measured in fluidinclusionsfromDeath Valley halite. This plotindicates that homogenization temperatures of primary, initially all-liquid inclusions in halite may accurately represent temperatures of surface formation waters. Modified after Roberts andSpencer 1995.
LOSEY AND BENISON inclusions can yield accurate reflections of parent water temperature (Fig. 1). Surface water temperatures are quite similar to local air temperatures in modern evaporative settings (Roberts and Spencer1995; Eubankand Brough 1980). For example, the average dailyair and water temperatures over the courseof a year weremeasured from Great SaltLake. It was foundthat the two data sets were very similar and often the same. However, when the surface water temperature and air temperature differed, it wasonlyby amaximum of4·5°C (Fig. 2a). Also, surface waterand air temperatures are evensimilar on an hourly basis (Fig. 2b; Brown1995; Zimmermann pers. comm.). We can assume that this may also holds true for ancient settings. Accordingly, temperatures of ancient surface waters determined by fluid inclusion studies can be considered goodproxiesfor ancient air temperatures. Hence, some fluid inclusions can be used to determine both ancient water and air temperatures. A studyof Permian-aged halitefrom thesubsurface of Kansas wasconducted to determine paleotemperatures of thePermian (Benison 1995; Benison and Goldstein 1999). It was found that the temperatures at whichtheseinclusions were trapped werein therangeof21 °C to 50°C(Benison 1995). Sinceit is known that, in modern environments, the shallow surface waterandsurface airtemperatures are veryclose,thePermian water temperatures probably represent localized Permian air temperatures from the mid-continental area of the U.S. Thepurposeof thisstudywas to determine thetemperature of the depositional waters of the Silurian Salina Group of the Michigan Basin. Our petrographic observations showedthat at least some of the Salina halitewas deposited in a shallow
50 40
50
w
30
30
,...
20
20
~
w
10
10
sw
0
0
-10
-10
- 20
- 20
~ ~
:;:l
-e
The SalinaGroupwasdeposited in Michigan duringthe Late Silurian and contains the oldest evaporite deposits found in the rock record of Michigan (Dellwig 1955). The Salina Group halitewas mostlikelydeposited by seawater that was restricted from the open ocean by pinnaclereefs in a lagoon setting at approximately 26°S latitude (Liebold 1992). The basinbecamehydrogeologically isolatedfrom the surrounding sea by eitherupliftof the marginal carbonate bank or the fall of sea level. The sub-tropical climate and high evaporation rate began the evaporative downdraw and evaporite deposition (Liebold 1992). Also,in no case did the brine water exceed a depth of tens of meters, suggesting shallow water deposition for the Salina Group (Sonnenfeld and AI-Aasm 1991). Dellwig (1955) was the first to extensively study the Salina halite and found that it is rich in primary fluid inclusions. Dellwig also performed homogenization runs and he found temperatures ranging from 32.l°C to over 100°C. However, he warned that some inclusions may have been altered. In comparison to samples used in our study, Dellwig'ssamples weretakenfrom greater depths and closer to the centerof the
40
40
J F M A M J
J A S 0
Great Inagua ~ Aug. 14, 1995
40
~ Jan. 19, 1995
G ~
w ~
~ < ~ w c,
c,
,...
GEOLOGICAL BACKGROUND
b)
a)
G
water setting, probably less than one meter in depth (Lowenstein and Hardie 1985). We also determined that the Salina Group halite is rich in primary, all-liquid fluid inclusions, whichare necessary for this typeof climatestudy. Temperature data was obtained through the homogenization temperatures of the primary all-liquid fluid inclusions in the SalinaGrouphalite. Thetemperature data represents Silurian surface watertemperatures andis a goodproxyfor Silurian air temperatures.
:2
30
30
20
20
,... tIl
10
10
8am
N D
10
12
2
4pm
6
HOURS OF THE DAY
MONTHS
Figure 2. Comparison between shallow surface water temperatures andairtemperatures inmodern evaporative environments. (a) Average airandwater temperatures (on a seasonal scale) atDeath Valley, California (Roberts andSpencer 1995) arequite similar, asarethose at Great Salt Lake, Utah (Eubank andBrough 1980). (b) Specific airandwater temperatures (on a daily scale) atDeath Valley, California (Brown 1995) and at Great Inagua, Bahamas (H. Zimmermann, pers. comm.) also exhibit some similarities. Open symbols represent air.filled symbols represent water. 29
SILURIAN PALEOCLIMATE DATA FROM FLUID INCLUSIONS IN THE SALINA GROUP HALITE
Michigan Basin, suggesting that burial heating may have stretchedsome of the inclusions.
METHODOLOGY Beddedhalite samples of the SilurianSalinaGroup from the subsurface of Wayne County in southeastern Michigan were usedfor thisstudy (Figs.3A,B). Samples wereobtainedfrom thecorerepositoryat theUniversity of Michigan. Thesehalite cores were slabbed (Figs. 4A,B) and thin sections were prepared with aid of a water-free diamond wire saw with vegetable oil as a lubricant The vegetable oil aids in the cutting by keeping the sample cool and reducing any saw marks left on the halite. It is important not to overheat the sample because the fluid inclusions can become alteredand maynot yieldvalid data. The samples werethencleanedwith a dry clothandpolishedusingsandpaper ofprogressively finer grit to remove any remaining saw marks from the halite (Benison 1995). Mter the thin sections were cut, petrographic study of the halite was performed. This included "mapping" the thin
Figure 4. Photographs of slabbed Salina Group cores from the Wyandotte Chemical Corporation well (see Fig. 3a for location). (a) Sample of bedded halite from a depth of 1003 feet. (b) Sample of bedded halite from a depth of 1316 feet.
a)
sectionsand finding chevronand cumulatecrystalswithinthe same bed to determine shallow water deposition. This also included making observations to determine if the inclusions are primary or secondary. Primary fluid inclusions are trappedalong growthbandsas the crystalgrowsfroma liquid (Figs.5, 6A,B). Secondary fluidinclusionsformby alteration sometime after the mineral has formed and tend to be irregularly-shaped and cross-cut growth bands and other primary features. Since only primary fluid inclusions are remnantsof parentwaters,they are the focus of this study.
Lale Michigan
~ I
OO mi
lOOkrn
I
I
Wyandotte Chern. Corp. Well tr.Oetroit (
~
b)
-
'(;J
en
~ _
.s
~
en
....:l _
t.l.
Ct:l
t':l
'(;J
::J - .
E ;; 00 t':l
Z Figure 3. Location andgeologic setting of theSilurian Salina Group halite usedin this study. (a) Location ofcore sample at edge of the Michigan Basin in Wayne County, Michigan. (b) Schematic cross-section ofNiagara andSalina Groups in the subsurface of Michigan. Modified after Sears and Lucia 1979.
Figure 5. Photomicrograph of bottom-growth chevron halite crystal in the Salina Group. Note the primary. cubic, allliquid inclusions along growth bands. Darkarea atbottom of photomicrograph is carbonate mud.
30
LOSEY AND BENISON
In order to find the homogenization temperatures, vapor bubbles must first be nucleated in primary all-liquid inclusions. To make vapor bubbles, halite samples were cooledin a standard kitchen freezerat - -12°Cfor one to two weeks. Duringcooling,the fluidcontracted slightly and,as a result,approximately less than 10%of the inclusions formed a vaporbubble(Figs. 6b and 7). Thesampleswerethenrushed to a u.S.G.S.-modified Reynolds fluidinclusion stage,which had been pre-cooled to -lo°C to -15°C. The samples were thenquicklysearched in orderto identifyfluidinclusions that had nucleated vaporbubbles. Whilefocusing on an inclusion with a vapor bubble, the halitesample was warmeduntil the vaporbubble homogenized back to a liquid. This marks the homogenization temperature of the fluid inclusion (Goldstein andReynolds 1994; Benison 1995). The samples wereheated at a rate of 02°C/minute to O.5°C/minute. This slow heating rate ensures that the inclusion fluid equilibrated to the temperature that the thermocouple measures.
These data were then compared with those from modem shallow saline environments to determine any climatic similarities or differences (Table 1). If the temperatures for the Silurian are approximately the same as those in modem saline environments, it can be concluded that this Silurian climate was about the same as today's climate in similar evaporative settings. However, if the temperatures are very different, it couldmeanthe climateof the Silurian was either hotteror cooler than today's climate.
Figure 6. Photomicrographs of primary fluid inclusions along growth bands in bedded halite of theSalina Group. (a) All-liquid inclusions at room temperature (before cooling). (b) Fluid inclusions, some with an artificially-nucleated vapor bubble (see large inclusion in middle of photomicrograph), at temperature of approximately lO°C (immediately after cooling).
To evaluatethe validity of the homogenization temperatures, correlation and linear regression analyses were also performed on the data, with the aid of Minitab Version 10.5 for Macintosh. The correlation and linear regression values will either support the hypothesis that the fluid inclusions have not been alteredor it will disprovethis hypothesis. f
PETROGRAPffiC ANALYSIS
Thetwosections oftheWyandotte ChemicalCorporation core from depthsof 1003' and 1316' in WayneCounty, Michigan primary fluid inclusions in halite at room temp.
all-liquid inclusions
approximately 10 % of the fluid inclusions have nucleated bubbles; the rest remain all-liquid
all-liquid inclusions
Figure 7. Cartoon representation of the cooling and warming steps usedin thismethod to nucleate vapor bubbles and then measure homogenization temperatures. 31
SILURIAN PALEOCLIMATE DATA FROM FLUID INCLUSIONS IN THE SALINA GROUP HALITE Table 1. Surfacewater temperatures in modemevaporative environments. WATER 1EMPERATURES
WATER
QuidamBasin, China
12-38°C
1cm
SalinaOmotepec, Baja California
5 _70° C
surface
Casas and Lowenstein, 1989
LakeMagadi, Kenya
15- 85° C (hot springspresent)
surface
Eugster, 1970
DeathValley, California
9 - 36° C (Nov. - May) 20 - 38° C (April- May) 43 - 50° C (Aug.)
surface surface
Brown, 1995 Robertsand Spencer, 1995
LOCALITY
DEPTI-I
REFERENCE Casas et al., 1992
WalkerLake, Nevada
2 - 32° C
shoreline
Newton and Grossman, 1988
Salton Sea, California
10- 36° C
surface
Carpe1an, 1958
Great Salt Lake, Utah
-1 - 28° C
surface
Eubankand Brough, 1980
GreatInaguasalt works, Bahamas
24 - 35° C (Jan.) 28 - 36° C (Aug.)
surface
Zimmermann, pers. comm.
Dead Sea (southbasin)
35 - 40° C (summer) 19- 23° C (winter)
surface
Gomitzand Schreiber, 1981
consist of carbonate muds and bedded halite(Figs. 3 and 4). The bedded halite contains both chevron and cumulate crystals. These two crystal types contain numerous fluid inclusions that are situated along growth bands. Chevron crystals growfromthebottom toward thesurface. Theyrange insizefroma fewmillimeters toa centimeteror moreinlength and are only a few millimeters wide. They have alternating clear and cloudy bands, which are parallel to crystal faces. Thecloudy bandsarerichin fluidinclusions whereas theclear bandshaverelatively few fluidinclusions (Fig.5). Cumulate crystals, whichgrow on the watersurface or withinthe water column, areonly2-5 mm in sizeandarecubicin shape. They havegrowth bands in four directions whereas in the chevron crystal growth bandscanonlybe seenin twodirections. Each fluid inclusion-rich growth band is interpreted as a "fluid inclusion assemblage" herebecause thefluidinclusions along each growth band formed at approximately the same time (Goldstein and Reynolds 1994). Twotypesof halitebeds wereobserved in thesecoresamples: (1) beds containing only chevron crystals; and (2) beds containing both chevron and cumulate crystals. This indicates that these halite beds formed in a shallow water
32
setting. Thepresence ofbothchevronandcumulate crystals in thesamebed is a goodindication of shallow waterdeposition (typically depthof tensof centimeters; Lowenstein andHardie 1985; Schreiber, pers. comm.). Halite beds containing only chevron crystals probably formed in waters with depthsless than approximately 3 meters (Schreiber, pers. comm.). Furthermore, no desiccation features, such as mudcracks or microcrystalline crusts were observed, suggesting that these salinewaters, although shallow, were perennial. Most of the primary inclusions in this halite contain only liquid,are cubicin shape, and range in size from lum to 150 pm (Fig. 6a). Some primary fluid inclusions contained a crystal as wellas liquid. Theseinclusions probably formedin lowtemperature water(below approximately 50°C; Goldstein and Reynolds 1994). The primaryfluid inclusions appearto be unaltered and do not show petrographic signs of overheating. Altered inclusions in halite are not typically cubic but more commonly rounded in shape and may be
relatively large (...200+ urn),
Only unaltered all-liquid
primary fluid inclusions are useful for fmding surface water temperatures (Benison 1995).
LOSEY AND BENISON
Table 2. Homogenization temperature data from primary fluid inclusions in Salina Group halite, grouped by fluid inclusion assemblage. Depth in Feet
Chevron or Cumulate
Fluid Inclusion Assemblage
1003.5 1003.5 1003.5 1003.5 1003.5 1003.5 1003.5 1003.5 1003.5 1003.5 1316 -1316 1316 1316 1316 1316 1316 1316 1316 1316 1316 1316 1316 1316 1316 1316 1316 1316 1316 1316 1316 1316 1316 1316 1316 1316 1316 1316 1316 1316 1316 1316
Cumulate Cumulate Cumulate Cumulate Cumulate Cumulate Chevron Chevron Chevron Chevron Chevron Chevron Chevron Chevron Chevron Chevron Chevron Chevron Chevron Chevron Chevron Chevron Chevron Chevron Chevron Chevron Chevron Chevron Chevron Chevron Chevron Chevron Chevron Chevron Chevron Chevron Chevron Chevron Chevron Chevron Chevron Chevron
1 1
Size in
J.l.m
Th in °C
20.1 50.S 24.8 11.4 21.4 22.7 22.0 34.1 38.1 11.2 43.6 16.0 38.6 15.6 19.5 59.0 47.9 12.8 43.9 9.6 19.8 17.0 8.5 21.0 23.3 11A 22.7 2·tS 26.8 11.4 9.9 25.6 26.8 16.6 12.8 22.6 9.6 29.5 30.1 11.2 29.7 16.0 22.7 15.6 35.4 15.6 28.6 11.7 23.4 23.8 15.6 c 28.7 29.9 11.7 9.8 35.8 11.7 35.1 11.7 34.0 19.5 35.0 7.8 28.5 11.7 33.8 10.7 33.5 15.6 33.5 12.5 3104 12.8 31.5 22,4 25.3 11.2 31.8 12.8 34.0 12.8 35.7 12.8 36.2
I I 2 3 4 4 5 5 6 6 6 7 7 8 8 9 10 10 10 11
11 12 13 13 13 14 14 14 14 15 15
]5 IS 15 16 16 16 16 16 ]6
33
Reprod Max Temp Th in of Heating °C in °C
25.6 22.9
33.2 32.7 31.8 26.1 32.5
46.3 46.3 46.3 46.3 46.3 46.3 60.0 60.0 50.0 50.0 30.0 30.0 30.0 65.0 65.0 65.0 65.0 65.0 65.0 65.0 65.0 65.0 65.0 43.2 43.2 43.2 43.2 43.2 43.2 43.2 43.2 43.2 43.2 43.2 43.2 43.2 50.0 50.0 50.0 50.0 50.0 50.0
SILURIAN PALEOCLIMATE DATA FROM FLUID INCLUSIONS IN THE SALINA GROUP HALITE cooling) for 7 fluid inclusions and all were reproducible to within 1°C (Table 2).
HOMOGENIZATION TEMPERATURE DATA
Homogenization temperatures were measured for 43 fluid inclusions to a O.I°C accuracy. The inclusion size, whether the host crystal was a chevron or cumulate, the core sample depth, and maximum heating temperatures were also recorded andare displayed in Table2. Thesehomogenization temperatures range from 19.8°C to 59.0°C (Fig. 8). Within individual fluid inclusion assemblages (growth bands), the homogenization temperatures only vary from 4°C to IDoC. Homogenization temperatures were also repeated (after re-
HOMOGENIZAnON TEMPERATURE. 0 C
Figure 8. Histogram of homogenization temperatures in primary fluid inclusions in Salina Group halite.
50
•
E
::1.
u.i ~ en
40
•
Z
Q en
::J
30
0
...J
U
z
o
S
20
fi
+
•
XA
0
o
b.
•• •••
X
A
10
20
30
40
HOMOGENIZATION TEMPERATURE, 0 C
Figure 9. Homogenization temperatures plotted against sizes of primary fluid inclusions in Salina Group halite. Different symbols represent individual fluid inclusion assemblages. The randomness of this plot shows that homogenization temperature is not dependent upon fluid inclusion size and. thus, is evidence thatthese primary fluid inclusions have not undergone alteration. 34
DISCUSSION Validity of Data
Haliteis a veryfragile mineral and greatcaremustbe takenin determining if any possible alteration has occurred If the halitehasbeenaltered in anywayit willmostlikelybe useless for this type of paleoclimate study. This makesdetermining facts such as burial history and diagenetic events very important. The maximum burial depth of the Salina Group has been a difficult question toansweras it is not welldocumented in the literature. Through computer modeling, it hasbeenestimated that the maximum burialdepthof the SalinaGroupwas 2 km in the center of the basin (Everham and Huntoon 1999; Cercone and Pollack 1991). However, at the edges of the basin,wherethesesamples werelocated, themaximum burial depthwouldhaveprobably been less that 2 km, Regardless, the temperatures generated by the maximum burialdepthmay not have been sufficient to alter the fluid inclusions. A geothermal gradient of 30°C/km at thecenterof thebasinmay possibly be sufficient to alter the haliteundera depthof two kilometers. If a geothermal gradient of 30°C/krn is assumed, the temperature at thecenterof the basin would be near60°C and less than 60°C at the edge of the basin. These temperatures would not have been high enough to alter the halite near the edge of the basin. However, Cercone and Pollack estimate a higher geothermal gradient of 40°C/km to 6O°C/km (1991). Thismaystillnotbe a highenough gradient to alter the fluid inclusions, since our samples are from the edgeof thebasinandwerenotburiedas deeply. Additionally, our heating experiments have shown that the largest fluid inclusions in halite start to stretch after being heated to approximately 70°C. Therefore, it canbe safelyassumed that thesection of theSalinahaliteused in this studyfromtheedge of the basin has not been heated enough to be altered. Petrography and fluid inclusion data also support this conclusion. Fluid inclusion homogenization data 'strongly confirm the conclusion that theinclusions have not been altered. Figure9 displays the relationship between inclusion size and homogenization temperature. The different symbols represent fluid inclusion homogenization temperatures that were measured along different growth bands. The larger inclusions havelesssurface area (relative to the totalvolume) and can be altered more easily than the smaller inclusions (petrichenko 1979; Roedder 1984). Overall, wewouldexpect the larger inclusions to yield higher temperatures if the inclusions had beenaltered, which is not the case as seen in this graph. Close similarity of homogenization temperatures of fluid
LOSEY AND BENISON inclusions within a singlegrowthbandalsosuggests thatthese fluidinclusions are wellpreserved and unaltered (Table2 and Fig. 9). Withinindividual growthbandstherewouldbe more variation in the homogenization temperatures if the inclusions had been altered (greater than -15°C range; Goldstein and Reynolds 1994). Since the inclusions within individual growth bands were trapped around the same time we would expect the homogenization temperatures to be relatively closeas longas the inclusions hadnot beenaltered. This variation of 4°C to 10°Cin the Salina Groupinclusions is considered small (Goldstein and Reynolds 1994). Therefore, this similarity in homogenization temperatures within single growth bands also supports our interpretation that these homogenization temperatures represent true trapping temperatures and are not an artifactof alteration.
Statistical Analysis Correlation andlinearregression wereperformed toprovethe validity of the data that was collected. Minitab version 10.5 forMacintosh wasutilizedin ordertocalculate thecorrelation and regression values amongthe variables of core depth, host crystal type (chevron or cumulate), inclusion size, maximum temperature of heating, and homogenization temperature. None of the variables are highly correlated. However, it should be noted that there is a strong multicollinear effect betweenthedepthandhostcrystaltype. This canbeexplained by the fact that,although cumulate crystals existat both core depths, homogenization temperatures fromcumulate crystals were only measured from one core depth. Therefore, when calculating linearregression values, thesetwovaluesof depth andhostcrystal werenot used. TherangeofR'adjusted values obtained was0 - 5.2 %. Thesevalues areextremely low. The p-values (probability values) foreachvariable werequitehigh (greater than 0.05), signifying that the variables are not significant at ex = 95%. These findings help support the conclusion that the fluid inclusions have not been altered. If theyhadbeenaltered, the relationships among thesevariables would have shownstatistical trends.
Interpretations of Silurian Water Temperatures Silurian surface temperatures have been measured through the fluid inclusions in the Salina halite. Since our petrographic observations indicate thatthedepositional water was shallow, it can be assumedthat unaltered primary fluid inclusions in both cumulate and chevron crystals record the surface water temperature. The homogenization temperatures measured indicate that the surface water temperatures ranged from 19.8°C to 59.0°C with the majority of the temperatures between 20°C to 40°C. This watertemperature range is very similar to what we see in many modern evaporative environments (Table 1). It is important to note that theseSilurian paleotemperatures represent localized data for the southeast portion of the Michigan basin and for the specific times at which the two sections of halitewere being deposited. 35
Interpretations of Silurian Air Temperatures Because modern surface water temperatures and modern air temperatures are similar (Fig. 2), we can assumethat Silurian surface water temperatures are good proxies for Silurian air temperatures. Therefore, localized Silurian surface air temperatures may have fallen in the range of approximately 20°Cto 40°C. This indicates that Silurianclimatemay have beenrelatively similarto climate in somemodern evaporative environments.
Comparison with other Silurian Paleoclimate Data Our Silurian paleotemperatures agree with data found for another paleoclimate studywhichdetermined theoceanwater temperatures at whichSilurian brachiopods constructed their shells (Azmy et al. 1998). This quantitative paleoclimate study interpreted Silurian watertemperatures through oxygen isotope analysis of brachiopod shells from Russia. These temperatures ranged from 20.2°C to 42.7°C. However, the highendof this temperature rangemaybe unrealistic because protein molecules cannot withstand temperatures exceeding 37°C (Azmy et al. 1998). These temperatures represent a continental shelf environment in the photic zone. These temperatures also reinforce the temperatures that were measured fromtheSalinaGrouphalite. The Salinahalitewas in close proximity to the open ocean, which would have greatly influenced the local air temperature.
CONCLUSIONS We have determined that both Silurian water and air temperatures during the time of deposition of the Salina Group haliteprobably rangedfrom 19.8°Cto 59.0°C + 0.1°C, withthe majority of the temperatures between20°Cto 40°C. We have shown that this fluid inclusion method and these resulting temperatures are validin thisstudyfor thefollowing reasons: (1) reproducibility of homogenization temperatures; (2) similarity of homogenization temperatures within single individual fluid inclusion assemblages; (3) no relationship between homogenization temperature and inclusion size; (4) no statistical correlation of variables; and (5) overlap with Silurian ocean temperatures determined through isotope analyses of Silurian brachiopods (Arnzy et al. 1998). This is among the first quantitative Silurian climate data. More paleoclimate studies such as this one involving fluid inclusions in halite must be performed to strengthen paleoclimate models. This will broaden theknowledge of past climate so wecan betterevaluate andpredictclimatic changes such as global warming.
ACKNOWLEDGMENTS Thisworkwas doneas part of ArthurLosey's seniorthesis at Central Michigan University. Financial supportwasprovided by a CMU SummerResearch Scholarship awarded to Arthur
SILURIAN PALEOCLIMATE DATA FROM FLUID INCLUSIONS IN THE SALINA GROUP HALITE Losey. The Department of Geology at CMU is thanked for additional financial and logistical support Joyce Budaiat the University of Michigan core repository provided access to Salinasamples. The authors are grateful to Tim Lowenstein for insightful discussions about this research. Comments made bySEPM'sEvaporiteResearch Groupmembersare also greatly appreciated. Theauthors wouldalsolike to thankPaul A Catacosinos for his reviewof thispaperand his comments and suggestions. REFERENCES AMZY,K,VEIZER,I.,BASSETT,M.,andCOPPER,P.,1998,Oxygenand carbonisotopic compositionof Silurianbrachiopods:implications for coeval seawater and glaciations: Geological Society of America Bulletin, v. 110, p. 1499-1512. BARNOLA,J.M.,RAYNUND,D.,KOROTKEVICH,Y.S.,andLORIS,C., 1987,Vostokice coreprovides 160,000yearrecordof CO2:Nature, v, 329, p. 408- 413. BENISON,KC., 1995,Permiansurfacewatertemperatures fromNippewalla GroupHalite: Carbonates andEvaporates, v, 10, P. 245-251. BENISON,KC. and GOIDSTEIN, R.H., 1999, Permian paleoclimatedata fromfluid inclusionsin halite: Chemical Geology, v. 154,p. 113-132. BROWN, C.B, 1995, Sedimentology, fluid inclusion geochemistry, and paleoclimateimplicationsfrom a salt core of BadwaterBasin, Death Valley,California: unpublishedMaster's Thesis, State Universityof New York at Binghamton,Binghamton,NY,182 p. CARPELAN, LH., 1958, The Salton Sea: physical and chemical characteristics: Limnology and Oceanography, v. 3, p, 373-386. CASAS,E. and LOWENSTEIN,T.K, 1989,Diagenesisof salinepan halite: comparison of petrographic features of Modem, Quaternary, and Permianhalites: JournalofSedimentaryPetrology,v, 59,p. 724-739. CASAS,E., LOWENSTEIN,T.K, SPENCER,RJ., and PENGXI,Z,lm, Carnallite mineralization in he nonmarine, Quidam Basin, China: evidencefor theearlydiageneticoriginofpotashevaporites:Journalof Sedimentary Petrology, v, 62, p. 881-898. CERCONE, K.R and POLLACK, H.N., 1991, Thermal maturity of the MichiganBasin:GeologicalSocietyof AmericaSpecialPapers,v.256, p. 1-12. DELLWIG, L, 1955, Origin of the Salina salt of Michigan: Journal of Sedimentary Petrology, v, 25, p. 83-110.
36
EUBANK, M.E. and BROUGH,R.C., 1980, The Great Salt Lake and its influenceonweather:UtahGeologicalandMineraISurveyBuJletin, v. 116. EUGSTER,H.P., 1970,Chemistryand origin of the brinesof Lake Magadi, Kenya:Mineralogical Societyof AmericaSpecialPaper3,p. 213-235. EVERHAM,W. andHUNTOON,I., 1999,Thermalhistory of a deep wellin the Michigan Basin; implications for a complex burial history: GeothermicsinBasinAnalysis.p, 177-2CIl. GOLDSTEIN, RH. and REYNOIDS, TJ., 1994, Systematics of fluid inclusions in diagenetic minerals: SEPM (Society for Sedimentary Geology)ShortCourse31, TulsaOklahoma,199p. GORNITZ, V.M. and SCHREIBER,B.C., 1981, Displacivehalite hoppers from the Dead Sea: someimplicationsfor ancientevaporitedeposits: JournalofSedimentary Petrology, v. 51, p, 787-794. LEIBOID, A., 1m, Sedimentology andgeochemicalconstraintsonNiagaral Salina deposition, Michigan Basin: unpublished Ph. D. Dissertation, UniversityofMichigan,p. 280. LORIUS,C.,JOUZEL,I., RAYNAUND,D., HANSEN,I., and LETREUT, H., 1990,Theice corerecord:climatesensitivityand futuregreenhouse vvarming:JVature,v.347,p.139-145. LOWENSTEIN, T.K.andHARDffi,LA., 1985,Criteriafortherecognitionof salt pan evaporites: Sedimentology, v, 32, p. 627-644. NEWTON,M.S.and GROSSMAN, E.L, 1988,LateQuatematychronology of tufa deposits,WalkerLake, Nevada: Journalof Geology, v, 96, p. 417-433. PETRICHENKO,I.O., 1979,methods of study of inclusionsin minerals of salinedeposits:FluidInclusion Research, v. 12,p. 214-274. ROBERTS,S.M andSPENCER,RJ., 1995,Paleoclimatepreservedin fluid inclusionsinhalite:Geochimica etCosmachimica Acta,v. 59,p. 39293942. ROEDDER, E., 1984,FluidInclusions.MineralogicalSociety of America: Reviewsin Mineralogy, v, 12,644 p. SEARS,S.O.andLUCIA,FJ., 1979,Reef-growthmodelforSilurianpinnacle reefs,northernMichiganreeftrend: Geology, v, 7,p. 299-302. SONNENFEID, P. and AL-AASM,l, 1991, The Salina evaporites in the MichiganBasin:GeologicalSocietyofAmericaSpecialPapers,v.256, p.139-154. Receiv~
Plugust4, 1999 Accepted: February 15,2000