Clinical Care/Education/Nutrition O R I G I N A L
A R T I C L E
Stability of Body Weight in Type 2 Diabetes ZOOBIA W. CHAUDHRY, MD1 MARY C. GANNON, PHD1,2 FRANK Q. NUTTALL, MD, PHD1
results are the basis for the present report. Part of the data have been presented in abstract form (4)
OBJECTIVE — There is a concern that an “epidemic of obesity” is occurring in Western societies. One consequence of obesity is that type 2 diabetes may develop. Presumably, a great increase in body weight would continue in people with diabetes and may be accelerated due to pharmacological treatment. In this retrospective study, we tested the hypothesis that the weight gain in a diabetic population is greater than that in the general population. RESEARCH DESIGN AND METHODS — Data were obtained from the records of 205 adult men who have attended a diabetes clinic for ⱖ5 years. Their weight and glycohemoglobin at the last visit were compared with the initial visit data. The subjects were categorized according to treatment modalities. The mean follow-up was 9.4 years (range 5–23). RESULTS — For the group as a whole, the mean increase in body weight was 0.23 ⫾ 0.2 kg/year. BMI or initial age had little effect on the rate of weight gain. Treatment regimen used did have an effect on weight change. In subjects treated with insulin, with or without oral agents, body weight increased at a rate of 0.44 ⫾ 0.1 kg/year. In subjects treated with metformin or metformin and a sulfonylurea, there was a mean loss in weight, i.e., ⫺0.24 ⫾ 0.09 kg/year, and with sulfonylureas alone weight increased by 0.42 ⫾ 0.2 kg/year. CONCLUSIONS — The men treated with insulin alone or insulin combined with oral agents gained weight at a rate comparable with that reported for the general population, i.e., the weight gain was not extraordinary. Metformin treatment resulted in a modest loss of weight. Diabetes Care 29:493– 497, 2006
R
egulation of body weight and of body fat mass is the consequence of a highly complex and perhaps redundant signaling system (1). This system keeps the body weight in adults relatively constant, although an upward drift in both body weight and fat mass with aging has been shown in crosssectional, population-based studies (2). More recently, there has been a concern that an “epidemic of obesity” is occurring in Western societies based on an increase in BMI in the general population (3). One consequence of this is concern that an increasing BMI will result in the develop-
ment of type 2 diabetes. Presumably, an increase in BMI, and thus the degree of obesity, would continue in people with established diabetes. Thus, an increase in body weight would exceed the increase in the general population. It also may be accelerated by treatment with insulin and/or oral agents with the exception of metformin. We have accumulated body weight data over an extended period of time in a group of patients attending a diabetes clinic. Most of the subjects were obese and were being treated with oral agents, insulin, or a combination of these. The
● ● ● ● ● ● ● ● ● ● ● ● ● ● ● ● ● ● ● ● ● ● ● ● ● ● ● ● ● ● ● ● ● ● ● ● ● ● ● ● ● ● ● ● ● ● ● ● ●
From the 1Department of Medicine, Section of Endocrinology, Metabolism, and Nutrition, VA Medical Center, Minneapolis, Minnesota; and the 2Departments of Medicine and Food Science and Nutrition, University of Minnesota, Minneapolis, Minnesota. Address correspondence and reprint requests to Frank Q. Nuttall, MD, PhD, Chief, Section of Endocrinology, Metabolism, and Nutrition (111G), VA Medical Center One, Veterans Drive, Minneapolis, MN 55417. E-mail:
[email protected]. Received for publication 12 September 2005 and accepted in revised form 14 December 2005. Abbreviations: NHANES, National Health and Nutrition Examination Survey. A table elsewhere in this issue shows conventional and Syste`me International (SI) units and conversion factors for many substances. © 2006 by the American Diabetes Association. The costs of publication of this article were defrayed in part by the payment of page charges. This article must therefore be hereby marked “advertisement” in accordance with 18 U.S.C. Section 1734 solely to indicate this fact.
DIABETES CARE, VOLUME 29, NUMBER 3, MARCH 2006
RESEARCH DESIGN AND METHODS — In the diabetes clinic at the Minneapolis VA Medical Center, flow sheets are maintained regarding body weight, glycohemoglobin, and treatment modalities with each visit. The patient’s height is obtained initially, frequently thereafter, and in some cases annually. Data have been kept for up to 23 years. Records of the patients with type 2 diabetes, who currently are receiving care and have been enrolled for ⱖ5 years, were reviewed. Patients with congestive heart failure, serum creatinine ⬎1.5 mg/dl, known hepatic insufficiency, abnormal albumin concentration, hyperthyroidism, life-threatening malignancy, or HIV virus positivity were excluded. Also, the patients had at least one follow-up visit annually. Data on 205 adult men with type 2 diabetes who fulfilled these criteria were available. Percent total glycohemoglobin was measured by boronate affinity highperformance liquid chromatography (BioRad Variant; BioRad Labs, Hercules, CA). Percent total glycohemoglobin results are ⬃10% higher than HbA1c values in the range reported here. Weight was determined with subjects in street clothes without shoes on a digital scale (Scalitronix, White Plains, NY). Weight, BMI, and percent total glycohemoglobin at the last visit were compared with the initial visit data. The duration of follow-up was recorded. The treatment regimen at the last visit also was used to segregate the subjects into treatment categories. Data from additional patients (n ⫽ 13) receiving a thiazolidinedione as a part of their treatment regimen were analyzed separately. The remaining subjects were further subclassified according to treatment modalities, i.e., sulfonylureas, metformin, and insulin or various combinations. The type of treatment also was correlated with body weight change and percent total glycohemoglobin. The subjects were further categorized in analysis by initial BMI into four groups: ⬍25 kg/m2 (normal), 25–29.9 kg/m2 (overweight), 30 –35 kg/m2 (obese), and ⬎35 493
Body weight and type 2 diabetes
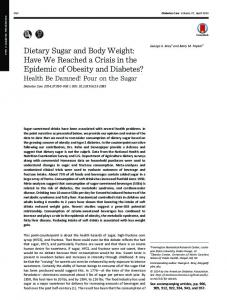
Figure 1—Relationship between initial BMI and rate of change in body weight. Groups are not statistically different. Numbers in the bars represent the number of subjects in each group. Data are presented as means ⫾ SE.
kg/m2 (morbidly obese). Statistics were determined using Statistical Analysis System (Version 8; SAS Institute, Cary, NC). A P value of ⬍0.05 is the criterion for significance. Data are presented as the means ⫾ SE. RESULTS — The mean duration of follow-up was 113 ⫾ 3.5 months (9.4 years,
range 5–23). Initial age of the group was 59 ⫾ 0.8 years (range 28 – 84). The initial average body weight was 96.5 ⫾ 1.4 kg (range 64 –173) (213 ⫾ 3 lb). At the end of the follow-up period, the average weight was 98.9 ⫾ 1.5 kg (range 60 –193) (218 ⫾ 3 lb). Thus, the average weight change per year was 0.23 ⫾ 0.07 kg (0.51 ⫾ 0.2 lb). The mean percent total
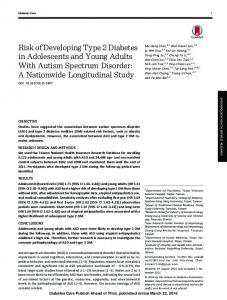
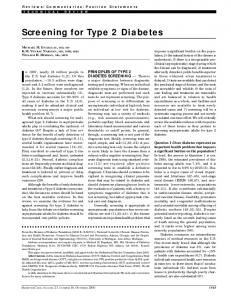
glycohemoglobin decreased by 1.23% (9.6 ⫾ 0.2 to 8.3 ⫾ 0.2%). The change in weight and change in percent total glycohemoglobin were not statistically significantly correlated (P ⫽ 0.1). When the subjects were subdivided into quartiles according to their initial BMI, the initial BMI also did not correlate with weight change per year (P ⫽ 0.5) (Fig. 1). When the initial age of the subjects was correlated with weight change per year, the correlation coefficient was ⫺0.17 (r2 ⫽ 0.03). This indicates only a very minor contribution of age to the weight change, even though it was statistically significant (P ⫽ 0.01) (Fig. 2). When the subjects were classified according to different treatment regimens, a difference in weight change was observed (Fig. 3). In the subjects receiving only insulin, only a sulfonylurea, insulin combined with a sulfonylurea, or insulin combined with metformin, weight gain occurred (P ⫽ 0.002). A small decrease in mean body weight occurred when subjects were treated with metformin or metformin and a sulfonylurea in combination. The weight loss was greater with metformin alone, but the difference was not statistically significant (P ⫽ 0.59). Among these treatment groups, the
Figure 2—Correlation of initial age with weight change per year. There is little correlation between weight change and initial age. 494
DIABETES CARE, VOLUME 29, NUMBER 3, MARCH 2006
Chaudhry, Gannon, and Nuttall
Figure 3—Weight changes with different treatment modalities. Data are presented as means ⫾ SE. Numbers in the bars represent the number of subjects in each group. I, insulin; M, metformin; MI, metformin ⫹ insulin; S, sulfonylurea; SI, sulfonylureas ⫹ insulin; SM, sulfonylureas ⫹ metformin; SMI, sulfonylureas ⫹ metformin ⫹ insulin. Using ANOVA and Duncan’s multiple range test, M was different from all groups except SM. M and SM were not significantly different from each other. The remaining groups were not different from each other.
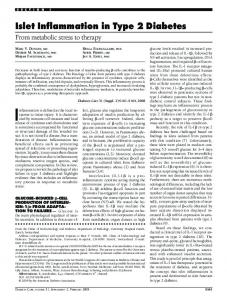
change in percent total glycohemoglobin was not different (data not shown) (P ⫽ 0.12). When the individual data for initial and final BMIs were plotted, the line of identity was linear and not different from one. However, most of the subjects receiving insulin where clustered above the line (Fig. 4).
CONCLUSIONS Weight changes in the general population Cross-sectional data. Based on crosssectional data, the prevalence of obese people in the adult population has been increasing over time. The prevalence was
12.8% in the National Health Examination Survey I study (1960 –1962), 14.1% in the National Health and Nutrition Examination Survey (NHANES) I study (1971–1974) (rev. in 3), 14.5% in the NHANES II study (1976 –1980), and had increased to 22.5% in the NHANES III study (1988 –1994) (3). Thus, the re-
Figure 4—Correlation of BMI and treatment modality for individual subjects. Most of the individual data above the line of identity are those subjects currently being treated with insulin with or without oral agents. DIABETES CARE, VOLUME 29, NUMBER 3, MARCH 2006
495
Body weight and type 2 diabetes ported increase from the NHES I to the NHANES III study was ⬃76%. Based on data obtained in the Behavioral Risk Factor Surveillance System telephone survey among men of all ethnic groups combined, the prevalence of obesity increased 52% from 1991 to 1998 (5). These increases have been referred to by authors at the Centers for Disease Control and Prevention as an “epidemic of obesity” in the U.S. population (3). Obesity is defined as a BMI ⬎29.9 kg/m2. However, as pointed out by others (6), presentation of data using a fixed BMI as a threshold for obesity and presenting data as a percent increase is likely to exaggerate the overall issue of weight gain, particularly when BMI data are known to be skewed toward the high side. In addition, the same populations were not surveyed in the above studies. Thus, even though the prevalence of obesity may be increasing, the actual mean increase in body weight over time for these and other populations studied may be rather modest. In the NHANES III survey, the mean increase in self-reported weight gain over the preceding 10 years among men who never smoked was only 1.49 ⫾ 0.44 kg (mean BMI 26.9 ⫾ 0.35 kg/m2). Thus, the mean annual weight gain was only 0.15 kg (0.33 lb). Among men who had discontinued smoking during the preceding 10 years, the weight gain was the greatest. However, this was only 5.28 kg (current mean BMI 27.9 ⫾ 0.27 kg/m2). This represents an average annual weight gain of only 0.53 kg/year (1.2 lbs/year). In men who continued to smoke, the weight gain was very similar to that of men who had never smoked, 1.82 ⫾ 0.39 kg (current mean BMI 25.8 ⫾ 0.24 kg/m2) (7). In the Behavioral Risk Factor Surveillance System report, although the increase in obesity was 52%, the actual mean increase in weight for men of all ethnic groups combined was 2.9 kg (6.4 lb) during the 7-year period or 0.4 kg/year (0.9 lb/year) (5). Longitudinal data Longitudinal data in normal populations are limited. However, in the health professional follow-up study of 22,171 men, the mean weight gain over 10 years was only 1.8 kg or 4 lb, i.e., 0.18 kg (0.4 lb) per year (8). In another study of 11 normal male subjects with a mean age of 29 years (range 22– 48), the mean weight change was 3.4 kg (range ⫺5.4 to 14.2) over a mean period of 7.3 years (range 496
4.0 –9.5); that is 0.47 kg/year or 1 lb/year (2). The Normative Aging Study is a longitudinal study of 2,280 men between the ages of 21 and 80 years at entry into the study. Baseline data were obtained between 1965 and 1967 in 350 subjects. From this study, 14- to 16-year longitudinal BMI data were available. In this group of men, the mean BMI increased very modestly in those ⬍50 years of age at entry (29.4 –31.3 kg/m2 or 6%). In those aged ⬎50 years, the mean BMI actually decreased (29.0 –28.1 kg/m2) (9). Thus, both cross-sectional and longitudinal data do not support a rapid gain in weight in adult male populations. Also, although the mean BMIs of the subjects in these general population– based studies were less, the weight gain was similar to that in our subjects with diabetes who received insulin therapy. It was greater than in those receiving oral agents (Fig. 3). Another interesting observation in the present study is that the most obese patients did not gain as much weight as did those with the lowest body weights, although this did not reach statistical significance (P ⫽ 0.5) (Fig. 1). In the present study, the overall mean weight gain was 0.23 ⫾ 0.2 kg (0.51 ⫾ 0.2 lb)/year. However, a mean weight gain only occurred in the group that received a sulfonylurea, insulin, or a combination of insulin with any oral agent (Fig. 3). In this group, the weight gain was 0.44 ⫾ 0.09 kg or 0.97 ⫾ 0.2 lb, with a range of ⫺4.1 to 11.6 lb/year. Interestingly, when considered individually, there were 10 subjects in the study population who gained on average ⬎1.8 kg (4 lb)/year. Three were receiving insulin, three a sulfonylurea and insulin, two metformin and insulin, one sulfonylurea only, and one a sulfonylurea and metformin. Thus, there was nothing unique in regard to the treatment regimens used or the glucose control attained. We suspect that they were genetically programmed to gain relatively large amounts of weight and that the treatment regimens used did not modify this. If these 10 subjects are eliminated, the mean weight change for the entire group was only 0.08 ⫾ 0.05 kg/year (0.2 ⫾ 0.1 lb/ year) (range ⫺5.6 to 4.0 lb). Thirteen additional patients received a thiazolidinedione for a mean period of 28 months at the end of the study period. They were considered separately from the rest of the subjects, since thiazolidinediones are known to cause marked weight
gain in some patients (10). In this group, the mean duration of follow-up was similar to the rest of the subjects in the study (9 ⫾ 0.7 years). The mean change in weight per year was 1.1 ⫾ 0.9 kg/year (2 ⫾ 0.8 lb/year) before the thiazolidinedione treatment was begun. This increased to 3.7 ⫾ 1.2 kg/year (8 ⫾ 2.6 lb/year, range ⫺3.6 to 32.3) after the patients began taking the thiazolidinediones. In this subgroup, the percent total glycohemoglobin decreased by 1.7 ⫾ 0.5%. Limitations of the study In this retrospective study, only male patients were studied. It would have been ideal to analyze the body weight data in the context of variations in treatment modalities and variations in percent total glycohemoglobin over the years studied. However, these datasets would be very complex and difficult to analyze in a meaningful fashion, particularly in this relatively small population. Averages of weight gain may be misleading. Nevertheless, as indicated in the manuscript, the majority of the patients had only a very modest weight gain. In summary, the overall mean weight gain in male patients with type 2 diabetes in our clinic was similar to that reported in the general male population. It was less in those treated with metformin. As expected, addition of a thiazolidinedione to the treatment regimen resulted in a dramatically increased mean body weight in this small group of patients. It is also clear that body weight is highly programmed, and its maintenance is not compromised in the obese patients in this study. However, regimens used to treat people with type 2 diabetes can modify the weight-regulating mechanisms in general. These effects are modest with the exception of those induced by thiazolidinediones. As pointed out previously, body weight and fat mass in particular are likely to be genetically (and/or familially) determined throughout the life cycle in the majority of people, and this is defended with great precision by endogenous control mechanisms (6,11–16). It does not mean, however, that body weight is stable throughout adult life. It is important to put into context the change in food energy intake required to explain the weight gain in our subjects and the population in general. A gain in weight of 0.5 lb/year is the equivalent of an increase in daily food energy of just 4.8 kcal/day (0.5 lb/year ⫻ 3,500 kcal/lb ⫻ 1 DIABETES CARE, VOLUME 29, NUMBER 3, MARCH 2006
Chaudhry, Gannon, and Nuttall year/365 days ⫽ 4.8 kcal/day) or the equivalent of one-fourth teaspoonful of sugar or approximately one-eighth teaspoonful of fat. For a weight gain of 0.97 lb/year it would be 8.7 kcal/day. Even a weight gain of 8 lb/year is the equivalent of an excess food energy intake of only 76 kcal/day, provided the weight increase was represented by an increase in body fat. In all cases, the food energy required would be even less if the weight gained was not entirely fat, as would be expected (17). Thus, for people to voluntarily, cognitively adjust their food energy intake with such precision is a daunting task. The data also indicate how finely endogenous regulating systems match energy intake to output in nearly all people, even if there is a drift upward in body weight.
2. 3.
4. 5.
6. 7.
Acknowledgments — Supported by funds from the Department of Veterans Affairs. Special thanks to Waseem Khaliq, MD, MPH, for assistance with statistical analysis. References 1. Havel PJ: Peripheral signals conveying metabolic information to the brain: short-
DIABETES CARE, VOLUME 29, NUMBER 3, MARCH 2006
8.
term and long-term regulation of food intake and energy homeostasis. Exp Biol Med (Maywood) 226:963–977, 2001 Forbes GB, Reina JC: Adult lean body mass declines with age: some longitudinal observations. Metabolism 19:653–663, 1970 Flegal KM, Carroll MD, Kuczmarski RJ, Johnson CL: Overweight and obesity in the United States: prevalence and trends, 1960 –1994. Int J Obes Relat Metab Disord 22:39 – 47, 1998 Chaudhry ZW, Gannon MC, Nuttall FQ: Stability of body weight in type 2 diabetes (Abstract). Diabetes 54: A427, 2005 Mokdad AH, Serdula MK, Dietz WH, Bowman BA, Marks JS, Koplan JP: The spread of the obesity epidemic in the United States, 1991–1998. JAMA 282: 1519 –1522, 1999 Friedman JM: A war on obesity, not the obese. Science 299:856 – 858, 2003 Flegal KM, Troiano RP, Pamuk ER, Kucz marski RJ, Campbell SM: The influence of smoking cessation on the prevalence of overweight in the United States. N Engl J Med 333:1165–1170, 1995 Koh-Banerjee P, Wang Y, Hu FB, Spiegelman D, Willett WC, Rimm EB: Changes in body weight and body fat distribution as risk factors for clinical diabetes in US men. Am J Epidemiol 159:1150 – 1159, 2004
9. Grinker JA, Tucker K, Vokonas PS, Rush D: Overweight and leanness in adulthood: prospective study of male participants in the Normative Aging Study. Int J Obes Relat Metab Disord 20:561–569, 1996 10. Fonseca V: Effect of thiazolidinediones on body weight in patients with diabetes mellitus. Am J Med 115 (Suppl. 8A):42S– 48S, 2003 11. Dubois EF: Basal Metabolism in Health and Disease. Philadelphia, Lea & Febiger, 1936 12. Stunkard AJ, Harris JR, Pedersen NL, McClearn GE: The body-mass index of twins who have been reared apart. N Engl J Med 322:1483–1487, 1990 13. Rony HR: Obesity and Leanness. Philadelphia, Lea & Febiger, 1940 14. Nuttall FQ: Obesity and diabetes mellitus. Minn Med 62:19 –21, 1979 15. Abid M, Billington CJ, Nuttall FQ: Thyroid function and energy intake during weight gain following treatment of hyperthyroidism. J Am Coll Nutr 18:189 –193, 1999 16. Nuttall FQ: Diet and the diabetic patient. Diabetes Care 6:197–207, 1983 17. Lillioja S, Bogardus C: Obesity and insulin resistance: lessons learned from the Pima Indians. Diabetes Metab Rev 4:517–540, 1988
497