Supporting Information
High-contrast Fluorescence Imaging in Fixed and Living Cells Using Optimized Optical Switches
Liangxing Wu, Yingrui Dai, Xiaoli Jiang, Chutima Petchprayoon, Jessie Eileen Lee, Tao Jiang, Yuling Yan and Gerard Marriott Department of Bioengineering, University of California-Berkeley, Berkeley, CA 94720
Email:
[email protected]
TABLE OF CONTENTS General Experimental Methods
Design and Synthesis of Compounds 1-5
S2
S2-S20
Spectroscopic and Photochromic Properties
S21-S27
Copies of 1H, 13C NMR and MS Spectra
S28-S49 1
General Experimental Methods All reactions were carried out under an atmosphere of dry nitrogen. Glassware were oven-dried prior to use. Unless otherwise indicated, common reagents or materials were obtained from commercial source and used without further purification. Dry distilled THF and CH2 Cl2 were obtained from Acros and used as received. Flash column chromatography was performed using silica gel 60 (70-230 mesh). Analytical thin layer chromatography (TLC) was carried out on Merck silica gel plates with QF254 indicator and visualized by UV. Absorbance spectra were recorded on a Shimadzu UV-1601PC spectrophotometer at room temperature. Fluorescence spectra were obtained on a AMINCO-Bowman Series 2 spectrofluorometer with 4 nm excitation and emission slit width at room temperature. 1
H and
13
C NMR spectra were recorded on a Bruker 400 (400 MHz 1H; 100 MHz
13
C)
spectrometer at room temperature. Chemical shifts were reported in ppm relative to the residual solvent signal (CDCl3: 99.8 % D contains 0.05% v/v TMS, 7.26 ppm 1H; 77.00 ppm 13C). Photochemistry: a hand-held UV lamp (UVGL-25) was used as the 365 nm light source. A laser pointer (GLP-405nm) http://www.green-blue-laser.com/id126.html was used as the 405 nm light source. An OptoLED light from CAIRN research http://www.cairnresearch.co.uk/catalogue/illumination/optoled/product/optoled-light-source was used as the light source for 530 nm. Design of red-shifted BIPS derivatives There is increasing scepticism amongst biologists about using near ultraviolet light to generate fluorescent signals from a labeled cell. The main issues underlying this trend are: living cells undergo a UV-triggered stress response that can interfere with the study at hand and, most commercial confocal fluorescence microscopes do not allow for laser or wde-field excitation of the field with light lower than 400 nm. The challenge in exploiting unique properties of optical switch probes in cell and tissue biology then is to shift the SP-absorption band beyond 400 nm, while maintaining
2
robust and high-fidelity switching between the SP and MC states.
Our strategy in red-shifting the SP-absorption band from a typical valiue of 350 nm to beyond 400 nm is to maintain the core aromatic structure of BIPS while extending bond conjugation at different sites on the aromatic scaffold. We reasoned that this strategy would lead to a red-shifting of the SP-absorption band while providing a quantitative evaluation and insight into how these spectral shifts affect quantum yields for excite state transitions between SP and MC. The alkynyl substituent is chosen to extend the conjugation because (i) it is compact, engages in -bonding with the indoline and pyran moeities and only modestly increases the mass of BIPS; (ii) the alkyne group is easily introduced into BIPS by using a palladium catalyzed Sonogashira coupling reaction; (iii) red-shifting of the absorption wavelength of aromatic probes with alkynyl groups has already been demonstrated for BODIPY; (iv) alkynyl groups are readily functionalized eg. by direct attachment to an aryl moiety or by conversion to a triazole via click chemistry. Here we describe the synthesis of BIPS molecules harboring alknyl groups at different sites and carry out a systematic investigation of the effect of the alkyne substituent on the spectroscopic and photochromic properties for each substitution. Alkyne substitutions are carried out using the 6-NitroBIPS with the exception of 8-nitro-BIPS (compound 1f).
Several alkynyl BIPS with promising photochromic properties are chosen for further functionalization with anthracene or triazole in order to improve their photoswitching performance. In particular, 9-Alkynyl-anthracene has a strong absorbtion band at 405 nm and is easily prepared from the alkynyl-BIPS while the triazole group will also increase -conjugation and is readily generated from the alkyne by using click chemistry. Synthesis of BIPS derivatives The synthesis of new BIPS probes is summarized in Scheme S1-2 and detailed in the experimental procedures. The alkyne substituted BIPS 1a-1h are prepared from the corresponding Iodo-BIPS precursors 4a-4h (bromo-BIPS for 4f) by a Sonogashira
3
coupling reaction. The iodo-BIPS are synthesized by condensation of corresponding indoline and salicylaldehyde. The aldehyde fragment for BIPS 4a-4d is a commercially available compound 2-hydroxy-5-nitrobenzaldehyde. The indoline fragments for 4a-4d are synthesized from the corresponding Iodo-anilines using reported conditions. It is noteworthy that the two indolines 5a and 5c, which can be separated by chromatography, are generated from 3-iodoaniline. For 4e-4h, we note that the indoline fragment
is commercially available and the substituted
salicylaldehydes are prepared according to reported procedures. Unfortunately, several
reactions
conditions
employed
in
the
preparation
of
5-iodo-3-
nitrosalicylaldehyde all lead to the formation of inseparable mixtures. a
b
Scheme S1. Illustrative synthesis of (a) 4a - 4d; (b) 4e - 4h.
4
Commercial 5-bromo-3-nitrosalicylaldehyde is used instead to afford the 6-bromo-8Nitro-BIPS, 4f. BIPS derivatives 4a-4h are generated in good yield through reaction of indolines with salicylaldehydes in boiling ethanol. a
b
Scheme S2. Illustrative synthesis of compound (a) 1 and 3; (b) 2.
5
Compounds 4a-4h are coupled with trimethylsilylacetylene to afford the alkynylBIPS 1a-1h. The Sonogashira coupling is successful even at at 20c for iodo-BIPS. However, the reaction did not go to completion for the bromo-BIPS 4f even after prolonged reaction time and elevated temperature although sufficient material is isolated for spectroscopic studies. The trimethylsilyl group in compounds 1a-h is removed by tetrabutylammonium fluoride (TBAF) to generate the free acetylene derivative. Coupling of the deprotected compounds with 9-bromoanthracene was unsuccessful due to dimerization of the free acetylene BIPS. Thus compounds 2a and 2f are prepared from the treaction of the BIPS halide with 9-alkyne-anthracene using Sonogashira coupling. The low yield for these compounds is due to incomplete reactions and decomposition of the starting materials at high temperature.
Cu(I)-catalyzed cycloaddition of the free acetylene BIPS and tert-butyl azidoacetate afford the triazole substituted BIPS 3a and 3f in moderate yields. A derivative 3fa with a long hydrocarbon chain for labeling of cell membranes is also prepared by a similar method. A typical synthesis of compound 1 An oven-dried 100 mL Schlenk tube is charged with compound 4b (103 mg, 0.23 mmol), PdCl2 (PPh3 )2 (14 mg, 0.02 mmol) and CuI (4 mg, 0.02 mmol). The Schlenk tube is evacuated and back-filled with nitrogen. The process is repeated for three times. Dry dichloromethane (10 mL) is added via syringe to the Schlenk tube, followed by Et 3N (0.32 mL, 2.30 mmol) and trimethylsilyl acetylene (162 uL, 1.15 mmol). The reaction mixture is stirred at toom temperature for 24 h and then concentrated in vacuo. The residue is purified by flash chromatography (silica gel, 30 to 50 % CH2Cl2/Hexanes) to afford the pure product 1b (88 mg, 91 %) as a yellow solid. 1H NMR (400 MHz, CDCl3 ) δ 8.04 – 7.99 (m, 2H), 7.35 (dd, J = 8.0, 1.5 Hz, 1H), 7.19 (d, J = 1.5 Hz, 1H), 6.93 (d, J = 10.3 Hz, 1H), 6.73 (d, J = 8.4 Hz, 1H), 6.46 (d, J = 8.0 Hz, 1H), 5.83 (d, J = 10.3 Hz, 1H), 2.75 (s, 3H), 1.28 (s, 3H), 1.16 (s, 3H), 0.25 (s, 9H);
13
C NMR (100 MHz, CDCl3 ) δ 159.42, 147.91, 141.02, 136.13, 132.50,
128.44, 125.87, 125.36, 122.67, 121.05, 118.49, 115.39, 113.73, 106.68, 106.25, 106.08, 91.51, 52.02, 28.72, 25.64, 19.77, 0.12. HRMS (ESI) m/z calculated for 6
C24 H27N2O3 Si ([M+H] +) 419.1785; found 419.1789. Compounds 1a, 1c – 1h are synthesized using similar procedure as described for compound 1b. Compound 1a The reaction did not go to completion even after long reaction times. Thus the reaction mixture is refluxed overnight and TLC showed complete conversion of the starting marterial 4a. Yellow solid (48 mg, 49 %). 1 H NMR (400 MHz, CDCl3 ) δ 8.05 – 7.99 (m, 2H), 7.12 (t, J = 7.8 Hz, 1H), 6.96 – 6.92 (m, 2H), 6.76 (d, J = 8.7 Hz, 1H), 6.52 (d, J = 7.8 Hz, 1H), 5.83 (d, J = 10.3 Hz, 1H), 2.74 (s, 3H), 1.52 (s, 3H), 1.28 (s, 3H), 0.24 (s, 9H); 13
C NMR (100 MHz, CDCl3) δ 159.82, 147.97, 140.90, 136.48, 128.48, 127.61,
125.88, 124.24, 122.67, 121.31, 118.50, 117.98, 115.37, 107.38, 106.33, 102.93, 98.47, 53.54, 28.90, 22.91, 19.38, -0.27. HRMS (ESI) m/z calculated for C24 H27N2O3 Si ([M+H] +) 419.1785; found 419.1788. Compound 1c Yellow solid (78 mg, 88 %). 1H NMR (400 MHz, CDCl3) δ 8.04 – 7.99 (m, 2H), 7.05 – 6.98 (m, 2H), 6.93 (d, J = 10.4 Hz, 1H), 6.73 (d, J = 8.4 Hz, 1H), 6.64 (s, 1H), 5.84 (d, J = 10.4 Hz, 1H), 2.73 (s, 3H), 1.27 (s, 3H), 1.17 (s, 3H), 0.25 (s, 9H);
13
C NMR
(100 MHz, CDCl3) δ 159.54, 147.53, 140.98, 137.09, 128.42, 125.85, 124.16, 122.66, 122.30, 121.34, 121.16, 118.54, 115.38, 110.12, 106.18, 105.83, 93.02, 52.20, 28.79, 25.59, 19.70, 0.00. HRMS (ESI) m/z calculated for C 24H27 N2 O3 Si ([M+H]+) 419.1785; found 419.1791. Compound 1d Yellow solid (84 mg, 89 %). 1H NMR (400 MHz, CDCl3) δ 8.05 – 7.99 (m, 2H), 7.24 (dd, J = 7.9, 1.2 Hz, 1H), 7.00 (dd, J = 7.2, 1.2 Hz, 1H), 6.94 (d, J = 10.4 Hz, 1H), 6.80 – 6.74 (m, 2H), 5.83 (d, J = 10.4 Hz, 1H), 3.23 (s, 3H), 1.27 (s, 3H), 1.14 (s, 3H), 0.21 (s, 9H);
13
C NMR (100 MHz, CDCl3 ) δ 159.56, 147.60, 140.98, 137.15,
133.30, 128.48, 125.85, 122.66, 122.11, 121.34, 119.41, 118.42, 115.38, 106.48,
7
103.68, 103.20, 97.33, 50.98, 30.65, 25.88, 19.83, -0.31. HRMS (ESI) m/z calculated for C24H27N2O3Si ([M+H] +) 419.1785; found 419.1787. Compound 1e Yellow solid (63 mg, 61 %). 1H NMR (400 MHz, CDCl3 ) δ 7.89 (d, J = 9.1 Hz, 1H), 7.46 (d, J = 10.6 Hz, 1H), 7.21 (td, J = 7.7, 1.2 Hz, 1H), 7.10 (dd, J = 7.3, 0.8 Hz, 1H), 6.89 (td, J = 7.5, 0.8 Hz, 1H), 6.73 (d, J = 9.1 Hz, 1H), 6.57 (d, J = 7.7 Hz, 1H), 5.96 (d, J = 10.6 Hz, 1H), 2.74 (s, 3H), 1.29 (s, 3H), 1.21 (s, 3H), 0.35 (s, 9H);
13
C
NMR (100 MHz, CDCl3) δ 158.35, 147.64, 143.10, 136.02, 127.82, 127.05, 126.61, 122.49, 121.52, 121.14, 119.73, 116.18, 115.19, 109.16, 107.01, 105.89, 96.84, 52.27, 28.82, 25.80, 19.90, -0.30. HRMS (ESI) m/z calculated for C 24 H27 N2 O3 Si ([M+H] +) 419.1785; found 419.1787. Compound 1f Prepared from compound 4f (6-Br-8-NO2-BIPS) by refluxing in THF overnight. The reaction did not go to completion even after elongated reaction time. The product is purified by preparative TLC plates (10 % EtOAc/Hexanes) to give a yellow solid (12 mg, 15 %). 1
H NMR (400 MHz, CDCl3 ) δ 7.78 (d, J = 2.0 Hz, 1H), 7.35 (d, J = 2.0 Hz, 1H), 7.19
– 7.13 (m, 1H), 7.07 – 7.03 (m, 1H), 6.89 – 6.83 (m, 2H), 6.53 (d, J = 8.0 Hz, 1H), 5.88 (d, J = 10.4 Hz, 1H), 2.72 (s, 3H), 1.33 (s, 3H), 1.18 (s, 3H), 0.24 (s, 9H); HRMS (ESI) m/z calculated for C 24H27N2 O3Si ([M+H] + ) 419.1785; found 419.1794. Compound 1g Yellow solid (97 mg, 93 %). 1H NMR (400 MHz, CDCl3 ) δ 7.90 (s, 1H), 7.21 (td, J = 7.7, 1.2 Hz, 1H), 7.12 – 7.07 (m, 1H), 6.97 (s, 1H), 6.94 – 6.87 (m, 2H), 6.56 (d, J = 7.7 Hz, 1H), 5.90 (d, J = 10.3 Hz, 1H), 2.74 (s, 3H), 1.31 (s, 3H), 1.20 (s, 3H), 0.26 (s, 9H);
13
C NMR (100 MHz, CDCl3 ) δ 157.73, 147.56, 142.25, 135.95, 127.77,
123.66, 122.43, 121.43, 121.16, 120.25, 119.78, 118.87, 107.03, 106.24, 104.05, 99.94, 52.24, 28.79, 25.78, 19.86, -0.46. HRMS (ESI) m/z calculated for C24 H27N2O3 Si ([M+H] +) 419.1785; found 419.1787. Compound 1h 8
Blue solid (66 mg, 64 %). 1H NMR (400 MHz, CDCl3 ) δ 8.11 (d, J = 2.7 Hz, 1H), 7.93 (d, J = 2.7 Hz, 1H), 7.15 (td, J = 7.7, 1.2 Hz, 1H), 7.06 (dd, J = 7.3, 0.8 Hz, 1H), 6.90 (d, J = 10.4 Hz, 1H), 6.85 (td, J = 7.5, 0.8 Hz, 1H), 6.55 (d, J = 7.7 Hz, 1H), 5.91 (d, J = 10.4 Hz, 1H), 2.72 (s, 3H), 1.31 (s, 3H), 1.20 (s, 3H), -0.07 (s, 9H);
13
C NMR
(100 MHz, CDCl3) δ 160.56, 147.65, 140.08, 136.13, 128.06, 127.92, 127.62, 122.06, 121.99, 121.29, 119.89, 118.64, 111.24, 107.30, 107.15, 101.92, 97.16, 52.15, 28.92, 25.51, 19.90, -0.68. HRMS (ESI) m/z calculated for C 24 H27N2 O3 Si ([M+H]+) 419.1785; found 419.1792.
Illustrative synthesis of compound 2 An oven-dried 100 mL Schlenk tube is charged with compound 4a (134 mg, 0.23 mmol), 9-alkynylanthracene (250 mg, 1.20 mmol), PdCl2 (PPh3 )2 (14 mg, 0.02 mmol) and CuI (4 mg, 0.02 mmol). The Schlenk tube is evacuated and back-filled with nitrogen. The process is repeated for three times. Dry THF (10 mL) is added via syringe to the Schlenk tube, followed by 1 mL of Et 3 N. The reaction mixture is refluxed for 24 h and then concentrated in vacuo. The residue is passed through a short pad of silica gel eluted with 15 % EtOAc/Hexanes to afford the crude product which is further purified by preparative TLC plates (silica gel, 15 % EtOAc/Hexanes) to afford the pure product 2a (10 mg, 6 %) as a yellow solid. 1 H NMR (400 MHz, CDCl3 ) δ 8.62 (d, J = 8.5 Hz, 2H), 8.45 (s, 1H), 8.07 – 7.98 (m, 4H), 7.60 – 7.54 (m, 2H), 7.54 – 7.48 (m, 2H), 7.29 (d, J = 4.6 Hz, 2H), 6.96 (d, J = 10.4 Hz, 1H), 6.83 (d, J = 8.9 Hz, 1H), 6.66 – 6.59 (m, 1H), 5.88 (d, J = 10.4 Hz, 1H), 2.80 (s, 3H), 1.70 (s, 3H), 1.45 (s, 3H). HRMS (ESI) m/z calculated for C 35 H27 N2O3 ([M+H] +) 523.2016; found 523.2006. Compound 2f Green solid (10 mg, 6 %). 1 H NMR (400 MHz, CDCl3 ) δ 8.58 (d, J = 8.7 Hz, 2H), 8.46 (s, 1H), 8.08 – 8.00 (m, 3H), 7.66 – 7.58 (m, 3H), 7.56 – 7.50 (m, 2H), 7.23 – 7.16 (m, 1H), 7.09 (d, J = 6.8 Hz, 1H), 7.00 (d, J = 10.4 Hz, 1H), 6.89 (t, J = 7.2 Hz, 1H), 6.57 (d, J = 8.0 Hz, 1H), 5.96 (d, J = 10.4 Hz, 1H), 2.79 (s, 3H), 1.41 (s, 3H), 1.23 (s, 3H). HRMS (ESI) m/z calculated for C 35 H27 N2O3 ([M+H] +) 523.2016; found 9
523.2011.
Illustrative synthesis of compound 3 A solution of compound 1a (27 mg, 0.065 mmol) in 5 mL of dry THF is cooled to 0 o
C and TBAF (1M in THF, 85 L) is added dropwise via syringe. After stirring at 0
o
C for 15 min, the reaction mixture is diluted with 20 mL of EtOAc and ished with
water then brine. The organic layer is dried over Na 2 SO4 then concentrated under vacuum. The residue is dissolved in 5 mL of CH 2Cl2 and azido tert-butylacetate (52 mg, 0.33 mmol) is added. Then 5 mL of water is added to the solution, followed by CuSO45H2O (2.5 mg, 0.01 mmol) and sodium ascorbate (2 mg, 0.01 mmol). The reaction mixture is stirred at room temperature overnight and diluted with 20 mL of CH2 Cl2. The organic layer is ished with water, brine, dried over Na 2SO4 and then concentrated under vacuum. The residue is purified by flash chromatography (silica gel, 20 to 40 % EtOAc/Hexanes) to afford the pure product 3a (15 mg, 46 %) as a white solid. 1 H NMR (400 MHz, CDCl3 ) δ 8.00 – 7.95 (m, 2H), 7.71 (s, 1H), 7.24 (t, J = 7.8 Hz, 1H), 6.92 (d, J = 10.4 Hz, 1H), 6.82 (dd, J = 7.7, 0.9 Hz, 1H), 6.74 – 6.70 (m, 1H), 6.62 (dd, J = 7.8, 0.7 Hz, 1H), 5.88 (d, J = 10.4 Hz, 1H), 5.11 (s, 2H), 2.77 (s, 3H), 1.52 (s, 3H), 1.47 (s, 9H), 0.98 (s, 3H);
13
C NMR (100 MHz, CDCl3 ) δ
165.14, 159.98, 148.79, 147.27, 140.78, 133.99, 128.54, 127.67, 126.76, 125.76, 123.42, 122.67, 122.41, 121.56, 118.53, 115.31, 107.54, 107.30, 83.78, 53.78, 51.60, 29.34, 27.94, 24.84, 19.17. HRMS (ESI) m/z calculated for C 27 H30 N5 O5 ([M+H] +) 504.2241; found 504.2247. Compound 3f Green solid (12 mg, 29 %). 1H NMR (400 MHz, CDCl3) δ 8.03 (d, J = 2.0 Hz, 1H), 7.92 (d, J = 2.4 Hz, 1H), 7.90 (s, 1H), 7.17 (td, J = 7.6, 1.2 Hz, 1H), 7.09 – 7.05 (m, 1H), 6.99 (d, J = 10.4 Hz, 1H), 6.89 – 6.84 (m, 1H), 6.54 (d, J = 8.0 Hz, 1H), 5.91 (d, J = 10.4 Hz 1H), 5.11 (s, 2H), 2.75 (s, 3H), 1.51 (s, 9H), 1.37 (s, 3H), 1.21 (s, 3H). 13
C NMR (100 MHz, CDCl3) δ 165.09, 148.16, 147.40, 145.92, 137.05, 135.95,
128.41, 128.24, 127.68, 122.61, 122.25, 122.13, 122.10, 121.88, 121.39, 120.79, 119.84, 107.08, 106.97, 84.09, 52.19, 51.65, 29.69, 27.98, 26.03, 20.01. HRMS (ESI) 10
m/z calculated for C27H30N5O5 ([M+H] +) 504.2241; found 504.2251. Compound 3fa Green solid (2 mg, 25 %). 1 H NMR (400 MHz, CDCl3 ) δ 7.99 (d, J = 2.1 Hz, 1H), 7.93 (d, J = 2.1 Hz, 1H), 7.73 (s, 1H), 7.17 (td, J = 7.7, 1.2 Hz, 1H), 7.07 (d, J = 7.3 Hz, 1H), 6.99 (d, J = 10.4 Hz, 1H), 6.86 (t, J = 7.0 Hz, 1H), 6.54 (d, J = 7.6 Hz, 1H), 5.91 (d, J = 10.4 Hz, 1H), 4.40 (t, J = 7.2 Hz, 2H), 2.75 (s, 3H), 2.00 – 1.88 (m, 2H), 1.56 (s, 3H), 1.39 - 1.18 (m, 2H), 0.87 (t, J = 6.8 Hz, 3H). HRMS (ESI) m/z calculated for C33H44N5 O3 ([M+H]+) 558.3439; found 558.3430.
Synthesis of Compounds 5a-d
To a 100 mL flask were added 3-iodoaniline (2.5 g, 11.4 mmol) and concentrated hydrochloric acid (20 mL). The mixture was cooled to 0 oC in an ice bath. A solution of NaNO2 (0.94 g, 13.7 mmol) in water (20 mL) was added dropwise to the aniline suspension. The mixture was stirred for 30 min at 0 oC and then a solution of SnCl2.2H2O (7.7 g, 34.2 mmol) in concentrated hydrochloric acid (10 mL) was added dropwise. The reaction mixture was stirred at 0 oC for a further 2 h. The precipitate was filtered and dried. The solid was dissolved in 30 mL of EtOH then 3-methylbutanone (2.5 mL, 22.8 mmol) and concentrated H2SO4 (0.3 mL) were added. The reaction solution was refluxed for overnight and then cooled to room temperature. The volatile components were removed under vacuum and the residue was dissolved in EtOAc (100 mL) then washed with saturated Na2CO3 aqueous solution, water and brine. The organic layer was dried over Na2SO4 and evaporated under reduced pressure. The residue was purified by flash chromatography (10 % to 20 % EtOAc/Hexanes) to afford pure 5c (143 mg, 4.4 %), pure 5a (481 mg, 14.8 %) and 1.46 g mixture of 5a and 5c.
11
For 5a: 1H NMR (400 MHz, CDCl3) δ 7.45 (dd, J = 7.9, 0.8 Hz, 1H), 7.39 (dd, J = 7.6, 0.8 Hz, 1H), 6.88 (t, J = 7.8 Hz, 1H), 2.14 (s, 3H), 1.28 (s, 6H). For 5c: 1H NMR (400 MHz, CDCl3) δ 7.83 (d, J = 1.5 Hz, 1H), 7.48 (dd, J = 7.7, 1.5 Hz, 1H), 6.99 (d, J = 7.7 Hz, 1H), 2.23 (s, 3H), 1.23 (s, 6H).
Red oil (1.69 g, 59 %), prepared using similar conditions as described for 5a. 1H NMR (400 MHz, CDCl3) δ 7.59 (dd, J = 8.0, 1.7 Hz, 1H), 7.57 (d, J = 1.7 Hz, 1H), 7.26 (d, J = 8.0, 1H), 2.23 (s, 3H), 1.26 (s, 6H);
13
C NMR (100 MHz, CDCl3) δ 188.24, 153.34,
148.09, 136.56, 130.56, 121.73, 89.85, 53.94, 22.84, 15.30.
Brown solid (1.21 g, 42 %), prepared using similar conditions as described for 5a. Synthesis of Compounds 4a-d
Compound 5b (0.86 g, 3 mmol) was dissolved in 10 mL of CH3CN and MeI (1.9 mL, 30 mmol) was added to the solution. The mixture was stirred at 65 oC for overnight. The precipitate formed was filtered and washed with Et2O. The solid and 5-
12
nitrosalicylaldehyde (461 mg, 2.76 mmol) were dissolved in 15 mL of ethanol then Et 3N (0.57 mL, 4.14 mmol) was added. The mixture was refluxed for 4 h then cooled to room temperature. The volatile components were removed under vacuum. The residue was purified by flash chromatography (20 to 40 % CH2Cl2/Hexanes) to afford the pure product 4b (1.08 g, 80 %) as a yellow solid. 1H NMR (400 MHz, CDCl3) δ 8.55-7.99 (m, 2H), 7.47 (dd, J = 8.2, 1.8 Hz, 1H), 7.33 (d, J = 1.8 Hz, 1H), 6.94 (d, J = 10.3 Hz, 1H), 6.76 (d, J = 8.4 Hz, 1H), 6.35 (d, J = 8.2 Hz, 1H), 5.83 (d, J = 10.3 Hz, 1H), 2.72 (s, 3H), 1.27 (s, 3H), 1.18 (s, 3H). 13C NMR (100 MHz, CDCl3) δ 159.38, 147.41, 141.01, 138.87, 136.44, 130.38, 128.51, 125.86, 122.67, 120.92, 118.46, 115.37, 109.33, 106.00, 80.78, 52.13, 28.76, 25.67, 19.72. HRMS (ESI) m/z calculated for C19H18IN2O3 ([M+H]+) 449.0357; found 449.0363. Compound 4a, 4c, 4d were prepared using similar conditions as described for 4b.
White solid (635 mg, 84 %). 1H NMR (400 MHz, CDCl3) δ 8.05-8.00 (m, 2H), 7.29 (dd, J = 8.0, 0.8 Hz, 1H), 6.96 (d, J = 10.4 Hz, 1H), 6.87 (t, J = 7.9 Hz, 1H), 6.77 (d, J = 8.6 Hz, 1H), 6.52 (dd, J = 7.8, 0.6 Hz, 1H), 5.82 (d, J = 10.4 Hz, 1H), 2.73 (s, 3H), 1.45 (s, 3H), 1.25 (s, 3H); 13C NMR (100 MHz, CDCl3) δ 159.68, 149.57, 140.95, 135.70, 131.00, 129.40, 128.93, 125.95, 122.76, 120.85, 118.28, 115.34, 106.98, 106.58, 89.94, 54.87, 28.85, 22.15, 19.91. HRMS (ESI) m/z calculated for C19H18IN2O3 ([M+H]+) 449.0357; found 449.0362.
13
White solid (168 mg, 75 %). 1H NMR (400 MHz, CDCl3) δ 8.05-8.00 (m, 2H), 7.21 (dd, J = 7.6, 1.5 Hz, 1H), 6.94 (d, J = 10.3 Hz, 1H), 6.87 (d, J = 1.4 Hz, 1H), 6.82 (d, J = 7.6 Hz, 1H), 6.77 (d, J = 8.4 Hz, 1H), 5.84 (d, J = 10.3 Hz, 1H), 2.72 (s, 3H), 1.27 (s, 3H), 1.17 (s, 3H);
13
C NMR (100 MHz, CDCl3) δ 159.36, 148.99, 141.02, 136.08, 128.54,
128.49, 125.87, 123.29, 122.67, 120.97, 118.46, 116.00, 115.39, 106.03, 92.49, 51.99, 28.77, 25.59, 19.67. HRMS (ESI) m/z calculated for C19H18IN2O3 ([M+H]+) 449.0357; found 449.0360.
Yellow solid (415 mg, 27 %). 1H NMR (400 MHz, CDCl3) δ 8.05-8.00 (m, 2H), 7.61 (dd, J = 8.0, 1.2 Hz, 1H), 7.03 (dd, J = 7.2, 1.2 Hz, 1H), 6.94 (d, J = 10.3 Hz, 1H), 6.79 (d, J = 8.8 Hz, 1H), 6.61-6.56 (m, 1H), 5.83 (d, J = 10.4 Hz, 1H), 3.16 (s, 3H), 1.27 (s, 3H), 1.15 (s, 3H); 13C NMR (100 MHz, CDCl3) δ 159.43, 147.17, 141.01, 140.38, 139.16, 128.63, 125.90, 122.70, 121.82, 121.55, 121.42, 118.31, 115.38, 107.14, 70.80, 51.03, 32.47, 25.93, 19.74. HRMS (ESI) m/z calculated for C19H18IN2O3 ([M+H]+) 449.0357; found 449.0362.
14
Synthesis of Compound 4e-h
The starting materials for compounds 4e-h are showed in the above figure. Compounds 6f, 6h and Fisher’s base are commercially available and used as received. Attempt to prepare 5-iodo-3-nitrosalicylaldehyde lead to an inseparable mixture, thus the commercially available compound 6f was used instead. Compounds 6e and 6g were prepared according to literature procedures. 1
Compound 6e (368 mg, 1.25 mmol) was dissolved in 10 mL of EtOH and a solution of Fisher’s base (217 mg, 1.25 mmol) in 5 mL of EtOH was added. The reaction mixture was refluxed for 4 h then cooled to room temperature. The solvent was removed under vacuum and the residue was purified by flash chromatography (30 to 50 % CH2Cl2/Hexanes) to afford compound 4e (533 mg, 95 %) as a yellow solid. 1H NMR (400 MHz, CDCl3) δ 7.64 (d, J = 8.9 Hz, 1H), 7.35 (d, J = 10.7 Hz, 1H), 7.23 (t, J = 7.7 Hz, 1H), 7.11 (d, J = 7.2 Hz, 1H), 6.91 (t, J = 7.2 Hz, 1H), 6.76 (d, J = 8.9 Hz, 1H), 6.58 (d, J = 7.7 Hz, 1H), 5.91 (d, J = 10.7 Hz, 1H), 2.75 (s, 3H), 1.31 (s, 3H), 1.22 (s, 3H); 13C NMR (100 MHz, CDCl3) δ 157.63, 147.55, 147.16, 135.86, 133.56, 127.81, 126.78, 123.62, 122.95, 121.48, 119.75, 115.60, 106.99, 105.97, 91.71, 52.17, 28.84, 25.72, 19.93. HRMS (ESI) m/z calculated for C19H18IN2O3 ([M+H]+) 449.0357; found 449.0358. Compounds 4f-h were prepared using similar conditions as described for compound 4e. 15
Yellow solid (439 mg, 55 %). 1H NMR (400 MHz, CDCl3) δ 7.81 (d, J = 2.4 Hz, 1H), 7.39 (d, J = 2.4 Hz, 1H), 7.18 (td, J = 7.7, 1.2 Hz, 1H), 7.09 – 7.06 (m, 1H), 6.90 – 6.84 (m, 2H), 6.55 (d, J = 7.7 Hz, 1H), 5.92 (d, J = 10.4 Hz, 1H), 2.74 (s, 3H), 1.36 (s, 3H), 1.20 (s, 3H);
13
C NMR (100 MHz, CDCl3) δ 147.41, 147.19, 137.38, 135.70, 133.39,
127.68, 127.46, 127.36, 123.26, 122.67, 121.33, 119.90, 110.29, 107.06, 52.24, 28.76, 25.92, 19.91. HRMS (ESI) m/z calculated for C19H18BrN2O3 ([M+H]+) 401.0495; found 401.0501.
Yellow solid (235 mg, 48 %). 1H NMR (400 MHz, CDCl3) δ 7.82 (s, 1H), 7.41 (s, 1H), 7.24 – 7.18 (m, 1H), 7.12 – 7.07 (m, 1H), 6.93 – 6.87 (m, 2H), 6.57 (d, J = 7.7 Hz, 1H), 5.90 (d, J = 10.3 Hz, 1H), 2.75 (s, 3H), 1.31 (s, 3H), 1.19 (s, 3H);
13
C NMR (100 MHz,
CDCl3) δ 157.62, 147.48, 144.52, 135.87, 128.19, 127.84, 127.65, 124.20, 122.39, 121.48, 119.87, 118.71, 107.09, 106.67, 87.40, 52.32, 28.84, 25.81, 19.88. HRMS (ESI) m/z calculated for C19H18IN2O3 ([M+H]+) 449.0357; found 449.0363.
Green solid (361 mg, 40 %). 1H NMR (400 MHz, CDCl3) δ 8.46 (d, J = 2.6 Hz, 1H), 7.99 (d, J = 2.6 Hz, 1H), 7.21 (td, J = 7.7, 1.3 Hz, 1H), 7.12 – 7.09 (m, 1H), 6.91 (dd, J = 7.4, 0.9 Hz, 1H), 6.87 (d, J = 10.3 Hz, 1H), 6.58 (d, J = 7.7 Hz, 1H), 5.88 (d, J = 10.3 Hz, 1H), 16
2.70 (s, 3H), 1.31 (s, 3H), 1.21 (s, 3H);
13
C NMR (100 MHz, CDCl3) δ 158.15, 147.40,
141.34, 135.89, 134.46, 128.17, 127.69, 122.29, 122.18, 121.38, 119.92, 118.40, 108.51, 107.17, 82.53, 52.15, 28.91, 25.68, 20.21. HRMS (ESI) m/z calculated for C19H18IN2O3 ([M+H]+) 449.0357; found 449.0363. Synthesis of TzBIPS-NHS:
Step 1: Synthesis of compound 7 To a stirred solution of compound 1f (97 mg, 0.23 mmol) in 5 mL of dry THF was added TBAF (1 M in THF, 0.28 mL) at 0 oC. After stirred at 0 oC for 15 min, the reaction mixture was diluted with EtOAc then washed with water and brine. The organic layer was dried over Na2SO4 then concentrated. The residue was purified by flash chromatography (silica gel, 10 to 20 % EtOAc/Hexanes) to afford the pure product 7 (42 mg, 53 %) as a blue solid. 1H NMR (400 MHz, CDCl3) δ 7.81 (d, J = 2.0 Hz, 1H), 7.37 (d, J = 2.0 Hz, 1H), 7.17 (td, J = 7.7, 1.2 Hz, 1H), 7.07 (d, J = 7.2 Hz, 1H), 6.91 – 6.84 (m, 2H), 6.54 (d, J = 7.7 Hz, 1H), 5.90 (d, J = 10.4 Hz, 1H), 3.05 (s, 1H), 2.74 (s, 3H), 1.35 (s, 3H), 1.20 (s, 3H).
17
Step 2: Synthesis of TzBIPS-COOH To a stirred solution of compound 7 (42 mg, 0.12 mmol), Cu(CH3CN)4PF6 (9 mg, 0.024 mmol) and tris[(1-benzyl-1H-1,2,3-triazol-4-yl)methyl]amine (TBTA, 3 mg, 0.006 mmol) in 5 mL of THF was added DIEA (0.21 mL, 1.2 mmol), followed by a solution of 6azido-hexanoic acid (57 mg, 0.36 mmol) in 1 mL of THF. The reaction mixture was stirred at room temperature for 2 h then diluted with EtOAc. The mixture was acidified with 1N HCl then washed with water and brine. The organic layer was dried over Na2SO4 and concentrated. The residue was purified by flash chromatography (silica gel, 0 to 20 % MeOH/DCM) to afford the pure product TzBIPS-COOH (36 mg, 60 %) as a purple solid. 1H NMR (400 MHz, CDCl3) δ 8.00 (d, J = 2.1 Hz, 1H), 7.92 (d, J = 2.1 Hz, 1H), 7.77 (s, 1H), 7.17 (td, J = 7.6, 1.2 Hz, 1H), 7.07 (d, J = 6.4 Hz, 1H), 6.99 (d, J = 10.4 Hz, 1H), 6.86 (t, J = 7.4 Hz, 1H), 6.54 (d, J = 7.7 Hz, 1H), 5.91 (d, J = 10.3 Hz, 1H), 4.42 (t, J = 7.0 Hz, 2H), 2.75 (s, 3H), 2.37 (t, J = 7.2 Hz, 2H), 2.01 – 1.96 (m, 2H), 1.73 – 1.68 (m, 2H), 1.46 – 1.38 (m, 2H), 1.36 (s, 3H), 1.20 (s, 3H). HRMS (ESI) m/z calculated for C27H28N5O5 ([M-H]-) 502.2096; found 502.2089. 18
19
Step 3: synthesis of TzBIPS-NHS To a stirred solution of TzBIPS-COOH (4 mg, 0.008 mmol), dicyclohexcylcarbodiimide (DCC, 2 mg, 0.0096 mmol) and N-hydroxysuccinimide (NHS-OH, 1.2 mg, 0.01 mmol) in 3 mL of THF was added triethylamine (4 L, 0.024 mmol). The reaction mixture was stirred at room temperature overnight then filtered and concentrated. The residue was used directly without further purification.
References: 1. (a) Inouye, M.; Akamatsu, K.; Nakazumi, H. J. Am. Chem. Soc. 1997, 119, 9160-9165; (b) Hodgson, H. H.; Jenkinson, T. A. J. Chem. Soc. 1928, 2272-80.
20
Spectroscopic and Photochromic Properties of Compounds a.
c.
b.
d.
Figure S1. Absorbance spectra of compounds 1a-h (30 M in EtOH): (a) as dissolved in solution; (b) irradiated with 365 nm light for 30 s; (c) irradiated with 405 nm light for 60 s; (d) illustrative example of reversibility of photoswitching for compound 1b: irradiated alternatively with 365 nm light for 30 s and 530 nm light for 5 min.
a.
b.
Figure S2. Optical properties of compound 2a: (a) comparison of absorbance of 2a in ethanol: as dissolved in solution (black); irradiated with 365 nm light for 30 s (red); irradiated with 405 nm light for 60 s (blue); (b) fluorescence spectra of 2a in ethanol (30 M), as dissolved in solution (red); irradiated with 365 nm light for 30 s (blue); thermal recovery of the irradiated solution in the dark at room temperature, fluorescence spectrum after 5 min at room temperature is shown (green). a.
b.
21
Figure S3. (a) Comparison of absorbance of 3f in ethanol (30 M): as dissolved in solution (black); irradiated with 365 nm light for 30 s (red); irradiated with 405 nm light for 60 s (blue); (b) Comparison of absorbance spectra of 1f and 3f in ethanol (30 M), the solution is irradiated with 405 nm light for 60 s.
(a)
(b)
(c)
Figure S4: Absorbance spectra of compounds 4a-h and reference compound A (30 M in EtOH): (a) as dissolved in solution; (b) irradiated with 365 nm light for 30 s; (c) irradiated with 405 nm light for 60 s.
(a)
( b)
Figure S5: Absorbance spectra of compounds (a) 2f and (b) 3a (30 M in EtOH): as dissolved in solution (black curve); irradiated with 365 nm light for 30 s (red curve); irradiated with 405 nm light for 60 s (blue curve).
22
Kinetic profiles of thermal decay of the MC states in the dark at room temperature: (a)
(b)
(c)
(d)
(e)
(f)
(g)
(h)
(i)
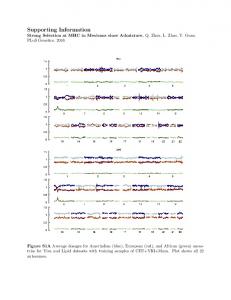
Figure S6. Kinetic profiles of thermal decay of the MC states in the dark at room temperature for compounds 1-3: (a) 1a; (b) 1b; (c) 1c; (d) 1d; (e) 1f; (f) 1h; (g) 2a; (h) 3a; (i) 3f. For compounds 1e, 1g and 2f, photochemistry is not efficient to be measured.
23
(a)
(b)
(c)
(d)
(e)
(f)
(g)
(h)
(i)
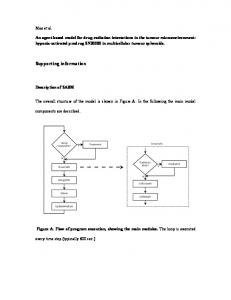
Figure S7. Demonstration of the reversibility of photoswitching for compounds 1-3: (a) 1a; (b) 1b; (c) 1c; (d) 1d; (e) 1f; (f) 1h; (g) 2a; (h) 3a; (i) 3f. For compounds 1e, 1g and 2f, photochemistry is not efficient to be measured. The solution was irradiated alternatively with 365 nm light for 30 s and 530 nm light for 5 min then the absorption spectrum was recorded.
24
Table S1. Spectroscopic properties of the new BIPS derivatives 1-4 (30 M in ethanol)
A 1a 1b 1c 1d 1e 1f 1g 1h 2a 2f 3a 3f 4a 4b 4c 4d 4e 4f 4g 4h
max,SP (nm) 336 329 336 322 332 331 357 336 337 398 423 334 352 332 336* 336* 336* 336* 355 350 335
max,SP (M-1cm-1) 9600 12100 10600 14500 17200 8500 3600 6800 9300 15500 20900 8800 3100 10900 11000 8900 9400 5600 3500 4400 7000
405,SP (M-1cm-1) 300 300 300 300 300 700 1300 900 700 14500 21600 200 1300 200 300 200 200 500 700 400 700
max,MC (nm) 539 545 559 548 557 N/A 578 N/A 550 548 599 538 585 547 552 550 553 541 566 533 540
Fl, MC (nm) 630 635 640 640 640 N/A 680 N/A 650 630 690 630 635 630 630 630 670 630 630
A0 (30s_365nm) 0.400 0.409 0.272 0.395 0.257 N/A 0.173 N/A 0.392 0.382 0.022 0.342 0.112 0.420 0.377 0.350 0.227 0.011 0.101 0.020 0.102
A0 (60s_405nm) 0.019 0.025 0.009 0.017 0.014 N/A 0.067 N/A 0.028 0.162 0.106 0.026 0.091 0.029 0.020 0.016 0.012 N/A 0.014 N/A 0.005
t1/2 (s) 1386 359 82 127 51 N/A stable N/A 5715 273 N/A 821 830 188 142 66 32 N/A N/A N/A N/A
25
Optical switching of red-shifted BIPS probes in living cells The most promising red-shifted optical switch probes 3f is chosen for further testing in living cells. NIH 3T3 cells are incubated with 50 M of probe in medium for 30 min at 37 oC followed by washing with fresh culture medium. Cells loaded with these probes are indistinguishable from control cells, indicating the probes are not cytotoxic. Strong and uniform MC fluorescence is observed for both probes in the cells indicating they penetrate the plasma membrane and are retained within the cytoplasm although in some cases vesicles staining is also found.
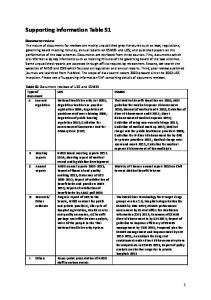
Optical switching of the red-shifted BIPS probes in living NIH 3T3 cells is carried out using a Zeiss 700 confocal microscope equipped with 405 nm and 555 nm lasers. A demonstration of optical switching of 3f is shown in Figure S8a. As indicated in the scheme of Figure S8c, a single cycle of optical switching between the SP and MC states of 3f is achieved by first irradiating the red-circled area in the field of view (Figure S8a) with two sequential scans at 405 nm. Exposure of the sample to 405 nm generates the fluorescent MC state, which is observed on exposing the entire field to 555 nm light. Some of the 555 nm excited MC-molecules may undergo a MC to SP transition. Consequently the MC-fluorescence signal diminishes to almost zero following five sequential scans of the entire field to 555 nm. The intensity of MCfluorescence over a single cycle of optical swiching is only modulated within the redcircled area ie that exposed to both 405 nm and 555 nm (Figure S8a). Subsequent illumination of SP molecules in the same red circled area with two sequential scans at 405 nm, repopulates the MC state as seen by the increase in MC fluorescence, whereas no red fluorescence is detected outside of the circled area. Frames showing modulation of 3f within the red circled region is shown for two cycles of optical switching (Figure S8a). The corresponding plot of the MC-intensity within the red circled region within a labeled cell is shown in Figure S8d. Faster cycling times can be realized by increasing the intensity of the 555 nm laser and by reducing the area of the exposed sample.
The robust and highly efficient optical switching of 3f within living cells is realized 26
with power levels for the 405 and 555 nm lasers set at 10 % of the laser capacity. Even so only 2 scans are required to trigger the almost complete conversion of SP to MC in the 405 nm exposed region and only a handful of scans at 555 nm is required to convet all the MC to the SP state. These poperties suggest that the new red shifted BIPS exhibit superior performance in optical switching compared to previously reported probes. Also significant is that the MC-fluorescence signal reaches almost its initial value in the selected area after two scans of 405 nm irradiation indicating that optical switching of compound 3f is reversible and robust even in living cells. The same sequence of 405 nm and 555 nm scans of a field of cells labeled with 6-NO2BIPS under the same conditions has no effect on the intensity of MC-fluorescence, indicating 405 nm does not trigger the SP to MC transition for this most widely use BIPS probe (Figure S8b).
405 nm
2
555 nm
3
405 nm
4
555 nm
405 nm
MC fluorescence
1
Figure S8. Optical switching of the probes (50 M) in living NIH-3T3 cells: (a) probe 3f; (b) reference compound 6-NO2-BIPS: fluorescence pictures of all the cells in the imaging field with nuclei stained with DAPI (leftmost image); Montage of MCfluorescence over two cycles of optical switching (1-4, corresponding to the time point 1-4 in Figure 6c); (c) Schematic representation of the laser perturbation sequence used for optical switching in this study; (d) MC-fluorescence intensity profile over multiple cycles of optical switching taken from the cell within the red circle in Figure S8a.
27