Sep 27, 1986 - The Tax Reform Act (TRA) of. 1986 provides a natural experiment for examining how taxpayers respond to transitory capital gains tax rates.
National Tax Journal Vol. 47, no. 1, (March, 1994), pp. 1-18
TAXREFORMAND REALIZATIONSOF CAPITAL GAINS IN 1986 LEONARD CLAUSING,**
E. BURMAN,* & JOHN
KIMBERLY F. O’HARE***
A.
AbstractThe Tax Reform Act (TRA) of 1986 provides a natural experiment for examining how taxpayers respond to transitory capital gains tax rates. The act, passed in the summer of 1986, rendered the 20 percent top statutory tax rate, in effect from 1981 to 1986, transitory. This paper develops a model of taxpayer behavior in response to transitory tax changes and tests its implications using data on asset transactions in the Sales of Capital Assets (SOCA) panel compiled by the IRS. We find evidence that responses to transitory tax changes are dramatic and generally consistent with theory.
dence that the seeming differences between these contradictory bodies of evidence are a result of the high degree of transitory year-to-year fluctuations in capital gains tax rates in cross-section data sets, owing to transitory changes in income or tax planning. That study found that taxpayers are much more responsive to temporary variation in capital gains tax rates than to changes in the underlying or “permanent” tax rate. Thus, evidence from cross-section and panel data that does not control for differences between permanent and transitory tax changes may not be relevant to how taxpayers would respond to a permanent change in statutory tax rates.’
The ongoing debate about the revenue consequences of cutting tax rates on capital gains has been confounded by two contradictory sets of empirical evidence. The evidence from individual tax returns has usually been interpreted as implying that realizations of capital gains are highly responsive to differences in tax rates, whereas the evidence from time series has usually been interpreted as implying the opposite conclusion. Burman and Randolph (1994) present evi-
This study looks for evidence of how taxpayers respond to transitory variation in tax rates in a different way: by studying the natural experiment created by The Tax Reform Act (TRA) of 1986. The TRA raised the maximum tax rate on long-term capital gains from 20 to 28 percent and lowered the short-term rate from 50 to 28 percent. Although the act was passed by Congress at the end of September 1986, the new tax rates did not become effective until 1987.2 Thus, the TRA rendered both the low tax rates on long-term capital gains and the high tax rates on short-term capital gains
*Congressional Budget Office, WashIngton, D C 20515 **Harvard Unwerslty, Cambndge, MA 02138 ***Joint Committee on Taxation, WashIngton, D C 20024
National Tax Journal Vol. 47, no. 1, (March, 1994), pp. 1-18
temporary. Taxpayers had a strong incentive to accelerate sales of assets with long-term gains and defer sales of assets with short-term gains. In response to these incentives, realizations of assets with long-term capital gains increased dramatically at the end of 1986 and realizations of assets with short-term gains declined. This paper examines tclxpayer responses to the TRA using data from the Sales of Capital Assets (SOCA) panel compiled by the Statistics of Income (SOI) division of the IRS. The SOCA panel includes the sales price, basis, gain or loss, and the purchase and sale datcls for capital gains transactions reported on individual tax returns. Thus, we can examine the level and time pitttern of capital gains transactions at the end of ‘1986 and compare them with similar data from earlier in the year and from 1985. Because the SOCA data include a variety of assets, only some of which are highly liquid, we can test the relation between the transaction costs of selling and the sensitivity of sales to transitory capital gains tax changes. In addition, the richness of the data allows us to examine other predictions of theory. For example, taxpayers with net ca,pital losses for the year should be less responsive to the capital gains tax changes than taxpayers with net capital gains, and older taxpayers should be less responsive than younger taxpayers. Bolster, Lindsey, and Mitrusi (1989) examined the response of corporate stock sales to the 1986 tax reform using Compustat data on sales volumes. They found that stocks had abnormally high trading volurnes in December, 1986. The relevance 0.f these results to the actual behavior of individual investors is uncertain because all of the key behavioral variables-capital gains and losses and asset holding period--had to be imputed. The Compustat data do not apply
specifically to individual taxpayers-the only ones who were directly affected by the announced increase in the tax rate on long-term capital gains. Thus, the abnormal sales volume might have been a response of institutional investors to expected changes in stock prices as a result of the TRA or some other factors. The Compustat data also do not indicate the holding period of individual investors, so the imputation that a particular asset had a gain or loss depends on the assumed holding period, as does the characterization of long- and short-term capital gains. Furthermore, the data on sales volume did not allow Bolster et al. to distinguish the behavior of taxpayers with net gains from those with net losses, or to test the hypothesis that assets with high transaction costs of selling (such as real estate) are less responsive to transitory variations than corporate stock. Finally, lacking data on individuals, the earlier study could not examine how other variables, such as the age of the taxpayer, might have affected the decision to realize capital gains and losses in 1986. Our paper begins by summarizing the chronology of tax reform and developing a simple model of how taxpayers would be expected to respond. We then examine the model’s predictions in two ways: (1) by estimating simple weekly regressions that attempt to control for exogenous macroeconomic factors that might have affected capital gains, and (2) by comparing gains transactions reported in 1986 to transactions in 1985 for individuals in different situations. TRA AND CAPITAL GAINS TAX RATES The TRA significantly changed the taxation of capital gains. Before 1987, 60 percent of net long-term capital gains was excluded from tax. Therefore, for a taxpayer in the higlrlest pre-TRA tax bracket, 50 percent, the tax rate on
I
REALIZATIONS OF CAPITAL GAINS IN 1986
long-term capital gains was 20 percent. Short-term gains (held for six months or less) were taxed in full, at rates up to 50 percent. Losses were fully deductible against gains and one-half of net longterm losses was deductible against ordinary income, up to $3,000, with any excess carried forward to later tax years. Tax reform eliminated the distinction between short-term and long-term gains. Both short-term and long-term gains were taxed in full, although losses were still subject to the $3,000 limitation. In 1987, the tax rate on capital gains was capped at 28 percent, but the effective maximum increased to 33 percent in 1988.3 These changes raised the tax rate on long-term gains and lowered the tax rate on short-term gains. Thus, the TRA provided a natural experiment of how taxpayers respond to transitory variations in capital gains tax rates. Unfortunately, it was not a controlled experiment. The TRA included many factors that might have altered the timing of realizations of capital gains. For example, the TRA would have raised taxes on corporations substantially. Combined with some of the anti-tax shelter provisions affecting individuals, the TRA would thus have been expected to reduce some asset values.4 Investors who thought that the TRA had a higher chance of passing than the typical investor had reason to sell assets, even in the absence of any capital gains tax effect. In addition, the elements of tax reform unfolded slowly over 1985 and 1986.’ The original tax reform proposal by the U.S. Treasury Department (1984) would have indexed capital gains for inflation. The plan passed by the House of Representatives on December 7, 1985, would have retained the partial exclusion from tax of long-term capital gains. It was not until April 24, 1986, that Senate Finance Committee Chairman Bob Packwood
National Tax Journal Vol. 47, no. 1, (March, 1994), pp. 1-18
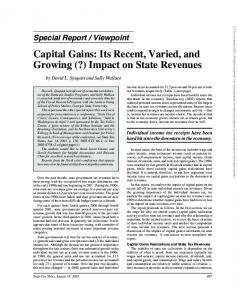
proposed that the exclusion for capital gains be repealed in exchange for a much lower tax rate on ordinary income (25 percent). Although that plan was retracted the next day, the Senate Finance Committee ultimately ratified a similar plan, with a 27 percent tax rate on capital gains and ordinary income, on May 7. The Senate overwhelmingly approved this plan, 97-3, on June 24, and realizations of capital gains surged in July and August of 1986. Long-term gains on stock more than tripled compared with the same period in the previous year (see Figure 1). In August 1986, longterm gains on stock were $16 billion, more than four times the level in 1985. The ultimate bill, with a top rate of 28 percent on capital gains, was passed by the House-Senate conference committee on August 16. The TRA was passed by the full House of Representatives on September 25 and by the Senate on September 27, 1986. President Reagan signed the bill on October 22, 1986. Realizations of capital gains declined from the summer levels until December, when gains shot up to seven times their 1985 level. As explained below, the rational behavior for investors was to wait until December to realize their capital gains so that as much gain as possible (assuming prices increase from August to December) could be taxed at the lower rate. Once the conference report reaffirmed that the effective date for the new tax rates would be January 1, 1987 (rather than the date on which the report was approved), taxpayers who planned to accelerate their realizations from future years could safely wait until the end of the year. In the fall, tax and investment advtsors were advising clients to sell by year’s end assets with low transaction costs that they did not intend to hold for long.6
1
Jan
Feb
l-R4 Chronology:
Bimbaum and Murray (1987)
Mar
stock
Apr
1985
May
1986
June
July
Cumulative
Month Percent v
October 22: hsident Reagan signs Tax Reform Act of 1986
Change
Sep
Ott
September 27: Senate passes bill, 74-23
August 16: Conference npolt approved with 28Y. rate on gains June 24: Senate passes bill with 27%
KeyEvtmtsin1986
May 7: Finance Committee approves plan unanimously
April 27: Senate Finance Committee Chairman Bob Packwood introduces tax reform plao with 27% tax rate on ordinary income and no capital gains exclusion
1. IRA and capital gains on corporate
Data: SO1 Saks of Capital Assets Panel
60
FIGURE
Dee
150
National Tax Journal Vol. 47, no. 1, (March, 1994), pp. 1-18
I
National Tax Journal Vol. 47, no. 1, (March, 1994), pp. 1-18
REALIZATIONS OF CAPITAL GAINS IN 1986
THE INCENTIVE TO SELL ASSETS IN 1986 The TRA of 1986 made the top statutory tax rate of 20 percent on long-term capital gains, which had applied from 1981 to 1986, a temporary tax rate in late 1986. Taxpayers could be expected to respond to the change in status as they would respond to a sale at a department store: some would accelerate their realizations of capital gains, as one might accelerate purchase of a refrigerator, to take advantage of the temporarily low price. A simple model illustrates how the pending tax-rate increase could accelerate realizations of assets with gains.7 We make two assumptions that will be relaxed later. Assume that the taxpayer does not plan to hold assets until death and that the taxpayer will have positive net capital gains for the year. To measure the incentive to sell, we calculate the change in terminal wealth position if the taxpayer holds a portfolio asset for N periods past 1986, compared with terminal wealth if the taxpayer sells the asset and purchases another with an equal holding period.8 If an asset worth one dollar in 1986 is held past 1986, then the after-tax value at the end of the holding period is
transaction costs minus tax on the net capital gain If the portfolio asset is sold in 1986 and the after-tax proceeds reinvested in another capital gains asset, the ultimate after-tax value of the investment would be
v, = [l - c - 7, (g - c)] [( 1 + fy( - T [(l
- T[(l
- c)
+ rJN(l
- c) - (1 - g)]
where r, is the future pre-tax rate of return on the portfolio asset, N is the holding period, c is transaction costs as a fraction of price, 7 is the post-l 986 tax rate on capital gains, and g is the capital gain as of 1986. Since the 1986 price is normalized at 1, 1 - g is the basis for the asset, so equation 1 says that the ultimate after-tax value of holding is the final price, (1 + r,)N, net of
- c) -
l]]
where T, is the (transitory) 1986 tax rate on capital gains and r, is the rate of return on the reinvested funds. The first bracketed expression in equation 2 is the after-tax proceeds of the 1986 sale (the basis for the newly purchased asset). The second expression is the after-tax return on the reinvested funds. The value of selling compared with holding is the difference between V, and V,,. This difference can be transformed into a slightly more tractable form by dividing through by (1 - ~)(l - c), which is a positive number and thus does not affect the sign. Define this indicator, A(T), as
I A(T) =
v, = (1 + r,)"(l
+ rJN(l
1 - c)
vs
(1 -
T)(l
vti
- C)‘
Substituting in from equations 1 and 2 and rearranging terms, the indicator can be rewritten as
q A(T) = [l - Ttg - c( 1 _ (, + ~ )” + d9
TJ](
1 + rJN
- CM
- 71)
1 (1
-
T)(l
-
C)
'
Note that A(TJ is a measure of the incentive to sell assets if the pre-TRA tax rate were permanent. If A(T) > A(TJ, the
National Tax Journal Vol. 47, no. 1, (March, 1994), pp. 1-18
incentive to sell assets increased of the TRA.
because
Not surprisingly, A generally increases with T, the new tax rate, for assets with posrtive gains net of transaction costs. The partial clerivative of A with respect to 7 is
II (1 -- TJ --itA := g - c 137 (1 - c) ;< (1
which is positive if g > c. This means that, for g :> c, the incentive to sell increases monotonically with 7 so that, as 7 increases from TV, A(T) > A(rrJ. However, with transaction costs, the incentive to sell does not necessarily increase for all assets with gains. If transaction costs, c, are higher than accrued gains, g, then A(T) C A(TJ for T > TV, so the taxpayer is better off waiting for the higher tax rate so that the deductible transaction costs are worth more. If the gain is large enough, the benefit of selling to take advantage of a temporarily low tax rate increases with the amount of alccrued gain. Transaction costs, however, reduce the incentive to sell. For assets with high transaction costs, the benefits from the temporarily low tax rate might not be enough to offset the additional transaction costs of selling to take advantage of that rate. Among asset sales reported on Schedule D and Form 4797, corporate stock has unusually low transaction costs because of the relative efficiency of the securities market. Othler assets, such as real estate, have much higher transaction costs. For example, Gr,avelle (1991) estimates that transaction costs average about 0.73 percent of value for corporate stock, but six percent for real estate. Equation 5 also shows that the incentive to sell is reversed if an asset has losses
(or gains srnaller than transaction costs). The TRA tax-rate increase gave taxpayers an additiorlal incentive to hold such assets in order to use the losses to shelter future higher-taxed gains or, up to the $3,000 limit, to offset ordinary income at the higher tax rate. Transaction costs increase this incentive to hold assets with losses. For taxpayers with net losses greater than $3,000, the incentive to sell assets with gains is generally smaller. Although the net losses could shelter a gain realized in 1986 and save the 20 percent tax, they could also shelter gains realized in later years that would be taxed at 28 percent if the losses are carried over. Unless the taxpayer expects to have net capital IOSS~ZSfor many years into the future, the incentive to sell will be smaller than it would be if the taxpayer were in a net gain position. More formally, if a taxpayer with large net losses realizes a gain net of transaction costs of g - c in 1986, the amount of carried-over losses is reduced by g c. Thus, If .the taxpayer generates sufficient gains, he will owe tax on g - c, say, s periods in the future.g The cost of the current gain is, therefore, (g - c)~(l + a)-‘, where 6 is the after-tax discount rate (or the after-tax rate of return on a reserve account for the expected tax liability s periods hence). Thus, the effective tax ratle on a current sale is
? = T(1 .t 6) -’ which reflects the opportunity cost of realizing a gain now in terms of lost future tax savings. The incentive to sell may be computed by substituting 7 for Tt in equation 4. Because ? depends only on the future (post-TRA) tax rate, 7, the TRA increases the effective tax rate on current sales for
I
National Tax Journal Vol. 47, no. 1, (March, 1994), pp. 1-18
REALIZATIONS OF CAPITAL GAINS IN 1986
taxpayers with net losses. There is no transitory effect, and the incentive to sell decreases compared with earlier years because higher tax rates raise the cost of selling. Thus, taxpayers with net losses should realize fewer capital gains than they would have in the absence of tax reform.
and the decline in realizations should be greatest in the final months of 1986. Finally, taxpayers should prefer to realize most assets that are sold in response to the TRA at the end of 1986 rather than earlier. By waiting until the end of the year, as much gain as possible is taxed at the lower pre-TRA tax rate. As long as a taxpayer expects a portfolio asset to appreciate at about the same rate as alternative assets, the asset should be held until the end of the year.
All of these predictions assume that the TRA would raise the marginal tax rate on long-term gains and losses realized after 1986, but this is not true for all assets. Assets that taxpayers planned to hold until death escape capital gains tax altogether and thus were not directly affected by the TRA.” There is no direct evidence on which assets fall into this category; however, it is reasonable to assume that older taxpayers would plan to hold a larger share of their assets until death than younger taxpayers. Thus, older taxpayers should be less responsive to the TRA than younger taxpayers.
sume that transaction costs are zero. Also, define the holding period, n, and the rates of return in terms of months. If the asset is sold in November, its value is V,,:
I VI, = (1 - g7J [(I
The incentives are reversed in the case of short-term capital gains and losses. For assets that could be sold short-term in both 1986 and 1987 (i.e., assets purchased after June 30, 1986), TV is 50 percent for top-bracket taxpayers, compared with a 7 of 28 percent. Thus, we would expect sales of assets with net short-term gains to decrease at the end of 1986, and sales of assets with shortterm losses to increase. This incentive is strongest at the end of 1986, when the cost of holding the asset for a few days until 1987 is minimal. For assets that would have been sold earlier in the year, the incentive to hold diminishes. For assets that would have long-term gains by January 1, 1987, the incentive to hold is reduced as compared with 1985, when assets held long-term qualified for a 20 percent rate. Thus, we would expect sales of assets with short-term gains to be deferred most for assets that would have been sold at the end of the year,
+ rJ(l
- 7) + 71.
If the asset is held one more month, until December, before sale, its terminal value will be VIZ:
q VI, = [I - g7t + h(l - 41 [(I + rz)“-‘(1 -
7) +
T].
After some algebraic manipulation, the difference between V,, and V,, (the gain from holding until December) may be written as:
VT,- v,, = (1+ rz)“-‘(1- 7) [f,(l -
rz(l
-
gTt)]
+
f,(l
-
-
Tr)
Tt)T.
If this expression is positive, holding until December will be optimal. The expression will be positive if 7
National Tax Journal Vol. 47, no. 1, (March, 1994), pp. 1-18
f-*(1 - g7J(l -t- f-J-'(1 r >p----' (1 - TJ [7. + (1 + r*y-'(1
- 7) - T)]'
In other words, if the return on the alternatlve asslet (TJ is not too much greater than the return on the portfolio asset (r,), and the holding period is not too long, then waiting until December will be optimal. If the alternative asset is expected to substantially outperform the portfolio asset, then the asset should be sold sooner. In summary, the lowrng hypotheses:
suggests
model
Sales of assets with large increased at the end of The increase with long-term other assets.
in sales gains
/Older younger
taxpayers were taxpayers.
Taxpayers with posite incentives gains. Taxpayers term gains short-term
net of
The on ers of tax we
SOCA
long-term at the
fol-
gains
than
stock for
gains end of
of corporate was smaller
stock than
112s~ responsive
than
losses had the taxpayers with
opnet
reduced realizations of shortand increased realizations of losses near the end of 1986.
The inducecl changes greatest at the end THE
long-term 1986.
Iof corporate was larger
Sales of assets with small or with losses decreased 1986. The reduction in sales with long-term losses for other assets.
the
in realizations of the year.
were
PANEL
SOCA panel includes detailed data taxable asset sales for 13,000 taxpaybeginning in 1985. The 501 division the IRS has completed SOCA files for years through ‘1989. For our analysis, had the 1985, 1986, and 1987 files.
The files oversample high-income taxpayers, so totals are weighted using inverse sample proportions to more closely represent the taxpayer population as a whole.” The SOCA panel includes data from Scheclule D (capttal gains and losses) and Form 4797 (gains and losses on business property such as real estate and equipment), and sales are categorized by type of asset based on the name reported next to each transaction. Table 1 surnmarizes tions and general payers with capital
the kinds of transaccharacteristics of taxgains in the SOCA
panel.” The table reflects the weighting toward high-income taxpayers in the SOCA sample. Nearly half of them reported a capital gain or loss, compared with about 1 1 percent of all taxpayers. The typical Schedule D in the panel reported about eight long-term gain transactions in ‘1985 and ten in 1986. For those taxpayers who reported a shortterm gain or loss, the average was 11 transactions in 1985, and 14 in 1986. The average taxpayer with long-term gains or losses had an adjusted gross income (AGI) of about $58,000 in 1985, and $68,000 in 1986. For taxpayers with short-term gains or losses, the averages were even higher: $79,000 in 1985 and $78,000 in 1986. The changes in AGI from 1985 to 1986 reflect the predicted increases in net long-term gains and decreases in Inet short-term gains. EVIDENCE
FROM
SOCA
Data from the SOCA files show how reported realizations of capital gains responded to the change in tax laws. We examine the data two different ways. We develop a simple regression model to see how realizations of capital gains and losses on corporate stock responded to the key legislative events in 1986, controlling for macroeconomic influences that also affect sales of stock. We also compare directly the behavior of taxpay-
I
National Tax Journal Vol. 47, no. 1, (March, 1994), pp. 1-18
REALIZATIONS OF CAPITAL GAINS IN 1986
SUMMARY
OF SCHEDULE
TABLE 1 D CAPITAL GAINS
Returns
Transactions (Unweighted) Number of transactions Gains Losses Total number of returns Number filing Schedule D Transactions per taxpayer Transactions per Schedule D
Unweighted Average Income Adjusted gross income (AGI) Taxable income Net capital gain/loss Total taxes paid
1986
with Short-Term Transactions
1985
1986
46,031 3 1,483 14,548 12,980 5,683
63,207 48,055 15,152 13,152 6,103
38,222 22,152 16,070 12,980 3,398
52,603 29,485 23,145 13,152 3,740
Taxes (Taxpayers $764,128 $757,587 $431,638 $389,062
ers in different circumstances before and after passage of the TRA. Evidence from both approaches is generally consistent with the theoretical predictions. Regression
Returns
1986
Taxes (Taxpayers $57,902 $45,285 $8,582 $13,916
and
LOSSES, 1985 AND
1985
3.55 8.10
Weighted Average Income and Adjusted gross income (AGI) Taxable income Net capital gain/loss Total taxes paid
AND
with Long-Term Transactions
Analysis
The TRA represented a dramatic economic event, the effects of which we can easily observe in the data on capital gains realizations. But realizations of capital gains are highly volatile, which raises the possibility that some, or even all, of the extraordinary movement in realizations might be a result of factors unrelated to the change in the taxation of capital gains. We try to control for the systematic non-tax factors that influence capital gains using macroeconomic data in a regression framework. Using the 1985-7 SOCA files, we created weekly time series of long- and short-term realizations of gains and losses on corporate stock. Henderson (1990) argued that macroeconomic information can affect trading volume for
4.81 10.36 with
Gains) $68,329 $54,639 $15,448 $17,550
with Gains) $844,071 $836,688 $575,023 $421,425
2.94 11.25
4.00 14.07
$78,584 $61,365 $15,037 $20,472
$77,595 $61,730 $20,213 $21,006
$903,274 $874,637 $543,951 $454,794
$1,048,852 $992,417 $718,814 $503,995
stocks if investors interpret that information differently. Through a specification search using realizations of long-term gains as the dependent variable, we found that a semilog model (log of gains as the dependent variable and levels of the macroeconomic variables as independent variables) could explain a significant fraction of the variation in long-term capital gains in 1985-7. We use as information variables a set similar to those chosen by Henderson (1990) and Slemrod (1982): the weekly average of the Standard and Poors Index of stock prices, the square of the difference between the high and low levels for that index over each week (a measure of stock price volatility), new claims for unemployment insurance, the interest rate on six-month Treasury Bills, the monthly consumer price index for the previous month, and the prior month’s index of leading indicators. We add dummies for January and December, as did the earlier studies, to test the hypothesis that gains would typically be deferred until January,
National Tax Journal Vol. 47, no. 1, (March, 1994), pp. 1-18
and losses typically accelerated to Dec:ember, as part of tax planning in normal years. To examine the effect of the TRA, we create durnmies for the interval between eac:h of the major legislative events: passage by the Senate Finance Committee, passage by the full Senate, approval of the Conference Report, and passage by the whole Congress.13 To examine year-end behavior, we include dummies for Novernber and December, 1986, and another dummy for January of 1987. If taxpayers were changing the timing of sales that they otherwise would have made at year end, then that would have a spillover (effect on realizations in the beginning of 1987. We also include a dummy for 1987, under the assumption that gains rnight have been reduced by the higher rates and the previous surge in realizations. To remove the effect of the October 1987 stock market crash, we exclude the fourth quarter of 1!387.14 The regression results for this specification are displayed In Table 2. The results for long-term gains suggest that people behaved just as the model predicts. Realizations were not significantly different from the norm until December of 1986, when they were five tirnes the norm.15 The response is small and insignificant between passage by the Senate Finance Committee and the end of the year, which suggests that the apparent surge in realizationlsN in the summer of 1986 may have been a result of other factors or a random fluctuation. Realizations are reduced, although not statistically significantly, in January 1987, which is also consistent with an acceleration of realizations into 1986.16 The coefficient on the 11987 dummy is small and statistically instgnificant, but has the expected sign. This might be consistent vvith a small elasticity of response to the tax increase in 1987, but it may also reflect other exogenous factors uncon-
trolled for n the small sample, or the anticipat:ed tax rate increase for taxpayers in the 33 percent bracket in 1988. Like Henderson (1990), we find that gains are significantly higher in January than during the rest. of the year, as expected. The point estimate also suggests that realrzations are higher in December, although this estimate is not statistically significant ‘at the five percent level. Henderson found a similar anomaly in some of her regressions. Because the sample period includes only two years of data for December, apparent seasonal patterns could be the result of unmeasured exogenous influences. For short-term gains (the second column of Table 2) the incentives during the TRA are reversed. Consistent with this prediction, the TRA dummies have negative coefficients, and they are large and statistically significant after the bill passed. The point estimate for December suggests’ thlat realizations of short-term gains dropped by 8:3 percent from the expected level in response to the TRA. The January and December dummies should havle the same signs (positive and negative, respectively) as for long-term gains. Once again, only the January effect is consistent with theory. The response of short-term gains in 1987 is small and statistically insignificant. The response of realizations of long-term losses to the TRA is shown in column 3 of Table 2. Long-term losses should have decreased at the end of 1986, but the only significant change (and only at the ten percent level) was after the bill was reported out of the Senate Finance Committee. Although the hypothesis that realizatrons of losses fell at the end of 1987 cannot be Irejected by the data, the results are not strongly consistent with the model either. These findings suggest that long-term losses are gov-
I
National Tax Journal Vol. 47, no. 1, (March, 1994), pp. 1-18
REALIZATIONS OF CAPITAL GAINS IN 1986
ORDINARY
TABLE 2 LEAST-SQUARES RESULTS (T-STATISTICS IN PARENTHESES) (WEEKLY DATA,JANUARY 1985-SEPTEMBER 1987)
S&P 500lndex Stock
price
0.118 (0.9) -0.198 (-1.7) 0.109 (1.9) 0.719
of Leading
TRA passes finance
0.405 (1.5) 0.237
Committee
TRA Conference
0.234
(0.8) Report
0.120 (0.4) -0.086 (-0.2) 0.503 (1.3) 1.60 (3.5) -0.549 (-1.4) -0.410 (-1.2) 23.8
TRA passes Congress November
1986
December
1986
January
1987
Dummy
for
1987
Intercept
(2.6)
F(16,125) R-squared Durbin-Watson statistic Number of observations
erned primarily the model.
(2.2)
0.726 (2.9) -0.180 (-0.7) -0.106 (-0.4) -0.540 (-1.9) -0.135 (-4.3) -0.853 (-2.5) -1.78 (-4.4) -0.034 (-0.1) 0.467 (1.5) 29.4 (3.6) 9.62 0.55 1.55
(0.8) TRA passes Senate
(1.6)
(2.8)
(3.8)
December
0.280
-0.005 (-1.0) -0.0008 (-0.8) 0.005 (0.7) 0.011 (0.1) 0.159 (0.9) 0.024 (0.3) 0.632
0.0008 (1 .a 0.007 (1.8) -0.037 (-0.3) -0.298 (-2.8) 0.141
(1.6)
CPI-U
Lagged Index Indicators January
0.005
(1.8)
-0.0005 (-0.7) 0.007
volatility
Claims for unemployment insurance Rate on 6-month T-bills Lagged
0.007
(2.2)
7.18 0.48 2.19
0.616 (1.5) -0.740 (-1.7) 0.055 (0.1) -0.260 (-0.5) 0.344 (0.7) -0.218 (-0.4) 0.491 (0.7) -0.094 (-0.2) -0.143 (-0.3) -3.41 (-0.3) 2.32 0.23 1.98
0.004 (1.5) -0.0001 (-0.2) -0.0009 (-0.2) -0.049 (-0.3) 0.271
(2.2)
-0.071 (-1.2) 0.027 (0.1) 0.017 (0.1) 0.121 (0.4) 0.835
(2.8)
1.20 (3.7) 1.144
(3.2)
0.662 (1.7) 0.846 (1 .a) 0.513 (1.3) 0.241 (0.7) -3.13 (-0.3) 8.25 0.51 1.98
= 150
by variables
outside
of
gress, which is unexpected, but there is a significant increase in the fall. The hypothesis that the response in the fall is zero can be rejected at the two percent level of significance.” There is no evidence of a seasonal pattern (January or December effects) in the data on shortterm losses.
The estimated response of short-term losses is shown in the last column. Losses would have been expected to increase in response to the TRA, and they did. All of the coefficients on the TRA dummies are positive, and most are statistically significant at the ten percent level or better. The estimated increase is largest between passage of the bill by the Senate and passage by the full Con-
Thus, the simple regression model is generally consistent with the predictions of theory, except in the case of longterm losses. 11
National Tax Journal Vol. 47, no. 1, (March, 1994), pp. 1-18
Gains and Losses at the End of 1986
a control. Thus, the more significant fact is that the decline in realizations was much grear:er at the end of the year than during the first nine months, rather than that realizations declined.
\Ne now examine the event of the TRA by looking at how different classes of taxpayers responded to the expected change in tax rates on capital gains. We begin by examining the data on sales of corporate stock, and conclude with a comparison to other assets that would be expected to be less responsive.
Realizations of long-term losses also increased at the end of 1986, by about 32 percent during the last quarter (see Table 3B). 13~ comparison, realizations of losses declined slightly during the rest of the year, probably because of the surging stock market. This pattern of response is inconsistent with the optimization model,, and is similar to the anomalous Inferences reported in Bolster, Lindsey, and Mitrusi (1989). The regression results in Table 2, however, suggest that these differences are not statistically significant.
Long- term capital gain.5 and losses on stock Table 3A shows that realizations of longterm capital gains on stock increased dramatically at the end of 1986, as predicted by the model.18 Long-term capital gains were 363 percent higher in the last quarter Iof 1986 than in the last quarter of 1985. Long-term capital gains in December were almost seven times their 1985 level, and six times the average for the rest of 1986. For the first nine months of the year, long-term gains were 74 percent higher in 1986 than 1985. Figure 1 suggests that this earlier increalse may reflect earlier developments in the legislative process, but the regression estimates reported in Table 2 suggest that the surge during the first nine months of 1986 may not be statistically significant when other factors are controlled for.
The model predicts that the ratio of average gain to sales price would be unusually high at the end of 1986, because the benefit of selling increases with g.“’ Tlqese expectations are confirmed in Table 4. The average gain/ sales-price incireased all year, because of the surging stock market and because some investors anticipated that the TRA would become law earlier, but the increase was much more pronounced at the end of the year. The gain/sales-price ratio increased by one-third, from 50 percent during the first nine months to 67 percent during the last quarter. In December, the ratio was 73 percent. By comparison, the ratio remained virtually constant at about 40 percent during 1985.
As expected, the response was reversed for ‘taxpayers with net losses. Long-term gains decreased by 63 percent in Dec:ember, compared with a nine percent decrease during the rest of the year. There is a potential simultaneity problem in interpreting the results for taxpayers with net losses, however. The analysis presented earlier suggests that being in a net loss position should discourage taxpayers from realizing capital gains. But it is also true that taxpayers who realize fewer gains are more likely to have net losses, aill other things being equal. We attempt to minimize this bias by using the first nine months of the year as
Short-term
capital gains and losses
As predicted, short-t:erm capital gains on stocks declined dramatically at year-end. Whereas realizations were 29 percent below 1985 levels in October 1986, they declined by 52 and 56 percent in November and December, respectively. By comparison, short-term gain realizations 12
I
National Tax Journal Vol. 47, no. 1, (March, 1994), pp. 1-18
REALIZATIONS OF CAPITAL GAINS IN 1986
LONG-TERM
GAINS Taxpayers
1985
TABLE 3 OR LOSSES ON STOCK (WEIGHTED, with Net Gain for Year
Taxpayers
Percent Change
1986
1985
for quarter for year year
Note:
for quarter for year year
OF DOLLARS) All Taxpayers 1985
1986
Percent Change
Gains
$3 225 $3’066 $6:454
!$;f $45:422
27 251 604
636 $129 $141
$65 $55 $52
81 -57 -63
$3,261 $3,195 $6,595
$4,164 $10,806 $45,474
28 238 590
$4,248
§20,090
373
$102
$57
-44
$4,350
$20,148
363
84,043 $54,111
$7,151 $139,190
77 157
$126 $1,471
$115 $1,216
-9 -17
64,169 $55,581
$7,226 $140,407
74 153
$838 $379 $2,024
121 -21 26
6. Long-Term October November December Average fourth Average rest of Total for
Percent Change
1986
A. Long-Term October November December Average fourth Average rest of Total for
IN MILLIONS
with Net Loss for Year
Losses
$191 6363 61,038
$516 $331 $1,335
170 -9 29
$188 $119 $565
$323 948 $690
72 -60 22
$379 6482 $1,602
$530
$727
37
$291
$353
22
6821
$236 63,868
6210 $4,386
-11 13
$261 $3,329
$247 $3,430
Monthly averages exclude transactions ardincluded in the totals.
GAIN/SALES-PRICE
-6 3
$498 $7,197
61,081
32
$457 $7,816
-8
for which the month of sale could not be determined.
FOR STOCKS WITH
TABLE 4 LONG-TERM
1985 (in Percent)
GAINS
9 transactions
OR LOSSES (ALL TAXPAYERS)
1986 (in Percent)
Percent
Change
October November December
41 41 38
39 60 73
-6 47 94
Fourth quarter Rest of year Total
40 40 41
67 50 59
70 26 42
Note:
for which to month of sale could not be determined.
Monthly data exclude transactions included in the total.
These transactions
are
Short-term losses were almost twice as high at the end of the year as during the first three quarters, and were more than twice their 1985 levels. For taxpayers in both net gain and net loss positions, short-term losses in the fourth quarter were about twice the level of the rest of 1986 and the prior year. Short-term losses decreased between October and December, however, for
during the rest of the year were 82 percent higher in 1986 than in 1985 (see Table 5A). Also as predicted, the pattern is stronger for taxpayers with net gains for the year. Table 5B shows that realizations of short-term losses also generally conform with the model, although the evidence is somewhat more difficult to interpret. 13
National Tax Journal Vol. 47, no. 1, (March, 1994), pp. 1-18
SHORT-TERM
GAlNS Taxpayers
1985
TABLE 5 OR LOSSES ON STOCK (WEIGHTED, with Net Gain for Year 1986
Percent Change
Taxpayers 1985
A. Short-Term October November December Average fourth Average rert of Total for
for quarter for year year
Note:
for quarter for year year
---~--Age of Principal Taxpayer --~35 and under 36-55 56-65 Over 65 All taxpayers Note:
All Taxpayers
--‘I985
1986
Percent Change
$208 $443 $447
$125 $204 $187
-40 -54 -58
815
$34. $12 $34.
132 32 -34
$223 $452 $499
$159 $216 $221
-29 -52 -56
$336
$172
-53
$25
$27
6
8.391
$199
-49
$222 $3,199
8371 $4,034
836 $410
$97 $953
172 132
$257 $3,609
$468 $4,987
82 38
67 26
Losses
$133 $134 $,I96
$442 $237 $298
233 77 52
$36 $89 $45
$46 $105 $205
26 I9 356
$169 $223 $241
$488 $342 $503
188 54 109
$154
$326
111
957
$119
110
$211
$445
III
$92 81,357
$162 $2,716
76 100
$22 $400
864 $940
190 135
$114 81,757
$226 $3,656
Monthly averages exclude transactions are included in the totals.
DISTRIBUTIION
OF DOLLARS)
Gains
B. Short-Term October November December Average fourth Average rest of Total for
IN MILLIONS
with Net Loss for Year --Percent 1986 Change
for which
the month
of sale could not be determined.
98 108
These trfnsactions
TABLE 6 OF LONG-TERM CAPITAL GAINS ON CORPORATE STOCK BY AGE OF PRINCIPAL TAXPAYER (WEIGHTED, IN MILLIONS OF DOLLARS) _._~ Average for Fourth Quarter Average for Rest of Year --Percent Percent 1985 1986 Change 1985 1986 Change -. _~_____ $204 $1,877 822 $325 $449 38 $1,568 $9,287 492 $1,428 $2,240 57 $974 $4,896 403 $1,119 $1,603 43 $1,606 $4,088 155 $1,297 $2,973 129 $4,350 $20,148 363 $4,169 $7,266 74
Excludes transactions
for which the month
of sale could not be determined,
taxpayers with net gains for the year, whereas they increased for taxpayers with net lossles. This may be a symptom of the simukaneity problem discussed in the case of long-term losses, or it may be owing to the fact that, on the margin, short-term losses are applied against net long-term gains for taxpayers who have net long-term gains in excess of net short-term losses. Thus, for taxpayers with more long-term gains than short-
term losses, the effective top tax rate on short-term losses was 20 percent in 1986 rather than 50 percent. These taxpayers had an incentive to hold off realizing their short-term losses until longterm tax rates increased in 1986. Variation
by age
Because the tax treatment at death is unchanged, we would expect older people to be less resporlsive than younger 14
I
National Tax Journal Vol. 47, no. 1, (March, 1994), pp. 1-18
REALIZATIONS OF CAPITAL GAINS IN 1986
CAPITAL
GAINS
ON DEPRECIABLE Taxpayers
October November December Average fourth Average rest of Total for Note:
for quarter for year year
TABLE 7 BUSINESS PROPERTY
with Net Gain for Year
Taxpayers
Percent Change
(WEIGHTED,
1985
1986
$1,802 $1,722 $1,603
$1,165 $1,096 $4,239
-35 -36 164
$2:
::
$165
$1,709
$2,166
27
$78
$1,736 $35,540
$1,537 $45,198
Monthlv averages exclude transactions are inckded inthe total.
1985
IN MILLIONS
with Net Loss for Year 1986
Percent Change
OF DOLLARS)
All Taxpayers Percent Change
1985
1986
$31
-53 -90 -81
$1,811 $1,782 $1,768
$1,169 $1,102 $4,270
-35 -38 142
$14
-82
$1,787
$2,180
22
-32 -25
$1,849 $37,270
$1,614 $46,492
-13 25
for which the month of sale could not be determined.
These transactions
certain kinds of investments. The net effect of all of these factors is unclear.
people.2o This pattern is evident in Table 6. The year-over-year increase in realizations of long-term capital gains by taxpayers in the fourth quarter of 1986 decreases steadily with age, falling from 822 percent for taxpayers 35 and under, to 155 percent for taxpayers over 65. During the rest of the year the pattern of change was reversed, with the elderly showing the greatest change between 1985 and 1986, although the differences are much less marked.2’
Table 7 shows that, based on transaction data from Form 4797, sales of business property increased by 22 percent during the last quarter of 1986, compared with a decline of 13 percent during the rest of the year. This response is much smaller than was observed for corporate stock. These results are consistent with our predictions about the effects of transaction costs. Also, as predicted, the pattern is reversed for taxpayers with net losses.
Sales of Business Property Business property faces much higher transaction costs, and thus the TRA’s capital gains tax provision created less of an incentive to sell such assets. In addition, the TRA did not represent as controlled an experiment for business property, because at the same time as tax rates on capital gains were increased, the TRA affected the incentive to hold business property through numerous provisions, including the passive activity loss limitations, which penalized tax-shelter partnerships and real estate, changes in the treatment of business investment generally through repeal of the investment tax credit, and changes in depreciation schedules. In addition, the lowering of marginal tax rates on ordinary income affected the incentive to make
Conclusions The data suggest that taxpayers responded dramatically to the short-run incentives created at the end of 1986 by the TRA. Realizations of capital gains were remarkably consistent with the predictions of the simple theoretical model. First, sales of assets with long-term gains increased substantially at the end of 1986. Second, corporate stock was much more responsive than other assets with higher transaction costs. For corporate stock, realizations of long-term capital gains in December 1986 were seven times their level in 1985; for other assets, the ratio was about 2.4 to 1. Third, older taxpayers were less responsive to 15
National Tax Journal Vol. 47, no. 1, (March, 1994), pp. 1-18 capital gains was capped at 28 percent for one year. In 1988 the top effective rate on capital gains was 33 percent because of the phaseout of personal exemptions and the standard deduction. The Omnibus Budget Reconciliation Act of 1990 reinstated the 28 percent cap on capital gains lax rates. A referee pointed out that leveling the playing field fol different assets and reducing marginal tax rates on individuals would have been expected to increase some asset values. Thus, the overall effect on asset values is unclear. It seems reasonable, nonetheless, that these complex changes could have altered many investors’ perceptions of investment opportunities in the market. See Birnb;lum and Murray (1987) See, for example, Cooperman and Dudley (1986) dnd Sanders (1986). This model expands a rnodel developed in Congressional Budget Office (1991) to include transactlon costs. The CBO study, however, considers nany alternative trading strategies. Bolster, Lindsey, and Mitrusi (1989) used a similar model.
the tax change than younger taxpayers, since older taxpayers are more able to escape capital gains taxation entirely. Fourth, short-term capital gains on stocks declined markedly at year-end. Finally, taxpayers with net losses faced the opposite incentives of laxpayers with net gains, and responded accordingly. The dramatic response of taxpayers to ihe conversion of 21 “permanent” 20 percent tax rate on long-term capital gains into a “transitory” 20 percent rate is consistent with the evidence reported by t3urman and Randolph (1994) that the elasticity of response of taxpayers to transitory vat-nations in capital gains tax rates is an order of magnitude greater than the response to permanent variations. Our results provide further reason to question the high capital gains elasticity estimates frorn cross-section studies that do not distinguish transitory from permanent effects. Although our data included much more detail about individuals’ transactions than previous studies of tax reform, our analysis was limited by only having three years of data Analysis Df SOCA studies for later years might provide more precise statisticcll tests of the behavior we were able to explain, as well as shed light on the anomalous behavior with respect to long-term capital losses.
9
10
ENDNOTES
11
We received helpful comments from Rosemary Marcuss, Larry Ozanne, Joel Slemrod, and participants in the Tax Economists’ Forum. The suggestions of three referees and the editor significantly improved the paper. Matt Melillo [provided key technical assistance at a crucial point. Our views do not necessarily reflect the positions of our institutions. Slemrod and Shobe (1990) and Auten and Clotfelter (1982) also report evidence that responses to transitory changes in tax rates are larger than responses to permanent changes ;’ Changes in tax rates were phased In over two years. The top rate on ordinary income was 37.5 percent in 1987 and the tax rate on
12
13 14
16
We asscime that the assets would be held past 1986 because the TRA did not change the tax treatment of assets bought and sold tn 1986 We assume equal holding periods to simplify the algebra. All of the qualitative results are the same if the assets have different holding periods, except in the special case where an asset would be held until death. This case is considered later. The losses may be used over a number of periods, ot c’zurse, but the basic analysis is unchanged. In other words, T is zero before and after passage ol’ the TRA for taxpayers who plan to hold until death. See Appendix for a description of the construction and weighting of the SOCA file. Spreadsheets containing the data reported in the tables as well as some additional detail are available from the authors. See Figure 1 for the (dates of these events. The first specification that we tried included all of 1987 with a dummy for the week after the stock market crash, and the dependent variable lagged one year to try to capture seasondi patterns in capital gains realtzations. This was the specification we used to select the form of the function and the macroeconomic variables. The lagged dependent variable was only statistically significant at the five percent level in the equation for long-
I
National Tax Journal Vol. 47, no. 1, (March, 1994), pp. 1-18
REALIZATIONS OF CAPITAL GAINS IN 1986
term losses, and exacted a high cost in terms of our limited data; one-third of the observations had to be excluded to use the lagged variable. In addition, we were concerned that the response of taxpayers to the stock market crash in October, 1987, could not be adequately controlled for with a single dummy. Although the point estimates that we report below are somewhat more consistent with the theoretical predictions, all of the specifications we tried show increases in long-term gains and short-term losses and decreases in short-term gains at the end of 1986. No specification showed a significant response of long-term losses. We also produced estimates using a robust regression routine in Stata that reduces the influence of outliers (of which there are many in our data). These estimates were not significantly different from the OLS estimates that are shown in Table 2. l5 The incremental effect of a dummy on the level of the dependent variable is estimated by the exponent of its coefficient, p. The effect is multiplicative because the dependent variable is in logarithms. Thus, if p is zero, there is no incremental effect, because e” equals one. The coefficient of 1.6 on the December dummy thus implies that gains are e ’ 6, or 4.95, times the level in other months. l6 The total measured effect in January, 1987 relative to January, 1985 and 1986 is represented by the sum of the coefficients of the dummy for January, 1987 and the dummy for all of 1987. This sum is negative and statistically significant at the five percent level.
APPENDIX THE SOCA PANEL
The 1985 SOCA study is a subsample of approxlmately 55,000 indlvlduals chosen randomly from the large stratified sample of 121,418 taxpayers comprising the 1985 individual 501. Information on the capital transactions of these taxpayers was collected from supporting schedules accompanying each return. Data were gathered from Schedule D (Capital Gains and Losses), Form 4797 (Property Used in a Trade or Business), Form 6252 (Installment Sales), and Form 2 119 (Sales of a Personal Residence). Sample weights were calculated based on the population counts for each stratum. Holik, Hostetter, and Labate (1989) describe the data in more detail A subsample of the SOCA of approximately 13,000 taxpayers was chosen to be part of an ongoing panel. Taxpayers were included In the panel based on an algorithm described In Mulvey (1980). The algorithm chooses the sample that is most representative of the population, measured In terms of certain key income and demographic variables. It produces
sample weights from which population estimates can be obtained. Because the panel has a static population of potential members (tax filers in 1985), It will tend to become less representative of the population
over time. In addition,
because
selection
In the sample is based on Income in 1985, taxpayers with high transitory incomes In 1985 are overrepresented and taxpayers with low transitory In-
l7 The F-statistic for the joint hypothesis that the coefficients on the last three 1986 dummies are zero is F(3,125) = 3.62. ‘* We produced a similar table, which is not shown, for the value of the stocks sold, rather than the capital gains. The results are qualitatively identical. ” The average gain/sales-price is the weighted sum of capital gains divided by the weighted sum of sales prices. *’ There might also be age-related differences in preferences that could explain this pattern. 21 We also looked for systematic differences by income levels, under the hypothesis that higher-income taxpayers faced the largest increases in the tax rate on long-term capital gains and may also have been more aware of the tax incentives than the rest of the population. Although the highest-income people increased their realizations by a much larger percentage than the rest of the sample, there was a lot of seemingly random variation in the percentage among income brackets.
comes are underrepresented.
For each asset sale, data are coded on the type of asset, purchase and sale dates, purchase and sale prices, and accumulated
depreciation
for depreciable
assets In addition, tax status, Income, and deduction Items in the 501, such as filing status, adjusted gross Income, taxable income, interest, dividends, net capital gains and losses, and deductions for charitable contributions, state and local taxes, and home mortgage interest, are Included. The ages of pnnclpal taxpayers and their spouses are matched records.
to the SOCA from
Social Security
REFERENCES Auten, Gerald E. and Charles T. Clotfelter. “Permanent Versus Transitory Effects and the Realization of Capttal Gains.” Quarterly /ourna/ of Economics 97 (November, 1982): 613-32. Birnbaum, Jeffrey H. and Alan S. Murray. 17
National Tax Journal Vol. 47, no. 1, (March, 1994), pp. 1-18
S;howdown at ~Wucci Gulch. New York: Random House, Inc., 1987. Bolster, Paul Jl., Lawrence B. Lindsey, and Andrew Mitrusi. “Tax-Induced Trading: The Effect of the 1986 Tax Reform Act on Stock Market Activity.” The /ouma/ of Finance 44 (June, 1989): 327-44.. Burman, Leonard E. and William C. Randolph. “Measuring Permanent Responses to Capital Gains Tax Changes in Panel Data.” American Economic Review, 1994, forthcoming. Cooperman, Leon G., and William C. Dudley, “To Sell or Not to Sell (Before Yearend)?“, Goldman Sachs Pon’folio Strategy (September 4, 1986). Congressional Budget Off ice, Capital Gains Taxes in the Short Run, Washington, D.C.: U.S. Government Printing Office, August, 1991. Gravelle, Jane G. “Limits to Capital Gains Feedback Effects.” Congressionar’ Research Service Report 91-250RCO. Washington, D.C., March, 1991. Henderson, Yolanda K. “Capital Gains Tax
Rates and Stock Market Volume.” National Tax lournal43 (December, 1990): 41 l-23. Holik, David, Susan Hostetter, and John Labate. “Sales of Capital Assets.” American Statistical Association Proceedings of the Section on Survey Research Methods, (1989). August, 1989. the U.S. Taxpayer Mulvey, Johin M. “Reducing Database by Optimization.” Interfaces 10 (1980). Sanders, Hy. “Capital Gains Strategies for 1986.” Tax /votes (November 10, 1986): 57984. Slemrod, Joel. “Stock Transactions Volume and the 1978 Capital Gains ‘Tax Reduction.” Public Finance Quari!er/y 10 (January, 1982): 3-l 6. Slemrod, Joel and William Shobe. “The Tax Elasticity of Capital Gains Realizations: Evidence from a Panel of Taxpayers.” Working Paper No. 3237, National Bureau of Economic Research, January, 1990. U.S. Department of the Treasury. Tax Reform for Fairness, Simplicity, and Economic Growth. Washington, D.C.: U.S. Government Printing Office, November, 1984.
18