Oct 6, 2011 - Fabry, V. J., J. B. McClintock, J. T. Mathis, and J. M. Grebmeier (2009),. Ocean acidification at high ... 1177â1212, John. Wiley, New York.
GEOPHYSICAL RESEARCH LETTERS, VOL. 38, L19602, doi:10.1029/2011GL048884, 2011
The role of ocean acidification in systemic carbonate mineral suppression in the Bering Sea Jeremy T. Mathis,1 Jessica N. Cross,1 and Nicholas R. Bates2 Received 15 July 2011; revised 30 August 2011; accepted 2 September 2011; published 6 October 2011.
[1] Ocean acidification driven by absorption of anthropogenic carbon dioxide (CO2) from the atmosphere is now recognized as a systemic, global process that could threaten diverse marine ecosystems and a number of commercially important species. The change in calcium carbonate (CaCO3) mineral saturation states (W) brought on by the reduction of seawater pH is most pronounced in high latitude regions where unique biogeochemical processes create an environment more susceptible to the suppression of W values for aragonite and calcite, which are critical to shell building organisms. New observations from the eastern Bering Sea shelf show that remineralization of organic matter exported from surface waters rapidly increases bottom water CO2 concentrations over the shelf in summer and fall, suppressing W values. The removal of CO2 from surface waters by high rates of phytoplankton primary production increases W values between spring and summer, but these increases are partly counteracted by mixing with sea ice melt water and terrestrial river runoff that have low W values. While these environmental processes play an important role in creating seasonally low saturation states, ocean uptake of anthropogenic CO2 has shifted W values for aragonite to below the saturation horizon in broad regions across the shelf for at least several months each year. Furthermore, we also report that calcite became undersaturated in September of 2009 in the bottom waters over the shelf. The reduction in CaCO3 mineral saturation states could have profound implications for several keystone calcifying species in the Bering Sea, particularly the commercially important crab fisheries. Citation: Mathis, J. T., J. N. Cross, and N. R. Bates (2011), The role of ocean acidification in systemic carbonate mineral suppression in the Bering Sea, Geophys. Res. Lett., 38, L19602, doi:10.1029/2011GL048884.
1. Introduction [2] It has been widely shown that the uptake of anthropogenic CO2 by the oceans [Sabine et al., 2004; Sabine and Feely, 2007] has a significant effect on marine biogeochemistry by reducing seawater pH [Feely et al., 2009; Caldeira and Wickett, 2003] and the saturation states (W) of important calcium carbonate (CaCO3) minerals [Feely et al., 2004; Orr et al., 2005; Caldeira and Wickett, 2005] through a process termed ocean acidification. Seawater exhibiting undersaturated conditions (i.e., W < 1) is potentially corrosive for biogenic CaCO3 minerals such as aragonite, calcite 1 School of Fisheries and Ocean Sciences, University of Alaska Fairbanks, Fairbanks, Alaska, USA. 2 Bermuda Institute of Ocean Sciences, Ferry Reach, Bermuda, UK.
Copyright 2011 by the American Geophysical Union. 0094‐8276/11/2011GL048884
and high‐Mg calcite. The reduction of CaCO3 mineral saturation states in the surface ocean and along continental margins could have potentially negative consequences for benthic and pelagic calcifying organisms, and entire marine ecosystems [Fabry et al., 2008; Feely et al., 2010]. Of even greater concern is the rate at which ocean acidification and CaCO3 mineral saturation state suppression are progressing, particularly in the high latitude regions of the North Pacific Ocean [Byrne et al., 2010; Fabry et al., 2009] where mixing processes and colder temperatures naturally precondition the water column to have lower pH and W values compared to more temperate ocean environments. [3] Recent observations in the sub‐arctic North Pacific Ocean [Mathis et al., 2011] have already revealed areas of seasonal CaCO3 mineral W suppression. Aragonite undersaturation has been observed throughout the water column, while models project widening areas of aragonite undersaturation in the region during the next several decades [Steinacher et al., 2009]. This has potentially negative consequences for the region because the expansive continental shelf of the eastern Bering Sea sustains a commercially valuable fishery [Cooley and Doney, 2009; Cooley et al., 2009] that produces approximately 47% of the US fish catch by weight. This marine ecosystem is critical to both the regional and national economy as well as subsistence communities in Alaska who rely heavily on the seasonal fish catch as their primary source of protein. These new findings show that the eastern Bering Sea will likely be one of the first ocean acidification impact zones for US national interests. Therefore, it is critical to gain a better understanding of both the natural and anthropogenic controls on CaCO3 mineral suppression in the region. [4] On the eastern Bering Sea shelf, a seasonal divergence in pH and W is observed between surface and subsurface waters, driven primarily by the biology of the system. During the spring phytoplankton bloom, high rates of NCP effectively remove CO2 from the surface waters creating a strong seasonal disequilibrium with the atmosphere [Bates et al., 2011], but also increasing pH and W values by ∼0.1 and ∼1 respectively [Mathis et al., 2011]. The vertical export of organic matter and its subsequent seasonal remineralization at depth, induces a significant build‐up of CO2 in bottom waters (i.e. pCO2 increases) and concurrent suppression of CaCO3 mineral W values. The seasonal divergence of pH and W in surface and subsurface waters has been described in terms of a “Phytoplankton‐Carbonate Saturation State” (PhyCaSS) Interaction where significant interaction and feedback between ocean biology and seawater carbonate chemistry occurs. This process has been observed in the Chukchi Sea [Bates et al., 2009; Bates and Mathis, 2009], and is likely a typical feature of highly productive polar and sub‐polar shelves. In 2008, subsurface waters of the eastern Bering Sea
L19602
1 of 6
L19602
MATHIS ET AL.: OCEAN ACIDIFICATION IN THE BERING SEA
L19602
Figure 1. Generalized description of the processes affecting the carbonate chemistry of the eastern Bering Sea shelf. The influx of runoff from the coast delivers water with high pCO2, low TA, and moderate concentrations of dissolved organic matter (OM). The high pCO2 of the water creates a seasonal source of CO2 to the atmosphere while reducing carbonate mineral saturation states. Offshore, the upper water column is dominated by sea ice melt in late spring and summer that creates a highly stratified surface layer where primary production is controlled by the confluence of coastal waters rich in micronutrients and basin water replete in macronutrients. Seasonally high rates of NCP lead to a rapid drawdown of CO2 at the surface creating a strong seasonal sink for atmospheric CO2. In 2009, a coccolithophore (Cocc.) bloom was observed in the intermediate shelf waters and lowered TA concentrations at the surface. The varying degree of export production at the surface determined the amount of remineralization that occurred at depth which ultimately controlled saturation states. This PhyCaSS interaction can be observed to varying degrees across the shelf. shelf became undersaturated with respect to aragonite (but not calcite) [Mathis et al., 2011]. It has also been shown that the addition of anthropogenic CO2 to the ocean augments this natural seasonal interaction between ocean biology and seawater carbonate chemistry, tipping subsurface waters below the saturation state threshold (Waragonite = 1) for aragonite [Mathis et al., 2011]. In this paper, we show that subsurface waters of the eastern Bering Sea shelf in 2009 exhibits a greater degree of undersaturation than previous years, becoming nearly undersaturated with respect to calcite in addition to aragonite. We use these observations to illustrate how both natural and anthropogenic processes control W, and how increasing levels of atmospheric CO2 could push the Bering Sea closer to a tipping point that could be detrimental for calcifying organisms.
2. Methods [5] Seasonal dissolved inorganic carbon (DIC) and total alkalinity (TA) measurements were made along two east‐ west transects (see Figure S1 in the auxiliary material)1 over the shelf during spring (April/May), summer (July), and fall (September) cruises in the eastern Bering Sea in 2009 as part of the Bering Ecosystem Study (BEST) project. Samples were collected with 10 m resolution from the surface to 50 m, with 25 m resolution from 50 m to 100 m, and with 50 m resolution from 100 m to 300 m. Conductivity‐temperature‐ depth samples were collected by the NOAA Eco‐Foci group on downcasts with a Seabird 911‐plus system using dual temperature, conductivity, and oxygen sensors. Both salinity and Winkler oxygen calibrations were performed in post‐ processing. Nutrient samples for phosphate and silicate were also provided by the Eco‐Foci group, with sample collection 1 Auxiliary materials are available in the HTML. doi:10.1029/ 2011GL048884.
and analysis performed according to the protocols of Gordon et al. [1993]. [6] Seawater samples for DIC and TA were drawn from Niskin bottles into pre‐cleaned ∼300 mL borosilicate bottles and poisoned with mercuric chloride (HgCl2) to halt biological activity. Samples were analyzed using a highly precise and accurate gas extraction/coulometric detection system [Bates, 2001]. The analytical system consists of a VINDTA 3C (Versatile Instrument for the Detection of Total Alkalinity) coupled to a CO2 coulometer. TA samples were determined by potentiometric titration using the VINDTA 3C. Routine analyses of Certified Reference Materials (CRMs, provided by A.G. Dickson, Scripps Institution of Oceanography) ensured that the accuracy of the DIC and TA measurements were within 0.08% (∼1.5 mmoles kg−1) and stable over time. Seawater CaCO3 saturation states for calcite (Wcalcite) and aragonite (Waragonite) were calculated with CO2SYS version 1.05 from DIC, TA, temperature, salinity, phosphate, and silicate data using the thermodynamic model of Lewis and Wallace [1995], using the borate dissociation constant of Dickson [1990]; the silicate and phosphate dissociation constants of Dickson and Goyet [1994]; the carbonic acid dissociation constants of Mehrbach et al. [1973] as refit by Dickson and Millero [1987]; and the CO2 solubility equations of Weiss [1974]. Uncertainty in the calculation of Wcalcite and Waragonite were ∼0.02. [7] Sea ice cores were collected at seven locations across the Bering Sea shelf during the spring cruise. Cores were partitioned into 10 cm sections. Until analysis, these cores were kept frozen. For analysis, cores were allowed to thaw and meltwater was transferred into borosilicate bottles, poisoned with HgCl2 and analyzed from DIC and TA as above. [8] Satellite True‐color images were created from Modis Aqua Level 0 files which were downloaded from NASA’s ocean color website (oceancolor.gsfc.nasa.gov). They were
2 of 6
L19602
MATHIS ET AL.: OCEAN ACIDIFICATION IN THE BERING SEA
L19602
Figure 2. Scatter plots of (a–c) normalized total alkalinity (nAlk) and normalized DIC (nDIC) by depth (color) with aragonite saturation states (Warag) and (d–f) pH contours in spring (Figures 2a and 2d), summer (Figures 2b and 2e) and fall (Figures 2c and 2f) of 2009. The dashed contour lines indicate undersaturation of aragonite minerals. Vectors indicate the relative influences of phytoplankton primary production (P), remineralization (R), and calcification (C) on the dispersion of the data points. Between spring and summer, DIC drawdown in the surface layer and remineralization in subsurface waters greatly increased the dispersion along the x‐axis. A wider range of Warag and pH observations indicated the influence of the PhyCaSS Interaction. Between spring and fall, increases in DIC from air‐sea exchange and vertical diffusion decreased Warag and pH throughout the water column, and a higher frequency of bottom water undersaturations were observed relative to spring and summer. Also apparent in fall was the cumulative effects of the coccolithophore bloom, which decreased alkalinity values, particularly in surface waters. processed using SeaDAS, a software package available through the same site.
3. Controls on Carbonate Mineral Saturation States [9] The degree to which the CaCO3 mineral concentrations changed throughout 2009 at the surface and in the bottom waters of the eastern Bering Sea were related to several natural processes (Figure 1). In near‐shore surface waters, CaCO3 mineral W values are influenced by river runoff that has a high partial pressure of CO2 (pCO2) and low TA [Mathis et al., 2011; Striegl et al., 2007; Pan‐Arctic River Transport of Nutrients, Organic Matter, and Suspended Sediments Project Arctic River biogeochemistry data set, 2010, unpublished raw data, http://arcticgreatrivers. org/data.html#Datadownload], which effectively suppresses W. This effect is particularly pronounced in late spring and summer when discharge is at its peak. Over the middle and outer shelf, seasonal sea ice melt, which is low in carbonate ion concentrations due to brine rejection also acts to decrease W values [Mathis et al., 2011]. Additionally, intermittent blooms of coccolithophores, which were observed during the summer of 2009 (Figures S1 and S2), also reduce TA, increase pCO2 and lower W Values. In contrast, the rapid and in some locations extensive drawdown of DIC within the mixed layer due to phytoplankton primary production compensates for most of the CaCO3 mineral suppression and increases pH between spring and summer, thus driving W values higher near the surface [Mathis et al., 2011] (Figure 2). This is particularly true in the highly productive “green belt” (Figure S1) where large
particles are exported from surface to bottom waters, thereby rapidly transferring organic matter to depth. [10] The remineralization of organic matter in the water column and sediment rapidly increased DIC concentrations in bottom waters between summer and fall of 2009, depressing CaCO3 mineral W values. This process imparts a divergent trajectory for W in bottom waters compared to the surface (Figure 2). Because of horizontal stratification, DIC from remineralization of organic matter accumulated in bottom waters, and subsequently depressed CaCO3 mineral W values to a state of undersaturation (particularly for aragonite). These conditions were maintained until surface cooling, deep mixing events and the production of brine from ice formation that occurs late in the fall mix the water column and create more uniform concentrations of DIC and W. [11] TA was removed from the mixed layer in significant quantities in 2009 (Figure 2). Between spring and summer, TA concentrations along the SL line decreased nearly twice as much (∼100 mmoles kg−1) as along the MN line (∼50 mmoles kg−1). As in 2008, a large portion of this drawdown was due to dilution from ice melt and river runoff [Mathis et al., 2011], but given the much larger decreases in 2009 and the deeper penetrations of TA removal in the mixed layer, we estimate that coccolithophores were likely responsible for ∼50% of the decrease in TA. Accordingly, the highest drawdown of TA corresponded to SeaWiFS satellite images that showed the locations of the coccolithophore blooms (Figure S2). Lower concentrations (relative to spring values) of TA persisted into the fall since there were no immediate sources of alkalinity to the shelf due to carbonate‐ poor drainage basins in western Alaska [Brabets et al., 2000; Mathis et al., 2011]. The low alkalinity conditions were likely
3 of 6
L19602
MATHIS ET AL.: OCEAN ACIDIFICATION IN THE BERING SEA
L19602
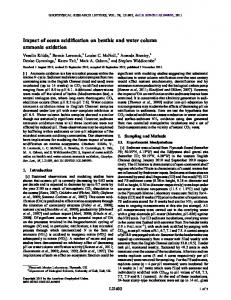
Figure 3. Observations of aragonite (shown in color) and calcite (shown with black contour lines) saturation states (W) along the MN and SL transects lines in summer and fall of 2009. The dashed contour line indicates the location of waters undersaturated in calcite. sustained until winter mixing brought bottom waters with higher TA concentrations to the surface. [12] Observations along the SL line in spring showed that both aragonite and calcite were supersaturated in the water column with fairly uniform distributions (Waragonite ∼1.5 and Wcalcite ∼2.5) from the surface to the bottom. Over the outer shelf, the saturation states of both aragonite and calcite were lower, with aragonite being undersaturated at a depths >60 m. The lower saturation states near the shelf‐break were likely due to the influence of deeper Bering Sea water with higher DIC concentrations [Mathis et al., 2011]. Along the MN line, W values were again fairly uniform throughout the water column at ∼1.5 and ∼2.5, respectively for Warg and Wcal over the entire shelf. [13] Between spring and summer, there were a number of important changes along both transects as the water column horizontally stratified and primary production dominated W in the mixed layer [Cross et al., 2011]. Along the MN line in summer, Waragonite and Wcalcite values increased in offshore surface waters, particularly in the region of the “green belt” where DIC drawdown was highest. Beneath this layer though, high rates of export production and the remineralization of organic matter [Cross et al., 2011] suppressed W causing aragonite to be at or below 1.0, while Wcalcite < 2.0 (Figure 3) over nearly the entire shelf from ∼50 m to the bottom. Nearshore waters (∼0–40 m) had higher W, likely due to limited phytoplankton primary production/export production in response to lower macronutrient concentrations. [14] Between summer and fall, W values in the surface waters along the MN line decreased (Figure 3) in response to CO2 uptake from the atmosphere and some remineralization, which increased DIC concentrations, returning W values closer to pre‐bloom levels. The suppression of CaCO3 mineral saturation continued below 50 m as remineralization contributed more DIC to the water column. Aragonite became highly undersaturated (