Jun 25, 2012 - arXiv:1206.5680v1 [cond-mat.mes-hall] 25 Jun 2012. Understanding ... magnetization dynamics takes place in a very confined region where ...
Understanding nanoscale temperature gradients in magnetic nanocontacts S. Petit-Watelot,1, 2 R. M. Otxoa,1, 2 M. Manfrini,3 W. Van Roy,3 L. Lagae,3, 4 J-V. Kim,1, 2 and T. Devolder1, 2
arXiv:1206.5680v1 [cond-mat.mes-hall] 25 Jun 2012
1
Institut d’Electronique Fondamentale, Universit´e Paris-Sud, 91405 Orsay , France 2 UMR 8622, CNRS, 91405 Orsay, France 3 IMEC, Kapeldreef 75, B-3001 Leuven, Belgium 4 Laboratorium voor Vaste-Stoffysica en Magnetisme, K. U. Leuven, Celestijnenlaan 200 D, B-3001 Leuven, Belgium (Dated: June 26, 2012)
We determine the temperature profile in magnetic nanocontacts submitted to the very large current densities that are commonly used for spin-torque oscillator behavior. Experimentally, the quadratic current-induced increase of the resistance through Joule heating is independent of the applied temperature from 6 K to 300 K. The modeling of the experimental rate of the current-induced nucleation of a vortex under the nanocontact, assuming a thermally-activated process, is consistent with a local temperature increase between 150 K and 220 K. Simulations of heat generation and diffusion for the actual tridimensional geometry were conducted. They indicate a temperatureindependent efficiency of the heat sinking from the electrodes, combined with a localized heating source arising from a nanocontact resistance that is also essentially temperature-independent. For practical currents, we conclude that the local increase of temperature is typically 160 K and it extends 450 nm about the nanocontact. Our findings imply that taking into account the currentinduced heating at the nanoscale is essential for the understanding of magnetization dynamics in nanocontact systems. Keywords: Thermal activation, Vortex, Magnetic dynamics, Point-Contact
The discovery of the spin transfer torque [1, 2] (STT) has provided the ability to manipulate the magnetization with an electrical current. This opened opportunities for new spintronic devices such as spin-torque operated magnetic random access memories or nanosized spin-torque oscillators [3]. Unfortunately, STT requires huge current densities, which can lead to substantial heating and early material fatigue. STT may also assist the magnetization switching in nanopillar geometries [4, 5], and it can increase the magnetization thermal noise [6], degrading the device performances. In nanopillar geometries, the magnetization dynamics takes place in a very confined region where the temperature is almost uniform [7], such that the temperature dynamics could be understood from simple experiments [5]. In contrast, the temperature rise and its spatial profile remain almost [8] unexplored in nanocontact (NC) devices. This is problematic because magnetization dynamics takes place in a much wider area [9, 10] where the temperature might be very non uniform, potentially affecting the dynamics [11, 12]. In this context, it is essential to develop reliable tools to access to the local temperature during operation under large current densities. In this paper, we propose a methodology to access to the local temperature below the NC. The experimental bases of our method rely on the measurement and modeling of the electrical resistance of the nanocontact, combined with the study of the current-pulse-induced vortex nucleation [13] at different temperatures. The experimental results are compared with numerical results from tridimensional simulations of the heat generation and diffusion. The simulations allow us to access to the temper-
ature profile. We conclude that at the very large current densities that are commonly used [3, 9]for spin-torque oscillator behavior (around 4 108 A/cm2 ), the temperature increase is typically between 150 and 220 K with a very strong spatial gradient, which implies that it is essential to take into account the heating when aiming at understanding magnetization dynamics in nanocontact systems. We work on the NC depicted in Fig. 1. The top electrode forming the nanocontact is made of a Au(200 nm)/Ti(10 nm) truncated cone with a radius at the base rn = 60 nm imprinted in a 50 nm thick SiO2 insulating layer (Fig 1c). The NC contacts the top of an extended spin valve (SV) of composition : seed layer 50/IrMn 6/Co90 Fe10 4.5/Cu 3.5/Ni80 Fe20 5/Pt 3 (thicknesses are in nm). The stack is grown on a 500 µm thick substrate of intrinsic GaAs. The ends of each electrode (squares in Fig. 1a) are 250 µm away from the NC, and they are electrically contacted with RF probes. The device magneto-resistance is typically 20 mΩ between the parallel and antiparallel state for a total resistance in the parallel state of 6.2 Ω at room temperature [14]. Note that this value includes the resistance of the electrodes. Low temperature measurements (5 − 300 K) have been performed in vacuum inside a dark cryostat entirely surrounded by a radiative screen. The sample substrate is pressed on a copper thermal chuck, that is maintained at the temperature Tapplied . The electrical probes and the radiative screen are also at Tapplied . To measure the probability of nucleating a vortex state using current pulses, we have used the protocol described in ref. 13: at a given
Resistance (Ω)
a)
6.5 6.0
300
Tapplied= 240K Parabola fit
250 200 150
5.0
4.0 0
applied temperature, we apply current pulses with amplitudes 43 < I < 48 mA and durations τpulse =5-10 ns and measure the resulting microwave voltage spectrum to determine whether a vortex has been created[13]. The system is then reset to uniform magnetization, and the procedure is repeated 1000 times, with a waiting time of 100 ms between each repetition, to get the vortex nucleation probability as a function of I, τpulse and Tapplied . Let us now summarize our main experimental findings. In a first step, we investigate the temperature dependence of the DC electrical properties (Fig. 2). The zero bias resistance of the NC increases linearly with the temperature ( dR dT = 6.4 mΩ/K) from a residual resistance R0 of 4.3 Ω. While applying some finite bias current, the differential resistance in the magnetic parallel state increases (fig. 2b) almost with the square of the DC current for all investigated applied temperatures. This indicates that the dominant effect leading to the extra resistance δR is Joule heating. The curvature of δR is independent of the applied temperature. Surprisingly, this suggests that the current-induced temperature increase is independent of the resistance variations with the temperature in this system. Our understanding of this unexpected behavior is the following. Let us artificially split the electrical system into two different parts: the Au electrodes on one side, and the nano-contact zone and the spin valve stack (NC+SV) on the other side. We consider that the Au parts are thick enough to be considered as bulk materials, with negligible residual resistance R0electrodes ≈ 0. The total residual resistance R0 is thus essentially that of the NC+SV part, written RN C+SV .
Tapplied= 6 K
5.5
4.5
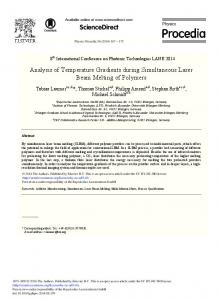
FIG. 1. (Color online) (a) Top view of the sample. The bright areas are the gold electrodes. The substrate is covered by 50 nm of SiO2 and appears in black. The sample is contacted with electrical probes on the squares located at the outer edges of the image. At these positions and at the back side of the substrate the temperature is Tapplied . The (colored) arrows show the direction of the heat flux away from the NC. (b) Scanning electron micrograph of the central part of the device, where we can see the 17 × 27 µm2 spin valve mesa. As the gold electrodes are deposited in a conformal way, the footprint of the buried NC appears as a circular dot. (c) Sketch of the NC.
b)
Parallel resistance for IDC=0
100
dR/dT=6.4 mΩ/K R0=4.3 Ω 75 150 225 Temperature (K)
dV/dI (mΩ)
2
50
300
-30
-15 0 15 DC current (mA)
30
0
FIG. 2. a) Square symbols: resistance of the parallel state for different applied temperatures. Line : linear fit. b) Evolution of the differential resistance with applied DC current for two different applied temperatures, 6 K (solid line) and 240 K (dashed line). The upper (dotted) curve is a parabola, used for comparison purpose only. The three curves are vertically offset for clarity.
We thus write the total resistance as:
R(T ) = R0 +
�
� dR dR dR T (1) + + dT N C dT SV dT electrodes
We believe that electron scattering due to alloy disorder [15] in the spin-valve and interface reflexions are predominant in RN C+SV , which has two consequences. (i) The resistance below the NC is essentially independent of the local temperature (in practice, dR dR T and dT N C dT SV T