USING ARTIFICIAL NEURAL NETWORKS FOR MAPPING OF SCIENCE AND TECHNOLOGY: A MULTI SELF-ORGANIZING MAPS APPROACH
Xavier Polanco*, Claire François*, Jean-Charles Lamirel**
*URI/INIST-CNRS, 2, allée du Parc de Brabois - 54514 Vandoeuvre-lès-Nancy Cedex France
[email protected] -
[email protected] **LORIA B.P. 239, 54506 Vandoeuvre-lès-Nancy Cedex France
[email protected]
We argue in favour of artificial neural networks for exploratory data analysis, clustering and mapping. We propose the Kohonen self-organizing map (SOM) for clustering and mapping according to a multi-maps extension. It is consequently called Multi-SOM. Firstly the Kohonen SOM algorithm is presented. Then the following improvements are detailed: the way of naming the clusters, the map division into logical areas, and the map generalization mechanism. The multi-map display founded on the inter-maps communication mechanism is exposed, and the notion of the viewpoint is introduced. The interest of Multi-SOM is presented for visualization, exploration or browsing, and moreover for scientific and technical information analysis. A case study in patent analysis on transgenic plants illustrates the use of the Multi-SOM. We also show that the inter-map communication mechanism provides support for watching the plants on which patented genetic technology works. It is the first map. The other four related maps provide information about the plant parts that are concerned, the target pathology, the transgenic techniques used for making these plants resistant, and finally the firms involved in genetic engineering and patenting. A method of analysis is also proposed in the use of this computer-based multi-maps environment. Finally, we discuss some critical remarks about the proposed approach at its current state. And we conclude about the advantages that it provides for a knowledge-oriented watching analysis on science and technology. In relation with this remark we introduce in conclusion the notion of knowledge indicators.
1. INTRODUCTION
The digital maps are not only tools of visualization. They also represent an analysis tool. Appropriate display of clusters points can give the analyst an insight that it is impossible to get from reading tables of output or simple summary statistics. For some tasks, appropriate visualization is the only tool needed to solve a problem or confirm a hypothesis, even though we do not usually think of maps as a kind of analysis. In the present article, we shall only consider the digital map uses in science and technology watching vis-à-vis the uses for evaluative bibliometrics purposes (for this last use, see Noyons et al., 1999). The problems about the functionalities of digital science maps have been underlying (Buter et al., 2000, p. 35). On the digital maps, we are concerned with an information analysis computer-based system. Clustering, cartography, and hypertext generation are the three components of our approach. Since 1990 we apply this approach for the analysis of the scientific and technical information (articles, patents).
-292
Artificial Neural Networks (ANNs) are a useful cluster of models consisting of layers of nodes. Our interest in ANNs was at the beginning based on the links that exist between multivariate data analysis and the ANNs approaches in the areas of clustering and mapping. The non-linear capabilities and either the supervised or unsupervised learning algorithms that the ANNs represent for clustering and mapping also motivated our interest. Since 1995 we develop a specific research program about the application of ANNs firstly for the science and technology watching purposes, and secondly for text mining and knowledge discovery in databases. A set of publications presents the results of this research. We began by testing some ANNs such as ART1 for clustering, and the multiplayer perceptron (MLP) and also the Kohonen self-organizing map (SOM) for cartography (Polanco et al., 1998a). Then we compared and evaluated mathematically the MPL in self-association mode with the standard principal component analysis (PCA) for mapping purposes. Such a network as we showed performs a non-linear principal component analysis (Polanco et al., 1998c; 1998d). Finally, we used a non-linear MLP with two hidden layers for mapping the clusters generated by an axial k-means (AKM) algorithm (Polanco and François 2000a). In order to state the relationships explicitly among the clusters on the map we applied a related component analysis (RCA). The RCA is based on graph theory and defines the related components which represent the relative closeness between clusters on the map surface. The final result of all this work is a combined two steps computer-based system: firstly the data are clustered by the AKM algorithm, then the MLP maps the clusters and the cluster relationships are designed by means of the RCA. Now, we are turning to the Kohonen self-organizing map (SOM) in order to do in only one step the tasks of clustering and mapping a data set and applying a hypertext multi-map approach (Polanco et al., 2000b; François et al., 2000). According to Kohonen (1997, p. 86), one might say that the SOM is a non-linear projection of the probability density function p(x) of the highdimensional input data vector x onto the two-dimensional display (i.e. a map). The power of ANNs is derived from their learning capability defined as a change in the weight matrix (W), which represents the strength of the links among nodes. In the SOM case, the learning is competitive and unsupervised. The main techniques of clustering in data analysis are supervised and unsupervised techniques. A clustering technique is called supervised if one compares the unknown pattern x with all known reference patterns y on the basis of some criterion. The problem is called unsupervised clustering if one assumes that we do not know the clusters a priori. Nevertheless the data (or the samples) fall in a finite set of categories according to their similarity relations. We reserve the term "classification" to signify only the supervised technique, which is known also in data analysis as "discriminant analysis" (Lebart et al., 1995; McLachlan, 1992), and we use the term clustering to signify the unsupervised technique, usually called "cluster analysis" (Everitt, 1974; Hartigan, 1975; Alderfer and Blashfield, 1987). Another important property of the ANN clustering method discussed in this article is the spatial order and organization in the representation of data with all their interrelationships. The self-organizing map (SOM) gives central attention to spatial order in the clustering of data. The purpose is to compress information by forming reduced representations of the most relevant features, without loss of information about their interrelationships. In the quantitative studies of science, the Kohonen self-organizing maps have been used for mapping scientific journal networks (Campanario, 1995), and also author co-citation data (White et al., 1998). In this article we shall be dealing with an innovation that was firstly introduced for the information retrieval purposes (Lamirel, 1995; Lamirel et al., 2000). It is the multi-map extension of the Kohonen SOM algorithm. This will be from now signified by the name of Multi-SOM. As we shall notice, the Multi-SOM introduces the concept of viewpoints into the information analysis concept with its multi-maps displays. The principal intention of this article is to propose the Multi-SOM model as an ANN implementation of the information analysis concept. This concept technically supposes unsupervised clustering and learning capabilities, and gives pretty importance to spatial order in the representation of data. The organization of this article is the following. Section 2 presents the Kohonen self-organizing maps (SOM). Sections 3 details directions for use SOM on clustering and mapping indexing document data. Section 4 expose Multi-SOM implementation. In section 5, the reference to an empirical case study illustrates the multi-maps displays for information analysis. Section 6 develops the method of analysis in the use of the multi-maps display. In section 7, we discuss some critical remarks about the proposed approach at its current state. And we
2
also show the advantages that it provides for a knowledge oriented watching analysis on science and technology. The conclusions are exposed in section 8.
2. THE SELF-ORGANIZING MAP (SOM)
The basic principle of the SOM is that our knowledge organisation at higher levels is created during learning by algorithms that promote self-organisation in an spatial order (see Kohonen, 1984, 1990, 1991, 1993, and 1997, p. 79-83; also Ritter and Kohonen, 1989). The SOM is then a neural network that pays attention to spatial order. We shall see in this section: the architecture of the SOM; the family of ANNs that SOM belongs; its neighbourhood clustering algorithm based on a competitive unsupervised learning. Notice that the unsupervised learning is used for abstracting from data without prior knowledge significant patterns and relationships between them.
2.1 Architecture: A Neighbourhood Self-Organizing Structure
The architecture form of the SOM network is based on the understanding that the representation of data features might assume the form of a self-organizing feature map that is geometrically organized as a grid or lattice. In the pure form, the SOM defines an "elastic net" of points (parameter, reference, or codebook vectors) that are fitted to the input data space to approximate its density function in an ordered way. The algorithm takes thus a set of N-dimensional objects as input and maps them onto nodes of a two-dimensional grid, resulting an orderly feature map (Kohonen, 1997, p. 69).
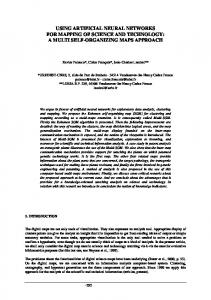
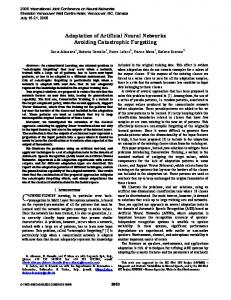
Self-Organizing Map
Input
Figure 1: Network Architecture. The SOM components are the input layer and the topological map, a layer of nodes topologically structured. Two-dimensional array of output nodes used to form self-organizing map. Every input is connected to every output node via a variable connection weight.
A layer of two-dimensional array of competitive output nodes is used to form the feature map. Every input is connected to every output node via a variable connection weight. Figure 1 shows this network architecture. The map organisation arises from distance measure-defined d about the nodes of the network. Thus, the algorithm defines the nearest neighbourhood Ns,1 of a node s as the set of the nodes S which are at the distance 1 from the selected node s: Ns,1 = {d (i, s) ≤ 1, i ∈ S}
3
From this definition, a largest neighbourhood Ns,M will be also defined to be the set of the nodes at the inferior or equal distance to M from the node s: Ns,M = {d (i, s) ≤ M, i ∈ S} The lattice type of array can be defined to be square, rectangular, hexagonal, or even irregular. The most used forms are the square and the hexagonal arrays of nodes. This structure is not explicitly defined in the architecture of the network at the moment of its design. The interest of this network resides in the neighbourhood structure that develops progressively by learning and arises from the nodes behaviour. It is the self-organizing property.
2.2 Competitive Learning Network
The SOM belongs to the category of the unsupervised competitive learning networks (Hinton, 1989, p. 216218; Joudoin, 1994, chap. 6; Kohonen, 1997, p. 68-69). It is called competitive learning because there is a set of nodes that compete with one another to become active. To this category belongs also the adaptative resonance theory (ART) model of Grossberg and Carpenter, as well as the self-organizing maps discussed in this paper. In the SOM, the competitive learning means also that a number of nodes is comparing the same input data with their internal parameters, and the node with the best match (say, "winner") is then tuning itself to that input, in addition the best matching node activates its topographical neighbours in the network to take part in tuning to the same input. More a node is distant from the winning node the learning is weaker. It is also called unsupervised learning because no information concerning the correct clusters is provided to the network during its training. Like any unsupervised clustering method, the SOM can be used to find clusters in the input data, and to identify an unknown data vector with one of the clusters. Moreover, the SOM represents the results of its clustering process in an ordered two-dimensional space (R2). A mapping from a highdimensional data space Rn onto a two dimensional lattice of nodes is thus defined. Such a mapping can effectively be used to visualise metric ordering relations of input data.
2.3 The Clustering and Mapping Process
In the attempt to implement a competitive unsupervised learning principle that would work reliably in practice, effectively creating globally ordered maps of various sensory features on a layered neural network, Kohonen formalized the "self-organizing process" in 1981 and 1982 into an algorithmic form that is now being called the "Self-Organizing Map" (SOM). As Kohonen (1997, p. 69) says: "The main applications of the SOM are in the visualisation of complex data in a two dimensional display, and creation of abstractions like in many clustering techniques." The SOM takes a set of documents in our case patents as input data (x), each patent is represented by a Nkeywords vector (x ∈ Rn), and maps them onto nodes of a two-dimensional grid (n ∈ R2). Each input dimension keyword may be considered a feature. Each node in the grid is assigned a N-dimensional vector of keywords. The components of this vector are called weights (W). Initially weight components are small random values. They are adjusted through the following learning process (Lippman, 1987,p. 18-20; Lin et al., 1991, p. 263):
1. 2. 3.
Select an input vector randomly from the set of all input vectors. Find the node whose weights closest to the input vector in the N-dimensional space. This node is called the winning node. Adjust the weights of the winning node so that it becomes still closer to the input vector in the Ndimensional space
4
4.
Adjust the weights of the nodes close to the winning node in the two-dimension grid. These nodes are called the neighbour nodes and the set of neighbour nodes around the winning node is called neighbourhood kernel.
This process goes through many iterations until it converges, i.e. the adjustments approach zero. Each input vector is then mapped to a grid node closest to it in the N-dimensional space. Suffice to assert that the resulting maps are non-linear projections of the input space onto the two-dimensional grid. The result is an orderly selforganising feature map. The main properties of such self-organizing maps are the following: "First, the distance relationships between the input data are preserves by their images in the map as faithfully as possible. While some distortion is unavoidable, the mapping preserves the most important neighbourhood relationships between the data items, i.e., the topology of their distribution. Second, the map allocates different numbers of nodes to inputs based on their occurrence frequencies. If different input vector appear with different frequencies, the more frequent one will be mapped to larger domains at the expense of the less frequent ones" (Ritter and Kohonen, 1989, p. 246).
2.4 Computational Algorithm
In this section, the SOM algorithm is presented according to (Kohonen, 1997, p. 86-88; Lin et al., 1991, p. 262-264; Jodouin, 1994, p. 124-130 and 193-196; Lippmann, 1987, p. 18-20). The computational algorithm of the SOM consists of two basic procedures: [1] selecting a winning node and [2] updating weights of the winning node and its neighbouring nodes. The winning node is selected according to the Euclidean distance of an input vector and the weight vectors in the N-dimensional space. The algorithm is based on three computational levels: the winning node selection, the unsupervised learning and neighbouring definition, and the control mechanisms of the unsupervised self-organizing algorithm.
1 - Winning node selection Let x(t) = {x1(t), x2(t), …, xN(t)} be the input vector selected at time t, and Wk(t) = {Wk1(t), Wk2(t), …, WkN(t)} the weights for node k at time t. The smallest of the Euclidean distances ||x(t) – Wk(t)|| can be made to define the winning node s: ||x(t) – Ws(t)|| = min ||x(t) – Wk(t)||
2 - Unsupervised learning and neighbouring definition After the winning node s thus selected, the weights of s and the weights of the nodes in a defined neighbourhood (for example all nodes within a square or a cycle around the winning node) are adjusted so that similar input patterns are more likely to select this node again. This is achieved through the following computation: Wki(t+1) = Wki(t) + α(t) × h(t) × [Xi(t) – Wki (t)] for 1 ≤ i ≤ N Where α(t) is a gain term (0 ≤ α(t) ≤ 1) that descreases in time and converges to 0, and h(t) is the neighbourhood function. Intuitively, this formula defines that if a component of the input vector is greater than the corresponding weight, increase the weight by a small amount; if the input component is smaller than the weight, decrease the weight by a small amount; the larger the difference between the input component and the weight component, the larger increment (decrement).
3 – The control mechanisms of the unsupervised self-organisation algorithm
5
Two control mechanisms, α(t) and h(t), are imposed for guarantying that the unsupervised self-organizing algorithm operates properly. The first mechanism is the adaptative gain parameter α(t). Since α(t) is slowly decreasing function that converges to 0, the updating will eventually stop and the map converges. The mathematical proof of the convergence of this algorithm is provided in Kohonen (1984). The second mechanism is the neighbourhood function h(t) that shrinks the kernel neighbourhood of a node gradually over time. A large neighbourhood will help to achieve a stable convergence of the map. By beginning with a large neighbourhood and then gradually reducing it to a very small neighbourhood, the SOM achieves both ordering and convergence properties. In addition, two choices for h(t) computation can be used. The first refers to neighbourhood set of array nodes around the selected node s. Figure 2 shows an example of this topological neighbourhood. The index set is denoted Ns, whereby hsi(t) = α(t) if i ∈ Ns and hsi(t) = 0 if i ∉ Ns. The value of α(t) is then identified with a learning rate factor (0 < α(t) < 1). Both α(t) and the radius of Ns(t) are usually decreasing monotonically in time during the ordering process. The application described in this article adopts this version of the algorithm. Another is to use a Gaussian function to describe the neighbourhood h(t) and the gain parameter α(t) whose formula is: hsi(t) = α(t) × exp (− ||rs – ri||2 / 2σ2(t)) where α(t) is another scalar valued learning rate factor, and the parameter σ(t) defines the width of the kernel; the latter corresponds to the radius of Ns(t). Both α(t) and σ(t) are some monotonically decreasing functions of time.
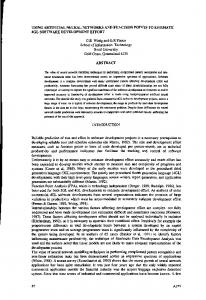
Nc(t0) Nc (t1) Nc (t2) = S: Selected Node
Figure 2: Example of topological neighbourhood. Topological neighbourhoods at different times as self-organizing maps are formed. Ns(t) is the set of nodes considered to be in the neighbourhood of selected node s at time t. The neighbourhood starts large and slowly decreases in size over time.
2.5 The affectation of data to nodes of the map.
For the application of the SOM algorithm we use SOM_PACK freeware (see reference 39). Once the SOM algorithm is achieved, the data (i.e. documents) are affected to the nodes of the map. For each input data vector, the winning node is selected according to the algorithm second step presented above, and the data are affected to this selected node.
3. SOM IMPROVEMENTS
6
The above SOM algorithm is improved with the following three characterizing operations about the map. The first is the way of the clusters are named, the second is the division of the map into logical areas, and the third is the generalization mechanism.
3.1 Naming the Clusters
A first task of this mapping computerized analysis consists in defining clusters names that could optimally represent the clusters contents when the map is displayed to the user. Due to the fact that there is obviously no absolute strategy for achieving that goal, the choice has been to implement two different kinds of strategies that could be indifferently used during the map interactive consultation phase. They are respectively called the clusters vector driven strategy and the document vector driven strategy. Clusters are node vectors; each component of the vectors is the coordinate of an index element (keyword), it is a cluster profile. The list of the input data are the documents affected to the node, it is the cluster members profile. The conceptual mean of the clusters is below called theme. This semantic information is supplied by the clustered keywords and documents (titles and abstracts). The clusters vector driven strategy consists of attributing to each cluster a name that represents the combination of the labels of the components having the maximum values in its vector. This strategy is wellsuited in highlighting for the user the main themes described by the map. The document vectors driven strategy consists of attributing to each cluster a name that represents the combination of the labels of the components having the maximum values in either the vector of the most representative member of the cluster or the average document vector computed from all the cluster member vectors. In this strategy, no name could obviously be attributed to intermediary clusters due to the fact that they do not have any associated member. This strategy is useful in providing the user with complementary information for the map’s nodes content interpretation. Because some important information on a cluster could be better represented in the document vector than in its related cluster vector. This phenomenon is due to the fact that the cluster vectors are drawn from the keywords clustering process while the document vectors represent straightforward information from the original data (clustered and mapping documents.)
3.2 Map Division into Logical Areas
The second task of the computer-based analysis consists in dividing the map into coherent logical areas or nodes group. The area computation is based on the topographic properties of the node vectors of the SOM. These properties are only valid on a reliable map, guaranteeing the continuity and the locality of the variations of the map node vectors, and indeed the closeness of the computed areas on the map. This division into areas could also be considered as a very good illustration of the non-linear mapping behaviour inherent to the original Kohonen clustering method. The area computation algorithm which represents a generalization of the Lin algorithm (Lin et al., 1991) have been presented in detail in Lamirel (1995, p. 278-282) It is dividing and gathering procedure having the capability of manager the areas overlaps. Let the external vector ni of each node i be the set of components {çi (1), çi (2), …, çi (N)}. The first phase is defining the following set:
1. Qp = {i | ind (max (çk(i)) = p}; where p is the index of a keyword, max (çi (i)) is the maximal value of the vector, and the function ind (çk(i)) = i gives the index of the keyword i associated to the value çk(i). Qp is the set of nodes k whose maximal value in the external vector is associated to the keyword p.
7
N
2.
A = U{QP } p=1
The gathering phase is the construction of the set A' of the final areas of the map. Le principle of the phase is gathering two areas onto one area when that of the other hides the maximal components of an area. The algorithm is the following:
A' = A ∃ Qp and Qq in A' such as ∀x ∈ Qq, ∃y ∈ Qp, ηx(p) = ηy(p), begin: 1) Qp ∨ q = Qp ∪ Qq, 2) A' = (A' – Qp – Qq) ∪ {Qp ∨ q} End.
Each area, which can be regarded as a theme, yields very reliable information on the relative importance of the different clusters described by the map. Main themes are represented as larger areas (i.e. with more nodes) than the marginal themes.
3.3 Generalization Mechanism
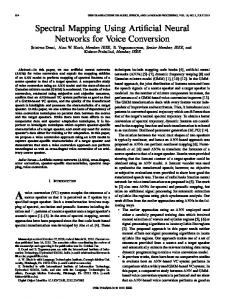
An interesting functionality for information analysis is summarizing the map content into more generic clusters through an on-line generalization process. In order to reach that goal the task that the system operates is to reduce the number of cluster (i.e. the number of nodes) of the map in a coherent way. The method consists in starting from the original map and introducing new clustering levels of synthesis (i.e. maps) by progressively reducing the number of nodes. Since the original map has been build on the basis of a 2D square neighbourhood between nodes, the transition from one level to another is achieved by choosing a new node set in which each new node will represent the average composition of a square of four direct neighbours on the original level. Figure 3 shows how the map generalization process operates.
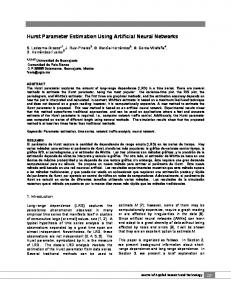
Generated Maps
Synthesis Neuron (Level M + 1)
Square Neighbour Neurons (Level M)
Original Kohonen Map
Figure 3: Generalization Mechanism. This figure shows the map generalization process. Here are illustrated the correspondences existing between the original Kohonen map (SOM) issued from the basic topographic clustering process, and the different online generated synthetic maps.
8
It also shows how the profiles of neighbourhood node of one level (map) are used to generated the profile of each node of the next more synthetic level.
This method can be also regarded as the determination of all the square centres of a source level for building a new level. This procedure has the advantage of preserving the original neighbourhood structure on the new generated levels. Moreover it ensures the conservation of topographic properties of the map nodes vectors, and consequently the conservation of the closeness of the nodes areas in the generalized maps. Let n × m (n, m ≥ 2) be the dimensions of the map associated to a given level, the generalization process will then produce a next more general level in the form of a (n – 1) × (m – 1) map. For each new level node n the vector computation formula then applies: WnM +1 =
1 4n
∑W
nk
k
∈VnM
where N nM is the square neighbourhood set on the map M associated to the node n of the new map M + 1. This method could be considered as an implicit and distributed form of a hierarchical clustering method based on neighbourhood reciprocity (for this point, see De Rham, 1980). The generalization method can beneficially be used to evaluate the coherency of the clusters that have been computed on an original map. Indeed, due to the map properties, the coherency of a given theme is directly tied to the relative stability of the number of its attributed nodes and of the borders of its associated area during the different generalization steps.
4. MULTI-MAP DISPLAYS FOR INFORMATION ANALYSIS
The communication between self-organizing maps that has been first introduced in the context of an information retrieval model (Lamirel 1995), represents a major amelioration of the basic Kohonen SOM model. As we have discussed previously (in section 1), this multi-maps display introduces in the information analysis the use of viewpoints. Each different viewpoint is achieved in the form of map. Each map is a spatial order in which the information is represented into nodes (clusters) and spatial areas (group of clusters). The multi-maps enable a user to highlight semantic relationships between different themes belonging to different viewpoints. Each map represents a particular viewpoint. Figure 5 illustrates it.
4.1 Viewpoint notion The viewpoint building principle consists in separating the description space of the documents into different subspaces corresponding to different keyword subsets. The set of V all possible viewpoints issued from the description space D of a document set can be defined: V = {v1, v2, …, vn}, vi ∈ P(D), n with vi = D i =1
U
where each vi represents a viewpoint and P(D) represents the set of the parts of the description space of the documents D; the union of the different viewpoints constitutes the description space of the documents. The viewpoint subsets issued from V may be overlapping ones. They also fit into the structure of the document when they correspond to different index vocabulary subsets associated to the different document sub-fields. In the context of a documentary database, specific viewpoints may be associated to specific reference fields like
9
"indexer keywords", "title keywords", or "author" field. Complementary viewpoints may be also extracted from the overall document description space. The notion of viewpoint is more general than the one of document field. It is always possible to find a viewpoint that represents the description space used in a document field:
∀fi ∈ F, ∃ vk ∈ P(D); Ufi = {vk}
4.2 Inter-Map Communication Mechanism
In Multi-SOM, this communication is based on the use of the data that have been projected onto the maps as intermediaries nodes or activity transmitters between maps. The intercommunication process between maps operates in three successive steps. Figure 4 shows graphically the three steps of this intercommunication mechanism. At the step 1, the original activity is directly set up by the user on the node or on the logical areas of a source map through decisions represented by different scalable modalities (full acceptance, moderated acceptance, moderated rejection, full rejection) directly associated to nodes activity levels. This procedure can be interpreted as the user’s choices to highlight (positively or negatively) different themes representing his centres of interest relatively to the viewpoint associated to the source map. The original activity could also be indirectly set up by the projection of an user’s query on the nodes of a source map. The effect of this process will then be to highlight the themes that are more or less related to that query. Therefore, the activity of each map node is set up to the value of the cosine measure (Salton, 1971) between the node vector and the query vector. The activity transmission to target maps is based itself on two elementary steps: a first transmission step from the activated source map to its associated document nodes (down activation), and a second transmission step from the activated document nodes to the target map (up reactivation). The activity of a cluster i of the target map T derived from the activity of a source map S is computed according to the following formula:
(
)
( )
AiT = f n∈i g( An ) , An = g A Sjn
n represents a node associated to a data, jn its associated cluster on the source map, f is a function implementing the semantic correlation computation described below, g is a bias function also described in the next paragraphs. This activity transmission can be considered as a process of evaluation of the semantic correlation existing between themes of a source viewpoint (source map), and themes belonging to several other viewpoints (target maps).
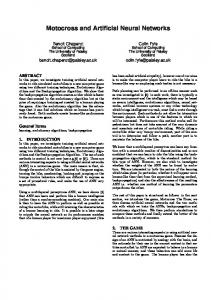
Source signal: direct user activation or query matching activation [1]
Source Map
[3] [2]
Figure 4: Inter-Map Communication Mechanism. This figure represents the three main steps of the inter-map communication mechanism. [1] The activity is set up directly by the user or by a query formulation on one or several nodes of one or several source map. [2] The activity is
10
transmitted to the data nodes associated to the activated class nodes of the source map. [3] The activity is transmitted through the data nodes to other maps to which these data are associated. Positive as well as negative activity could be managed in the same communication process. Note that the data are in this case indexed patents.
The parameters of the intercommunication procedure that are proposed to the decision of the analyst are the two modes of computing the semantic correlation, f, a possibilistic mode or probabilistic mode, and the use of the bias function g. In the possibilistic computing of the semantic correlation each cluster inherited of the activity transmitted by its most activated associated data. The f function can be given as:
f = Max (An+ ) + Max (An− ) n∈i
n∈i
A+ represents a positive activity value (positive choice), and A- a negative activity value (negative choice). This approach helps the user to detect weak semantic correlation (weak signals) existing between themes belonging to different viewpoints. For possibilistic theory, see Dubois and Prade, 1988. In the probabilistic computation of the semantic correlation: each cluster inherited of the average activity transmitted by its associated data, either they are activated or not. The f function described above can be given as: f =
1 i
∑A
n
n∈i
|| i || represents the number of data associated to the cluster i. The probabilistic computation gives a more reliable measure of the strength of the semantic correlations, and may be then used to differentiate between strong and weak matching. The role of the bias function g, which can be optionally used, is to modulate the activity transmission from a cluster to a data (down activation), and afterwards from a data to a cluster (top activation), considering the belonging degree of a data to a cluster as an attenuation factor for that transmission. Note to perform in the best conditions, the inter-map communication process obviously necessitates that a significant part of the data should play that roles between the maps. This last condition could be easily verified if each vector used for the map generation indexes a significant part of the bibliographic database.
5. APPLICATION
In the two preceding sections we have introduced Multi-SOM after to be previously presented the SOM algorithm. We now have sufficient machinery to examine the issue of its application. In this section, we shall then use a real example, to make some of the notions more concrete. We argue that visualisation into form of a set of maps represents an important means for analysis in the technology watching tasks, as well as in science watch, and in knowledge discovery in databases. Our empirical example is a set of 1843 patents about vegetal transgenic technology indexed by 724 keywords, and recorded in the period 1978-1997. This section is organized in the description of two different aspects of the application. One is. the definition of a mode of analysis. It supposes the determination of the problem in the analysis (section 5.1), and the strategy of the analysis for solving the defined problem (section 5.2). The other aspect is the set of computer-based technical tasks. The section 5.3 describes these tasks.
11
5.1 The problem to be solved
A first clustering using an axial k-means algorithm (Polanco et al., 1998b; about this axial k-means algorithm, see Polanco and François, 2000) led us to conclude that the amelioration of the plant resistance to certain pathological agents is one of the main genetic engineering application. Now to analyse this biotechnological subject implies to be able to get knowledge about thematic queries as for instance: • • • •
"What are the plants or plant groups that one tries to ameliorate?" "From which pathogen does one try to protect one specific plant or plant group?" "Which are the transgenic techniques that are used on one plant or plant groups?" "Which are the biotechnological firms and the research laboratories patenting?"
In this case the subject of the watching analysis is the patenting transgenic-plant. The answers to those questions represent the watching analysis. There is a statistical analysis. But the truly watching analysis is not a quantitative study. Answers as such watching questions are qualitative and suppose the expertise on the knowledge domain. The above four questions will be mapped. Each of these maps will represent a viewpoint.
5.2 The watching analysis strategy
In comparison with the standard mapping methods, as such principal component analysis or multidimensional scaling, the advantage of the multi-map displays is the inter-map communication mechanism that Multi-SOM environment provides to user. Each map is representing a viewpoint. Each viewpoint is representing a subject category. The inter-map communication mechanism assisted the user to cross information between the different viewpoints. The five viewpoints concerning patents on transgenic techniques for improving the resistance of the plants to the pathogen agents are the following:
1. 2. 3. 4. 5.
Plants Plant parts Pathogen agents Transgenic techniques Patenting firms
The four first viewpoints correspond to subsets of the indexing vocabulary of the patents. The patents have been previously indexed using computer-based indexing tool (Royauté et al., 1996, François et al., 1999). This tool extract terms from the titles and abstracts according to a normalized terminology and its syntactical variations. In this case, the terminology consisted on 1200 terms. The extracted terms used as for indexing patents are 724. The number of patents is 1834. The four first viewpoints needed to build corresponding subject categories by manual labelling of the vocabulary due to the fact that it is only constituted by a flat list of index terms. One important preliminary task was then to build manually the categorization of the indexing vocabulary of the patents. The last category implied a normalization of the patenting firms, considering that the same biotechnological firm can appear with different names in the set of published patents. These five categories are considered viewpoints about the subject plant resistance. On the computer system side, the following task was to build the maps representing the different viewpoints, using the map algorithm described in sections 2.3 and 2.4. The second was to use the inter-map communication for achieving thematic querying described in section 4.2. In this application the "generalization mechanism" exposed in the section 3.3 was not used.
12
To illustrate (see figure 5) the inter-map communication mechanism, the analysis started from the rice plant whose all-associated clusters on the map have been judged unambiguous by the domain expert.
1
2
3
4
5
Rice Area Activated The use of the inter-map communication mechanism allows to achieve the thematic querying
Figure 5: Multi-Maps. This figure illustrates the set of the five maps and graphically summarizes the whole inter-map communication process starting from the rice area. The maps are: 1 Plants Map; 2 Plant Parts Map; 3 Pathogen Agents Map; 4 Genetic Techniques Map; 5 Patenting Firms Map. Each map represents a particular viewpoint.
5.3 Computer processing system tasks
In this section, the technical tasks of the processing system are briefly described. The pre- and post-processing phases use tools based on two document engineering platforms, called respectively «Ilib» (Ducloy et al., 1991) and «Dilib» (Ducloy, 1999). Figure 6 summarizes the all computer-based environment. The steps of the global pre-processing phase are the following: data conversion into SGML; creation of the keyword and patent index, keyword categorization that is the construction of the "viewpoints" explained above in the sections 4.1, 5.1 and 5.2. For each viewpoint (the patenting firms or a keyword category): •
•
•
The steps of the local pre-processing phase are [1] the creation of the index of the index that gives for each document the list of the number of the element indexing it; [2] the index transformation into matrix X (n, p), n documents (rows), and p keywords (columns); [3] the data transformation that is a logarithm conversion of the row binary vectors to obtain numeric vectors and the normalization of these row numeric vectors. The SOM process using the SOM_PAK freeware (see reference 39). Initialisation of the node matrix; the learning process; affectation of the document to the nodes. The SOM_PACK output is the numerical information about the map: the matrix of the nodes; and the document affectations according to distances between documents and nodes. The post-processing phase is the transformation of the SOM_PACK outputs. The steps are the following: [1] the creation of the SGML clusters including the geographical information used to build the map; [2] the clusters-filling with titles of the patents, names of the patenting firms, and keywords; [3] the creation of a keyword index. The two SGML files, clusters and keyword index files, are the input files of the Multi-SOM Java Application.
The Multi-SOM Java application is a hypertext user interface that takes as input the different clusters files, one file for each viewpoint, displays the different SOMs, with links to the documents associated to each clusters and provides a dynamic mechanism of exchanges between the different maps according to the process that has been exposed above in section 4.2.
13
Raw Data DB
Processing System Graphic-Hypertext User Interface
Pre-processing
SOMPACK
Post-processing
MAPS MULTISOM
Java Application
Figure 6: Multi-SOM Environment. The use of the SOM-Pack algorithm supposes the document engineering pre-processing and also post-processing. Then the Multi-SOM Java application operates for multi-map management and visualization and navigation or browsing, supplying user-graphical support for accomplishing the analysis task.
6. METHOD OF ANALYSIS
The set of the five interrelated maps are activating from a graphic user interface (GUI). Using the GUI the analyst visualizes and analyses the 1834 patent database on the transgenic plants from the five defined viewpoints (plans, plant parts, pathogen agents, genetic techniques, patenting firms) The analyst uses these five map and their intercommunication mechanism as visualization working space. In this context, maps mean using vision to know. The inter-map communication supports analysis. This section develops the method of analysis follow by the application of the multi-map use. What are the main tasks that system and analysts perform? The data analysis supposes the collaboration between the computerized system and human users. From the human user side, they are on the one hand the analysts engineer who uses computer-based Multi-SOM environment described above, and on the other hand the domain expert who uses his or her background knowledge for doing the very content analysis. The MultiSOM system is the working environment of this collaborative analysis-strategy in which humans are linking by the tasks that the computerized environment supports. The system provides to human analysts a first level analysis with its unsupervised learning approach for extracting from the data the features that the maps display. The second level of analysis is constituted by the tasks that the human analysts should achieve. These tasks can be organized in three successive stages.
First stage: Validation of the Plant Map.
The Plants map could be considered as the basic start point for the subsequent querying process. Verifying the reliability of the map seems then to be crucial. Areas on the map directly highlight the main plants that are mentioned in the patent database. Thus the validation of the Plants map mainly consists in two tasks: 1.
Verifying if the clusters of an area really represent the plant instead of the usual host of a pathogen. This operation is achieved by a consultation of the contents of the documents associated to the clusters. The clusters with an ambiguous interpretation will not be considered in the further steps.
14
2.
Obtaining an overall interpretation of the plants groups and of their relations. This operation is achieved by the following actions: the examination of the cluster positions on the map; the observation of the cluster vectors; the consideration of the relative size of the associated areas.
Second stage: Interpretation of the Results.
This asks strongly the background knowledge of the domain experts. It is briefly illustrated here. Take us a look at some examples only. The neighbourhood on one side of the map between a set of cereal areas (rice, wheat, barley), and the monocotyledonous and grass areas, can be explained by the fact that both cereals and grass are gramineas, pertaining then to the monocotyledonous family. The domain expert also detected ambiguous clusters on the map such as some of the clusters related to tobacco, potato and cauliflower. In these clusters, one important part of the associated documents are not directly related to plant but rather to plant pathogens or to plant transgenic vectors such as tobacco mosaic virus, tobacco hornworm, and potato virus Y, potato leaf roll virus or cauliflower mosaic virus. Such abnormal phenomenon is directly related to the document (i.e. patent) indexing strategy. The indexing strategy that was employed, splitting the document indexes into elementary terms, generates consequently erroneous associations between documents and viewpoints (or categories as we said above in section 5.2). These erroneous associations finally led to the above quoted ambiguous clustering effects. It is a point that asks reworking of the indexation.
Third stage: Thematic queries using inter-map communication process.
For the querying from the Plant map to other maps, the choice was to focus only on plants or plant groups. A reason is because they are important from the point of agriculture. In addition to focus only on the plants are represented by unambiguous clusters on the Plant map. To study the inter-map communication from the Plant map to the other maps, the clusters associated to a specific plant or plant group are considered independently of the clusters of the other plants or plant groups. For each plant or plant group the technical protocol was: 1. 2. 3.
The activation of the whole area associated to a plant or a plant group. The use of the inter-map communication of the activity applying a possibilistic parameter along with a bias from the activated documents to the clusters of the target maps. The analysis of the all the activated clusters on each of the target maps (i.e. target viewpoint). For each activated clusters, this analysis could be itself separated in two steps: [a] validation of the pertinence of the cluster, and [b] of the link highlighted by the inter-map communication between the source plant or plant group and the cluster.
The possibilistic parameter (see above section 4.2) was used in order to detect partial correspondences among the viewpoints (weak correlation) rather than equivalences (strong correlation). The possibilistic propagation does not suppose that all documents of one cluster should be active for the cluster became active. Thus interesting documents could be retrieved notwithstanding inactive on the source map. The use of the ascendant bias allows determining the importance of the document that is responsible of the activation of the clusters.
7. DISCUSSION
We have seen that the Multi-map building, or the construction of viewpoints in the form of maps, asks reworking of the indexation. It is word analysis that poses the problem of the role of the keywords in this approach. Indexation is a first operation. The next is to define the role or the goal of this indexation. It is to define the use of the indexation. The traditional indexation represents a problem to system. The intrinsic quality of the source map plays an important role on the results of the intercommunication mechanism among
15
the maps. To obtain more fitting documents description, and therefore more reliable-maps, asks an elaborated indexing strategy, and using some thesaurus. It will also avoid a costly human validation of the maps. The system is not much interactive or human-centred. Hypertext functionalities are not enough. It is not enough browsing and querying on the final results as a reading. As a working support it is necessary another interactivity from the system. It should be a working interactivity. Two goals could be achieved at least by the graphic user interface. The first is the working interface for elaborated clean and final results. The second is the visualisation of the clean and final results with browsing and querying functionalities. It is critical to consider the interactive and iterative nature of the process of the data analysis; it is the process between a human and data. The data analysis supposes an exploratory phase. Since rarely the analyst starts with a formally specified hypothesis to confirmed or disconfirmed. The experience shows that the interaction with data leads to the formation of one hypothesis. In this exploratory phase, the system provides to human analysts a first level analysis with its unsupervised learning approach for extracting from the data the features that the maps display. We have seen in section 6 the tasks that the human analyst should achieve from the multi-map display. The system must be able to take in account the knowledge that is produced and used by the domain experts in the watching analysis. As well as in knowledge discovery, the core phases are model development, data analysis, and output generation (see Brachman and Anand, 1996). In the model development (it is the categorization work performed in the sections 5.1 and 5.2), and data analysis phases in science and technology watching, as well as in knowledge discovery, it is crucial considering the key role played by the humans, and then to take in account their background knowledge. The analyst's background knowledge about the domain is involved in any real-world application. It is important to include the part played by a mental model of the domain. Much of that resides in the mind of the expert. But our analysis techniques can take advantage of formally represented knowledge in the course of fitting data to a model: the categorization that has been exposed in section 5.2. This remark asks us to consider also a sort of supervised learning in the process in which the training model is the result of the knowledge representation of the analyst's background knowledge.
8 SUMMARY AND CONCLUSION
We have presented a new integrated visual environment. It is a Kohonen-based self-organizing multi-map system. We proposed it as a visualization-based system for scientific and technical information analysis. The model that this multi-map environment provides is certainly the map but in its original extended version of intercommunication between multiples maps. Each map representing a particular viewpoint extracted from the data. These viewpoints are related either by the problem to be solved, or by the intercommunication mechanism between the maps. We have exposed both the map generation and their intercommunication mechanism. We finally showed how this clustering and mapping environment gives assistance to users in some watching intention. A reason to use ANNs in quantitative studies of science and technology is their capability to create "higher abstractions from raw data completely automatically. Intelligence in neural networks ensues from abstractions, not from heuristic rules or manual logic programming" (says Kohonen, 1997, p. 65). In relation with this remark we introduce in conclusion the notion of knowledge indicators. There been a «science indicator» versus «knowledge indicator» discussion in 1978 about the first indicator report edited by NSF (see Elkana et al., 1978). We call here "knowledge indicators" the following three elements: keywords, clusters, and maps. The keywords or index terms that can be compounded terms (at least two words) are the indicators of the knowledge content in the indexing documents. The gathered keywords into clusters, thus the clusters mean themes, we can considered clusters are thematic indicators, i.e., themes in which certain domain knowledge can be featured. The maps of clusters are then thematic maps. The maps play the role of strategic indicators because they provide a meant of comparison for evaluated the relative position of themes onto an ordered space. This ordered space signifies a space of knowledge defined by the set of clusters. It is not a taxonomy. It is an ordered set of clusters extracted directly from data. A taxonomy supposes building
16
a previous order. We justly want to extract the features from data without to use any previous order or classification code as it is called in documentation and library disciplines. In artificial intelligence this problem (of knowledge indicators) is called knowledge representation (see for example Winston 1977, chap. 7; Lugger and Stubblefield, 1999, chap. 8). Winston (1977, p. 177) gives a very large and useful definition: "a representation to be a set of conventions for describing things." We can apply this definition in our domain and say: what we call "indicators" are this "set of conventions for describing things," and the "things" are in our case the documents or more precisely the patents or the scientific articles or any other type of text in the domains of science and technology. In «evaluative bibliometrics», the patent and the articles are considered indicators of activity in the domains of technology and science respectively and used and computed in this semantic frame. The keywords or index terms are by their own nature symbolic objects (compounded by words, letters, numbers symbols). The occurrences of that symbols are computed in the statistical analysis. Instead the clusters and maps are both metric and symbolic objects. Some metric non only computes but also built them, and provides a set of symbolic objects having at the same time very useful mathematical properties for their analysis and justification. As symbolic object they vehicle signification or semantic properties and they can be decoded in some signification code. In our case, they are here decoded as indicators.
REFERENCES
1. 2. 3.
4.
5. 6. 7. 8. 9. 10. 11.
12.
13. 14. 15.
M. S. Aldenderfer, R. K. Blashfiel, Cluster Analysis, Sage Publications, Inc. London, 1990. C. M. Bishop, Neural Networks for Pattern Recognition, Oxford University Press, Oxford, 1998. R. J. Brachman, T. Anand, «The Process of Knowledge Discovery in Databases,» in Advances in Knowledge Discovery and Data Mining, U. M. Fayyad, G. Piatetsky-Shapiro, P. Smyth, and R. Uthurusamy, Editors. AAAI Press / The MIT Press, Menlo Park, Calif., 1996, p. 37-57. R. Buter, E. Noyons, A. Van Raan, «Improving the Functionality of Digital Scie Book of Abstracts of the Sixth International Conference on Science and Technology Indicators, Leiden, 2000, p. 35. J. M. Campanario, «Using Neural Networks To Study Networks of Scientific Journals,» Scientometrics, 33 (1995) No. 1, p. 23-40. D. Dubois, H. Prade, Possibility Theory: An Approach to Computerized Processing of Uncertainty, Plenum Press, New York / London, 1988. J. Ducloy, P. Charpentier, C. François, L. Grivel, «Une boîte à outils pour le traitement de , 25 (1991) p. 80-90. J. Ducloy, «DILIB, une plateforme XML pour la génération de serveurs WWW et la veille scientifique CNRS, Paris, (1999) p. 113-137. Y. Elkana, J. Lederberg, R. K. Merton, A. Thackray, H. Zuckerman, Editors, Toward a Metric of Science: The Advent of Science Indicators, John Wiley & Sons, New York, 1978. B. Everitt, 1974, Cluster Analysis, Heineman Educational, London, 1974. C. François, J. Royauté, X. Polanco, «Apport d'un indicateur linguistique de variation dans une analyse de veile basée sur une méthode de classification non hiérarchique,» Septième rencontres de la -17 septembre, Nancy, 1999, p. 147-154. C. François, X. Polanco, J-Ch. Lamirel, «Information visualization and analysis for knowledge discovery: using a multi self-organizing mapping,» 4th European Conference of Principles and practice of Knowledge Discovery in Databases (PKDD), Lyon, France, September 12-16 2000, Workshop: «Machine Learning and Textual Information Access,» edited by Hugo Zaragoza, Patrick Gallinari and Martin Rajman, 2000, 12 p. J. A. Hartigan, Clustering Algorithms, John Wiley & Sons, New York, 1975. J-F. Jodouin, Les réseaux neuromimétiques, HERMES, Paris, 1994. G. E. Hinton, «Connectionist Learning Procedures,» Artificial Intelligence, 40 (1989) p. 185-234.
17
16. T. Kohonen, Self-Organisation and Associative Memory, Springer Verlag, Third edition, Berlin, 1984. 17. T. Kohonen «The Self-Organizing Map,» Proceedings of the IEEE, 78 (1990) No 9, p. 1464-1480. 18. T. Kohonen, «Self-Organizing Maps: Optimization Approaches,» in Artificial Neural Networks, T. Kohonen, K. Mäkisara, O. Simula, J. Kanges, Editors, Elsevier Science Publishers B.V, North Holland, Amsterdam, 1991, p. 981–990. 19. T. Kohonen, «Things You Haven't Heard about the Self-Organizing Map,» IEEE International Conference on Neural Networks, San Francisco, Calif., March 28 – April 1, (1993) p. 1147-1156. 20. T. Kohonen, Self-Organizing Maps. Springer Verlag, Berlin, 1997. 21. J-Ch. Lamirel, Application d’une approche symbolico-connexionniste pour la conception d’un système documentaire hautement interactif, Thèse de l’Université de Nancy 1 Henri Poincaré, 1995. 22. J-Ch. Lamirel, J. Ducloy, G. Oster, «Adaptative browsing for information discovery in an iconographic context,» In Conference Proceedings RIAO, Paris, Volume 2, 2000, p. 1657-1672. 23. L. Lebart, A. Morineau, M. Piron, Statistique exploratoire multidimensionnelle. DUNOD, Paris, 1995. 24. X. Lin, D. Soergel, G. Marchionini, «A Self-Organizing Semantic Map for Information Retrieval,» in Proceedings of the 4th International SIGIR Conference on R&D in Information Retrieval, 13-16 October, Chicago, 1991, p. 262-269. 25. R. P Lippmann., «An Introduction to Computing with Neural Nets,» IEEE ASSP Magazine, April, p. 4-22 (1987) p. 4-22. 26. G.L. Lugger, W.A. Stubblefield, Artificial Intelligence, Addison Wesley Longman Inc, Reading (Mass), 1999. 27. G. J. McLachlan, , Discriminant Analysis and Statistical Pattern Recognition, J. Wilsey, New York, 1992. 28. E. C. Noyons, H. Moed, M. Luwel, «Combining Mappin and Citation Analysis for Evaluative Bibliometric Purposes: A Bibliometric Study,» Journal of the American Society for Information Science, 50 (1999) No. 2, p. 115-131. 29. X. Polanco, C. François, J-P. Keim «Artificial Neural Network Technoloy for the Clustering and Cartography of Scientific and Technical Information,» Scientometrics, 41 (1998a) No. 1, p. 69-82 30. X. Polanco, C. François, J. Royauté, L. Grivel, D. Besagni, M. Dejean, C. Otto, Organisation et gestion des connaissances en veille scientifique et technologique,» Actes Veille Stratégique, Scientifique et Technologique, Toulouse, 1998b, p. 328-337. 31. X. Polanco, C. François, M. A.Ould Louly 1998c, «An Artificial Neural Network Perspective on Knowledge Representation from Databases: The Use of a Multilayer Perceptron for Data Clusters Cartography,» in Structures and Relations in Knowledge Organization. Proceeding of the Fifth International ISKO Conference, Lille, 25-29 August 2000. Edited by W. Mustafa el Hadi, J. Maniez, S.. A. Politt. Advances in Knowledge Organization, 6 (1998c) p. 64-71. 32. X. Polanco, C. François, M. A. Ould L For Visualization-Based Analysis Tools in Knowledge Discovery Process : A Multilayer Perceptron versus Principal Components Analysis - A Comparative Study,» in J.M. Zytkow and M. Quafafou (eds) Principles of Data Mining and Knowledge Discovery. Springer Verlag, Berlin, 1998d, p. 28-37. 33. X. Polanco, C. François, «Data Clustering and Cluster Mapping or Visualization in Text Processing Dynamism and Stability in Knowledge Organization. Proceedings of the Sixth international ISKO Conference, 10-13 July 2000, Toronto, Canada. Edited by C. Beghtol, C. L. Howarth, N. J. Williamson. Advances in Knowledge Organization, 7 (2000a), p. 359-365. 34. X. Polanco, C. François, J-Ch. Lamirel, «Using Artificial Neural Networks for Mapping of Science.» Book of Abstracts of the Sixth International Conference on Science and Technology Indicators, 24-27 May, Leiden, 2000b, p. 89. 35. C. Rham, «La clustering hiérarchique ascendante selon la méthode des voisins réciproques,» Les cahiers de l’analyse de données, 5 (1980) No. 2, p. 135-144. 36. H. Ritter, T. Kohonen, «Self-Organizing Semantic Maps,» Biological Cybernetics, 61 (1989) p. 241254. 37. J. Royauté, C. Muller, X. Polanco, «Une approche linguistique infométrique de la variation terminologique pour l'analyse de l'information,» Colloque Informatique et Langage Naturel (ILN), -10 octobre, Nantes, 1996, p. 563-581.
18
38. G. Salton, The SMART Retrieval System: Experiments in Automatic Document Processing, Prentice Hall Inc., Englewood Cliffs, New Jersey, 1971. 39. SOM papers, available http://www.cis.hut.fi 40. H. D. White, X. Lin, K.W. McCain, «Two Modes of Automated Domain Analysis: Multidimensional Scaling vs Kohonen Feature Mapping of Information Science Authors,» in Structures and Relations in Knowledge Organization. Proceeding of the Fifth International ISKO Conference, Lille, 25-29 August 2000. Edited by W. Mustafa el Hadi, J. Maniez, S.. A. Politt. Advances in Knowledge Organization, 6 (1998) p. 57-63. 41. P. H. Winston, Artificial Intelligence. Addison-Wesley Publishing Company, Reading, Mass., 1977.
19