unstudied habitat (deep water ...... long lasting, with design lifetimes of 100 years, which implies a longer planning horizon. A ...... Litigation â coastal planning.
Vulnerability to Climate Change of Australia’s Coastal Zone: Analysis of gaps in methods, data and system thresholds
Editors: M. Voice, N. Harvey and K. Walsh
Report to the Australian Greenhouse Office, Department of the Environment and Heritage
2006
Preferred way to cite this publication: Voice, M., Harvey, N. and Walsh, K. (2006). (Editors) Vulnerability to Climate Change of Australia’s Coastal Zone: Analysis of gaps in methods, data and system thresholds. Report to the Australian Greenhouse Office, Canberra, Australia. June 2006.
Contributing authors by alphabetical order and subject matter: Jacqueline Balston, Emerging Technologies, Department of Primary Industries and Fisheries, Queensland (Fisheries and Aquaculture) Captain Kerry Dwyer, K. Dwyer & Associates Pty Ltd, NSW. Chris Harty, Chris Harty Planning and Environmental Management, Camperdown, Victoria (Estuaries, Planning) Nick Harvey, Professor, Geography and Environmental Studies, The University of Adelaide (Beaches, Estuaries, Coastal Ecosystems) John Holmes, JDH Consulting, Mentone Victoria (Infrastructure) Janice Lough, Australian Institute of Marine Science, Townsville, Queensland (Corals, Coral Reefs and Communities, Coastal Ecosystems) Catherine Lovelock, Centre for Marine Studies/School of Integrative Biology, University of Queensland (Mangroves) Steve Oliver, Global Environmental Modelling Systems Pty Ltd (Coastal Infrastructure) Peter Riedel, Coastal Engineering Solutions (Coastal Infrastructure) Mary Voice, Cumulus Consulting, Melbourne, Victoria (Selected other coastal activities) Kevin Walsh, Associate Professor and Reader, School of Earth Sciences, University of Melbourne (Infrastructure, Coastal Water Resources) Michelle Waycott, School of Tropical Biology, James Cook University, Townsville seagrasses: Allyson Williams, Emerging Technologies, Department of Primary Industries and Fisheries, Queensland (Fisheries and Aquaculture)
Acknowledgements We wish to thank the many staff from the Department of Environment and Heritage (DEH) with whom we held useful discussions and who provided advice and information, and in particular, the staff from the Australian Greenhouse Office (AGO). Discussions held with staff of CSIRO, Geosciences Australia, etc, during the first national conference of the National Sea Change Taskforce, “SEA CHANGE 2006: Meeting The Coastal Challenge” Port Douglas, April 2006 and the adjacent AGO stakeholder workshop were also helpful. We would also like to thank David Blackburn, a coastal environment consultant, for helpful suggestions in the early planning stages of the project. Catherine Collier provided expert advice and assistance for the section on seagrasses. Anne Brewster gave helpful editorial advice. The review and suggestions to improve the report given by Professor Bruce Thom were greatly appreciated. Photographs used in this document are either supplied by contributing authors from their personal collections or with permission from their employing institution, or are public domain photographs. _____________________________________________________________________ Coastal Vulnerability Gaps Analysis – Australian Greenhouse Office
i
TABLE OF CONTENTS Part I: Executive and Technical Summaries Section 1 - Executive Summary…………………………………. 1 1.1 1.2 1.3 1.4 1.4.1 1.4.2 1.4.3 1.4.4 1.4.5 1.4.6 1.4.7 1.4.8
Introduction and purpose……………………………………………….….. 1 Features of the coastal zone, coastal systems and their drivers……………. 1 Characterising vulnerability to climate change……………………………. 2 Key issues and recommendations……………………………………….…. 3 Beaches and dune coasts…………………………………………………... 4 Estuaries……………………………………………………………………. 5 Australian coastal ecosystems of mangroves, seagrasses and saltmarsh....... 6 Australian coral reefs and coral communities…………………………........ 7 Coastal infrastructure and water resources ……………………………... 8 Fisheries and aquaculture………………………………………………….. 9 Selected other coastal activities……………………………………………. 10 General findings and common issues……………………………………… 12
Section 2 - Technical Summary…………………………………. 14 2.1 2.2 2.3 2.4 2.5 2.6 2.7 2.8 2.9 2.10 2.11 2.12 2.13
Introduction………………………………………………………………... 14 Beaches and dune coasts…………………………………………………... 15 Estuaries…………………………………………………………………… 17 Mangroves…………………………………………………………………. 19 Seagrasses………………………………………………………………….. 21 Corals and coral reefs……………………………………………………… 23 Coastal infrastructure and water resources………………………………… 25 Fisheries and aquaculture………………………………………………….. 27 Selected other coastal activities……………………………………………. 29 Suggestion for assessment process for Phase 1 vulnerability assessment…. 31 Key gaps to fill…………………………………………………………….. 32 Summary table for types of data (data classes) relevant to coastal vulnerability assessments………………………………………………….. 33 Technical Summary Conclusions………………………………………….. 37
Part II: Analysis for Coastal Zone systems and components CHAPTER 1: Introduction, background, methodology .......... 38 1.1 1.2 1.3 1.4 1.5
Context........................................................................................................38 Recent activity/work/summaries.................................................................38 Definitions and constraints .........................................................................39 Characteristics of the Australian coast.......................................................40 Methodology ...............................................................................................41
_____________________________________________________________________ Coastal Vulnerability Gaps Analysis – Australian Greenhouse Office
ii
CHAPTER 2: Beaches and sandy coasts................................. 43 2.1 2.2 2.3 2.4 2.5 2.6 2.7
Introduction.................................................................................................43 Methods for assessing impacts on beaches.................................................44 Brief review and identification of gaps.......................................................46 Gaps ............................................................................................................48 Climate-related thresholds ..........................................................................48 Data and research needs..............................................................................49 Feasible assessment options.......................................................................49
CHAPTER 3: Estuaries............................................................... 50 3.1 3.2 3.3 3.4 3.5
Introduction.................................................................................................50 Analysis of Climate Change on Estuaries...................................................50 Identification of gaps, including need for integrated assessment ...............51 Implications for Estuaries ...........................................................................52 Feasible assessment options........................................................................53
CHAPTER 4: Coastal ecosystems ............................................ 54 4.1 4.2 4.3 4.4
Mangroves and associated tidal wetlands ...................................................54 Seagrasses and seagrass communities ........................................................60 Corals and coral reefs..................................................................................64 Feasible assessment options – coastal ecosystems .....................................71
CHAPTER 5: Coastal water resources ..................................... 72 5.1 5.2 5.3 5.4 5.5 5.6
Introduction.................................................................................................72 Methods for Assessing Impacts on Coastal Water Resources ....................74 Implications for Coastal Water Resources..................................................74 Review of previous vulnerability studies....................................................74 Gaps and critical thresholds ........................................................................75 Feasible assessment options........................................................................76
CHAPTER 6: Coastal infrastructure ......................................... 77 6.1 6.2 6.3 6.4 6.5 6.6 6.7
Introduction.................................................................................................77 Methods for assessing impacts on infrastructure ........................................78 Brief review of previous vulnerability assessments and identification of gaps .............................................................................................................79 Planning issues and vulnerability assessment.............................................82 Climate-related thresholds ..........................................................................84 Data and research needs..............................................................................84 Feasible assessment options........................................................................86
CHAPTER 7: Aquaculture and fisheries .................................. 87 7.1 7.2 7.3 7.4
Introduction.................................................................................................87 Brief review of Fisheries and Aquaculture .................................................87 Assessing potential impacts of climate change on Fisheries and Aquaculture .....................................................................................................................90 Feasible assessment options........................................................................93
_____________________________________________________________________ Coastal Vulnerability Gaps Analysis – Australian Greenhouse Office
iii
CHAPTER 8: Selected other coastal activities..Error! Bookmark not defined. 8.1 8.2 8.3 8.4 8.5
Introduction.................................................................................................96 Methods for assessing impacts and identification of gaps..........................97 Climate-related thresholds ........................................................................100 Data and research needs............................................................................100 Feasible assessment options......................................................................102
Appendix A................................................................................ 103 The nature and type of vulnerabilities that are possible for the coastal zone. ..........103
Appendix B................................................................................ 104 List of acronyms .......................................................................................................104
Appendix C................................................................................ 106 References.................................................................................................................106
_____________________________________________________________________ Coastal Vulnerability Gaps Analysis – Australian Greenhouse Office
iv
Part I: Executive and Technical Summaries Section 1. Executive Summary 1.1 Introduction and purpose This report forms part of the planning and preparation by the Australian Greenhouse Office (AGO) for an assessment of vulnerability to climate change of the Australian coastal zone, under the umbrella of the National Climate Change Adaptation Programme (NCCAP). The purpose of the report is to: 1. provide a concise summary of the extent of knowledge (including gaps) of: • methods for assessing potential impacts of climate change on coastal systems; • the data required to conduct such assessments; • scientific understanding of the sensitivity of coastal systems to climate change, including climaterelated thresholds; and 2. identify and prioritise research needs that will lead to a feasible and practical vulnerability assessment within a reasonable timeframe. The report has two parts with Part I providing an Executive Summary and a Technical Summary and Part II providing the detailed analysis for the various coastal systems and components.
1.2 Features of the coastal zone, coastal systems and their drivers If we consider the coastal zone to include the coastline, nearshore reefs, nearshore islands, nearshore parts of the continental shelf, estuaries, tidal flats, coastal sand dunes and the coastal land margin, then features of the Australian coastal zone include: • • • • • • • •
over 80% of Australia’s population most of the top tourist destinations, world heritage sites and national heritage sites around 1000 estuaries of which more than a quarter are modified by human activity or habitation Seven capital cities Globally significant ecosystems including coral reefs, mangroves and seagrasses Many “seachange” shires and councils and 36 Natural Resource Management (NRM) regions The conduit to our export economy A significant percentage of Australia’s water resources.
The potential impacts of climate change on coastal systems are many (see box). In addition, Australians have been moving a significant portion of their assets to slightly more hazard prone areas within the coastal zone. Examples of the possible impacts and potential vulnerabilities for a typical inhabited coastal regime are
Potential impacts of climate change on coastal systems • Sea level rise and shoreline erosion • Changes in wind and wave climate causing changes in local erosion rates • Increased coastal flooding caused by higher mean sea levels • Increased salt water intrusion into aquifers • Changes to streamflow caused by changes in runoff rates • Progressive inland migration of coastal ecosystems such as mangroves & saltmarshes • Increased coral bleaching events due to rising water temperatures • Changes to ocean chemistry affecting ability of corals and other marine calcifiers to produce their skeletons (for corals this would make reefs less robust to the forces of erosion) • Increased frequency and/or intensity of tropical cyclones and associated storm surges • Changes to ecosystems within or surrounding protected areas.
_____________________________________________________________________ Coastal Vulnerability Gaps Analysis – Australian Greenhouse Office
1
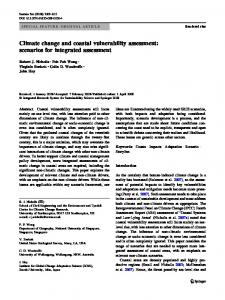
illustrated in Figure 1. The illustration is for a reasonably typical coastal regime in a tropical location with a seaside town located adjacent to a sizeable river and its associated estuarine-wetland system. Many of these impacts can also be caused by processes other than global-warming induced climate change, for example by seasonal to decadal climate processes or by human population pressures. Other possible contributors to coastal change are biophysical processes such as natural vegetation life cycles and normal physical interactions between the coast and the sea. Many changes to the coastal zone are natural in origin. A vulnerability assessment would need to keep this in mind, particularly when attributing cause of past observed changes. It should be designed to assess any increased vulnerability related to recently observed global warming and that anticipated in the reports of the Intergovernmental Panel on Climate Change (IPCC). Figure 1. Illustration of potential vulnerabilities to climate change impacts of a typical, tropical inhabited coastal regimei. This diagram also gives an indication of the dynamic nature of the coastal zone and the potential for multiple stresses. Note: Text rectangles describe the coastal systems illustrated, while text ovals indicate the potential climate change impacts.
Atmosphere
Wind/storm shifts Seagrass impacts
Coral Reef/Pelagic Ecosystem Coral bleaching, shrinking
Altered wave/beach regime
Harbour changes
Urban Ecosystem
Urban intrusion Urban flooding
Insect vectors(+ or -)
Urban water supply and water quality (algal blooms)
Current and fisheries changes
T, pH changes
Mangrove habitat loss
Saltwaterfreshwater interface
Ocean
Land Coastal vegetation and parks ecosystems Growth and stress changes
Estuarine/Wetland Ecosystem Runoffsediment balance
1.3 Characterising vulnerability to climate change Vulnerability A coastal community, ecosystem, economic unit or industry is vulnerable to climate change if it is susceptible to, or unable to cope with, the adverse effects of climate change impacts. The degree of vulnerability depends both on the magnitude of impact and on the amount, importance and value of the resources at risk. Three concepts are useful in characterising this vulnerability: • Slowly accumulating impacts (e.g., the rainfall decline over recent decades in parts of southern Australia and the consequences for urban water supply); • The capacity of a system or individual to cope; • Thresholds associated with extreme events (e.g. corals bleach above a known temperature, damage to buildings occurs when storm winds exceed design standards, as occurred for many older buildings in Innisfail with Tropical Cyclone Larry in 2006, etc.). Thus, to assess overall vulnerability, it is important to consider impacts of both slow change and change in extreme events.
_____________________________________________________________________ Coastal Vulnerability Gaps Analysis – Australian Greenhouse Office
2
A full assessment of vulnerability requires consideration of the economic and social value of the goods and services, infrastructure or ecosystems at risk; combined with an assessment of resilience of the communities or ecosystems. The first requirement, however, is to identify and map the various components considered vulnerable and assess their respective risk of being impacted by climate change. Prior knowledge and expert assessment of the susceptibility of systems and the values at risk should enable selection for highest priority in assessment and thus a focused assessment process. Links between system complexity and the assessment process Many of the dynamics and ecosystem functioning of the coastal zone are complex, subject to biophysical, human pressure and climate variability and change drivers. Climate change impacts do not occur in isolation from the other drivers. Development of a national coastal zone vulnerability assessment also needs to be guided by the amount and quality of information available for the various coastal components, as well as by the current level of confidence and uncertainties in climate projections. This leads to consideration of a staged approach, with a first pass national vulnerability assessment over, for example, 12 to 24 months concentrating on identification, categorisation and mapping of coastal components and risks. A subsequent more comprehensive assessment may undertake more systems modelling and socio-economic assessment. This is Part I of a two part report. Part I provides an Executive Summary followed by a Technical Summary in which the concept of a staged approach to a vulnerability assessment is described, along with summary suggestions for feasible approaches. Further information, detailed analysis and relevant sources can be found in “Part II: Analysis for Coastal Zone systems and components”.
1.4 Key issues and recommendations A set of criteria may be useful to assist the design of a national vulnerability assessment, including differentiation of undertakings for first pass and second pass assessments. Criteria for setting priorities should include: •
results of the studies should be nationally or at least regionally relevant and important;
•
availability of data (or identification of critical data that need to be refined or additionally collected);
•
availability of feasible methodologies that do not require massive research and development;
•
availability of expertise;
•
prior knowledge of vulnerability of particular ecosystems (e.g. reefs to bleaching), and
•
community relevance of and pressures for assessments (e.g. beaches in the Gulf of Carpentaria may not require first pass assessment at this time, but those of Gulf St Vincent would).
These criteria have underpinned considerations in the preparation of this report. Nevertheless, the criteria and the further planning for the vulnerability assessment may benefit from further refinement in consultation with stakeholders. In the following pages, each system to be considered in a vulnerability assessment is presented in a standalone layout format with cross-referencing to the tables in the Technical Summary and to the relevant chapters in Part II. It should be noted that the recommendations in the following pages relate to the proposed first pass vulnerability assessment. Suggestions for a second pass (subsequent) vulnerability assessment are supplied in the Technical Summary.
_____________________________________________________________________ Coastal Vulnerability Gaps Analysis – Australian Greenhouse Office
3
1.4 Key issues and recommendations for coastal systems and components 1.4.1 Beaches and dune coasts For additional information and analysis Technical Summary Part II
Cross-reference for beaches Tables 2a and 2b Chapter 2
Half of the Australian coast is sandy comprising 10,685 individual beaches, many of which are important for tourism, recreation and residential development. Coastal population growth is placing further pressure on some beaches and dune coasts. Development approvals near beaches need to consider insurance risks and future liability for approving authorities. Vulnerability of beaches depends upon rates of sea-level rise, coastal erosion and frequency of extreme events. Sea-level rise is a major factor in beach profile re-adjustment but sediment supply and altered wave environments are also important. Increased tropical cyclone wind speeds, possible changes to east coast lows, more frequent storm surges and increased heavy rainfall events will all impact on beaches. Some beaches are mobile and relatively vulnerable to these forces, while others are less vulnerable to moderate climate change. The character and mechanics of beach change has been extensively studied in Australia in recent decades and good expertise exists. Nevertheless, assessment of vulnerability to climate change of beaches requires highresolution digital bathymetric and elevation data, which currently does not exist for much of the coastline.
Key findings / research directions •
•
•
Estimates of vulnerable beaches can be made using geomorphological mapping and knowledge of standard sea-level response models; More expensive detailed vulnerability assessment requires modeling based on bathymetric and terrain elevation data, sediment supply and wave data; Greater vertical precision is required for digital data input to bathymetric and elevation models.
Recommendations • •
•
Historical aerial photographical data should be compiled to provide baseline data on shoreline change; Accurate surveys of coastal bathymetry and terrain elevation could be completed using laser altimetry but this is expensive and survey areas will need to be prioritised; A broad assessment is suggested at the national scale and more detailed assessment for high priority beaches (high value, known significant risk).
_____________________________________________________________________ Coastal Vulnerability Gaps Analysis – Australian Greenhouse Office
4
1.4.2 Estuaries For additional information and analysis Technical Summary Part II
Cross-reference for estuaries Tables 3a and 3b Chapter 3
Australia’s approximately 1000 estuaries are often highly productive coastal areas that provide shelter and breeding grounds for many commercially and recreationally important fish, crustacea and shellfish. Estuaries are also important for recreation and as a place for human settlement. Thus estuaries are important for coastal economies. A significant proportion of Australian estuaries are currently modified or severely modified by human activities. Incorporating understanding of climate change impacts into management for healthy estuaries will be of economic and ecological benefit to Australia. Estuaries will be particularly vulnerable to changes in river runoff which may affect the water balance and associated hydrological features of individual estuary types. Estuaries are also vulnerable to altered nutrient loads, warming sea temperatures, sea level rise and associated salt-water intrusion and storm surges. Any vulnerabilities that lead to degradation of estuary health may flow on to affect other ecosystems such as fisheries or coral reefs. Monitoring of biological, chemical and physical variables can enable detection of important changes in estuaries, but often multiple stresses have been operating over decades, so determining cause and effect is challenging. Determining vulnerability to future change in already stressed estuaries may require consideration of multiple stresses including those from climate change.
Key findings / research directions •
• •
Estuaries are complex systems and limited knowledge of the historical and current state of estuarine ecosystems will challenge our ability to identify and discriminate natural variations and climate-change induced impacts; Improvement in vertical resolution of digital elevation models is required, including detail of bathymetry within estuaries; Information contained in the National Land and Water Resources Audit Estuary Assessment 2002 (NLWRAEA) and the associated Ozestuaries website (http://www.ozestuaries.org) provides collated resources which can be augmented with data that may be available at a State or regional level to underpin a vulnerability assessment.
Recommendations •
•
•
Supplement NLWRAEA and Ozestuaries information with local data and an image database to assist in priority setting for the assessment and also in the assessment of relative vulnerabilities; Use a range of existing physical process and ecological models to assess impacts of sea level, sea surface properties and temperature for key estuary types and key locations; For representative and key estuaries, develop a process to identify implications for human health (e.g. insect vectors), tourism, urban water supply, ports and harbours functioning, mangroves, seagrasses and discharge to oceans for potential impact on fisheries, coral reefs or other relevant ecosystems.
_____________________________________________________________________ Coastal Vulnerability Gaps Analysis – Australian Greenhouse Office
5
1.4.3 Australian coastal ecosystems of mangroves, seagrasses and saltmarsh For additional information and analysis Technical Summary Part II
Cross-reference for coastal ecosystems Tables 4a and 4b, 5a and 5b. Chapter 4
Australia has some globally unique and important coastal ecosystems that could be stressed or experience dislocation under climate change. Mangroves, seagrasses and saltmarsh are very important habitats for functioning marine food chains and they support important industries. Mangroves and seagrass provide sediment binding and other stabilizing properties and mangroves are a small but significant carbon storage reservoir. Seagrasses are a habitat and food source for threatened species such as turtles and dugong. The vulnerability of these ecosystems varies around the coast and with species, and depends on rainfall and runoff changes as well as standard climate change variables, but productivity and range could be negatively affected. Key climatic variables for these coastal ecosystems are air and sea temperatures, sea level, rainfall and river flow (and associated discharge of nutrients and particulates), tropical cyclones and severe storms and ocean chemistry.
Key findings / research directions • Vulnerability of seagrasses, mangroves and saltmarsh to climate change is moderately understood, but these ecosystems provide habitats for many related organisms whose vulnerability is little known; • A few regions have been well studied and monitoring programs exist, but large areas of the coast are poorly studied and do not have routine ongoing monitoring programs • An assessment of vulnerability for the Great Barrier Reef (GBR) ecosystem and its constituent organisms is being prepared by the Great Barrier Reef Marine Park Authority (GBRMPA) and AGO to be published in 2007. Using this report as a benchmark, similar assessments are required for other key coastal ecosystems; • Much of the relevant ecological information is available but is scattered and needs to be collated in one location; • Further development of existing models or methods in order to assess combined impacts of sea-level rise and temperature change (and light availability for seagrasses) on the different seagrass, mangrove and saltmarsh communities would be very useful.
Recommendations • Broad-scale mapping of key variables (including distribution, relevant nearby ocean conditions, key climate parameters, nearby population, nearby land use, nearby ecosystems) in formats that can be easily overlaid would permit assessment of relative risks and indications of interactions between stressors; • A one-stop web resource of relevant information including reports, publications, maps, and local, state and federal data should be developed, and could include recommendations for nationally consistent data management protocols and enable data and information exchange; • Consideration should be given to including case studies, similar to the GBR assessment noted in the first column, for other critical locations.
_____________________________________________________________________ Coastal Vulnerability Gaps Analysis – Australian Greenhouse Office
6
1.4.4 Australian coral reefs and coral communities For additional information and analysis Technical Summary Part II
Cross-reference for coastal ecosystems Tables 6a and 6b. Chapter 4
Australia has globally unique and important coral communities and coral reefs that could be stressed or reach critical loss thresholds under climate change. Government management of world heritage coastal ecosystems for the future needs to factor in climate change impacts. Corals, coral reefs and coral communities occupy a large part of our marine coastal zone and are immensely important to tourism and the local marine ecologies. They support several important industries including fisheries and tourism. There are very important sea-surface temperature thresholds for coral bleaching and associated moderate-to-long-term damage. A key climatic variable for corals and coral reefs is sea temperature, but rainfall and river flow, tropical cyclones and severe storms, ocean currents, waves and ocean chemistry are also important.
Key findings / research directions • Although vulnerability of corals to climate change is relatively well known, the reef environment provides habitat for many related organisms whose vulnerability is little known; • An assessment of vulnerability for the Great Barrier Reef (GBR) ecosystem and its constituent organisms is being prepared by the Great Barrier Reef Marine Park Authority (GBRMPA) and AGO to be published in 2007. Using this report as a benchmark, similar assessments are required for other key reef areas, enabling classification of reefs by type and vulnerability; • The broader ecological information relevant to reef functioning around Australia needs to be collated; • Overlays of information to assess impacts on reefs from likely changes in the key climatic variables, identify possible refugia, etc would be very useful.
Recommendations • Broad-scale mapping of key variables (including distribution, ocean conditions, key climate parameters, nearby population, nearby land use, nearby ecosystems) in formats that can be easily overlaid would permit assessment of relative risks and indications of interactions between stressors; • A one-stop web resource of relevant information including reports, publications, maps, and local, state and federal data should be developed; • Consideration should be given to including case studies, similar to the GBR assessment noted in the first column, for other critical locations.
_____________________________________________________________________ Coastal Vulnerability Gaps Analysis – Australian Greenhouse Office
7
1.4.5 Coastal infrastructure and water resources For additional information and analysis Technical Summary Part II
Cross-reference for infrastructure and water resources Tables 7a and 7b Chapter 5 and 6
Coastal infrastructure includes buildings, roads, powerlines, cables, pipes, maintained parklands, coastal defence works, ports and harbours. Coastal water resources include waterways, water supply systems, sewerage systems, drainage systems and natural water systems. The vulnerability of existing coastal infrastructure depends upon rates of coastal erosion and the frequency of extreme events, both of which are projected to increase in some locations. Changes that may occur to extreme events in a warmer world include increased tropical cyclone wind speeds, more frequent storm surges and increased heavy rainfall events. Sea level rise will alter the position of the coastline and needs to be assessed through the use of very accurate elevation data, which largely does not exist along the coastline at the required accuracy. The vulnerability of some infrastructure also depends on the design standards in place at the time of construction and the planning codes employed. Increasing population growth within the coastal zone will continue to place pressure on coastal water resources, while runoff is projected to decrease in many locations nationwide due to climate change. There have been several recent studies of the future of water resources in Australia’s large coastal urban areas which provide important background for the proposed vulnerability assessment.
Key findings / research directions • • •
•
•
Improvement in vertical resolution of digital elevation models is required, including coastal ocean depths; Climate change effects are often not incorporated in local planning schemes; It is unclear how well buildings are designed to resist strong wind events, which may become more frequent in some regions in the future; Recent water strategy documents have considered the need for adaptations to the effects of climate change on water resources (separately from the issue of population pressures). They indicated that for most urban locations, management and water conservation could minimise the need for further infrastructure over the next few decades, but additional infrastructure may be necessary beyond this timeframe. Exceptions may be southeast Queensland, the Perth region and possibly Sydney. It is not clear, though, whether consistent assumptions have been made among the various studies. Many rural coastal regions are likely to experience decreases in annual runoff, which may affect local water supplies.
Recommendations • •
• •
• •
•
•
Laser altimetry is a preferred method for determining coastal elevations and water depths accurately, although the cost is high; Review existing submarine infrastructure (such as pipelines) to determine whether design has adequately incorporated the possible effects of climate change; Survey relevant professional associations to determine the current vulnerability of stormwater systems; A national audit of local planning and management policies should be undertaken to determine how climate change effects have been incorporated; A catalogue of historical aerial photography should be compiled to determine the historical rate of shoreline change; An assessment of infrastructure vulnerability to changes in wind speed should be undertaken by comparing wind speed changes to the existing wind speed design standards; A survey of existing building stock within 100 km of the tropical coastline should be undertaken to determine its vulnerability under higher tropical cyclone wind speeds; Consistent national assessment of infrastructure requirements for water resources is needed.
_____________________________________________________________________ Coastal Vulnerability Gaps Analysis – Australian Greenhouse Office
8
1.4.6 Fisheries and aquaculture For additional information and analysis Technical Summary Part II
Cross-reference for fisheries and aquaculture Tables 8a and 8b Chapter 7
The value of Australian fisheries production was about $2 billion in 2003-2004, and there has been a rapid growth in aquaculture production in recent years. Significant export income and local industry development require adequate planning for any climaterelated vulnerability. Fish harvesting occurs all around the Australian coastline, and fluctuations in fish stocks are known to be influenced by various factors that are climate-related. However, the impact on fish of changes in their habitat caused by climate change has only been established for a few species. Aquacultures include production of shellfish, crustacea, fish and pearls and while environments can sometimes be more controlled, diseases, water quality, water temperature and storm damage can still be sources of vulnerability. Since many of the responses to and sensitivity to the various climate change factors are highly species dependent, and since the degree of sensitivity is understood for only a few species, a vulnerability assessment of fisheries resources could be a large task.
Key findings / research directions • • • •
Few assessments have been made of the effect of climate change on Australian fisheries and aquaculture; A large number of species is utilised for commercial fisheries and sensitivity to climate parameters is species dependent; Sensitivity to climate parameters has been established for only a limited number of species; Aquaculture seeks to optimise environmental conditions for production, including site selection. Some knowledge is available on different optimal conditions for different species, but the various industry vulnerabilities have not been assessed.
Recommendations • •
More information is needed on the climate sensitivity of fisheries species; A vulnerability assessment would best be focused on those species with known climate sensitivity.
_____________________________________________________________________ Coastal Vulnerability Gaps Analysis – Australian Greenhouse Office
9
1.4.7 Selected other coastal activities
For additional information and analysis Technical Summary Part II
Cross-reference for Selected other coastal activities Tables 9a and 9b Chapter 8
The selected “other” coastal activities are protected areas, tourism and human health and safety. While there are significant governance and jurisdictional issues that may need to be addressed when considering capacity to adapt to climate change, they were beyond the scope of this report and may be considered for later vulnerability studies. Protected areas (wetlands, marine areas, national parks, national heritage and world heritage sites) within the Australian coastal zone and territorial waters provide tourism income, fisheries breeding grounds, ecosystem and economic goods and services, habitat protection and protection of historical or iconic locations. Human health and safety of individuals and communities in the coastal zone can be impacted by changes to temperature, humidity, storms, sea level, floods or droughts. The magnitude of health impacts will be influenced by local environmental conditions and social behaviors (resilience), and the range of possible adaptations by individuals or communities - these would need to be included for a comprehensive assessment. High value tourism operates in the coastal zone, including World Heritage sites such as the Great Barrier Reef and Kakadu National Park. Tourism risk relates to actual and perceived degradation of tourism sites and risks to infrastructure that supports tourism. The importance of Australia’s coastal tourism industry needs factoring in to a national coastal vulnerability approach. The tourism industry depends heavily on some key iconic beaches and key protected areas (such as the Great Barrier Reef [GBR]) and in turn those protected areas support vast coastal natural resources. The vulnerabilities to climate change of coastal tourism, protected coastal parks and marine areas, human health and safety are mostly linked to vulnerabilities in infrastructure, beaches and natural systems and so an assessment will draw heavily on assessments for those systems.
_____________________________________________________________________ Coastal Vulnerability Gaps Analysis – Australian Greenhouse Office
10
Key findings / research directions
Recommendations
Protected areas: • The methods for assessing impacts are basically the same as for other non-protected geographic areas (beaches, coastal environments and coastal infrastructure); • More detailed visitor information would be useful; • Priorities are to digitise detailed maps, assess the need for flora and fauna corridors, and to improve the assessments of viability of ecosystems as a function of size; • System-wide impact assessments may require a coordinated study over a longer term, including more extensive ongoing monitoring; • Significant thresholds are mostly linked to sea level rise, possible large shifts in the salt-fresh water interface, or sea surface temperature (the latter being particularly crucial for corals).
Protected areas: • It may be possible to develop vulnerability assessments for flora and fauna of protected areas using existing biological-climate models; • Broad estimates of potential partial loss of protected areas due to sea level rise could be obtained using GIS techniques, complemented by use of existing estuary models; • In principle, social and environmental values could be identified for listed heritage places, and compilation of these could be undertaken with the aid of tools such as GIS and protected species data bases.
Human health and safety: • Recent major studies on climate change and human health provide a national perspective, already contain useful national maps and can, therefore, form the basis for a vulnerability assessment; • More detailed information may be needed on disease vectors (insects, etc.) in the coastal zone; • For human health and safety, thresholds relate to events that overload the health/hospital system, events that exceed building design or coastline setback standards and hence put lives at risk, and introduction/generation of large new health risks (e.g. endemic malaria). Tourism: • Critical thresholds for tourism relate to thresholds that significantly reduce tourism economic activity (loss of beaches or iconic destinations, reduction in coral reef size, perceived degradation of “eco-values”, health or safety concerns [e.g. about more severe tropical cyclones] by tourists); • Recent studies of climate change and assessment of risk for tourism have been regional, local or feature-specific in focus. A national approach could assess the tourist-based industries, tourist sites and tourist-related infrastructure that have the highest economic value.
Human health and safety: • A useful first pass assessment of vulnerability to health risks within the coastal zone could be developed by combining data from recent climate change and health studies with expert assessments and mapping (the latter would need to cover potential infrastructure damage, flood risk, estuarine intrusion, potential distribution changes to disease vectors such as mosquitoes, etc); • More research is needed to gain more specific information on thresholds that would stress the health system or lead to safety concerns. Tourism: • Collect and refine tourism and tourismrelated infrastructure data; • Use vulnerability assessments from other sectors (beaches, infrastructure, water resources, coastal ecosystems) to assess impacts on the high profile, high value tourist destinations.
_____________________________________________________________________ Coastal Vulnerability Gaps Analysis – Australian Greenhouse Office
11
1.4.8 General findings and common issues For additional information and analysis Technical Summary
Cross-reference to: Tables 10, 11 and 12
This report (comprising Parts I and II) shows that sufficient data and high-quality expertise exist in Australia to undertake a preliminary ‘first pass’ assessment in a relatively short timeframe. It is also clear that large data gaps exist for compilation of detailed vulnerability studies and therefore this report suggests a phased approach. For a ‘first pass’ assessment, there is a need to compile nationally consistent, accurate and readily available data sets, as well as the relevant metadata and to improve the accuracy of coastal elevation data. For ecosystems, interactions between the components make vulnerability assessment complex and more research is needed on both natural change and that induced by climate change. More work is also needed to understand multiple stresses and their interactions. It is suggested that essential preparations for a more comprehensive vulnerability assessment include: • Improvement in understanding of the impact of climate extremes and the thresholds of vulnerability of all systems under consideration; • Improved/new valuations of ecosystems and their productivity; • Improvement of a range of ecological models; • Compilation of relevant socio-economic information; and • Extension and expansion of the expertise developed for key ecosystems or in key centres (such as the studies of the Great Barrier Reef or within Cooperative Research Centres or Australian Research Council Centres of Excellence) to other ecosystems around the coast. It is worth considering how these may be commenced/upgraded in preparation for a second-pass vulnerability assessment. Many researchers have been working on new remote sensing applications to monitor coastal ecosystems and map features such as mangroves, seagrass, algal blooms, and water quality indicators. Satellite systems have improved over time and a major concern in using remote sensing technologies to detect change has been temporal stability of the output from observing instruments and processing algorithms. In future, as homogeneous timeseries and datasets become available, these technologies should be among the primary tools for coastal vulnerability assessments. It is suggested that, for a first pass vulnerability assessment, the key gaps to fill that are relevant across many of the systems or components are: • Improved accuracy for shoreline position and near-shore elevation; • Digital elevation matched to near-shore digital bathymetry (improve homogeneity between data sets); • A collated set of visual records (primarily historical and recent aerial photography and satellite images) for beaches, dunes, estuaries, river outlets and past storm damage; • Refinement of the current understanding of the drivers of coastal change particularly relevant to the Australian region, and in particular the impact of extreme events and episodes; _____________________________________________________________________ Coastal Vulnerability Gaps Analysis – Australian Greenhouse Office
12
• A survey of the national status of planning schemes and local ability to use climate change information in planning; • A coordinated national coastal zone assessment of historical physical damage and damage costs from extreme events to underpin the same assessment of damage and costs from potential future changed regime of extremes; • A common set of information for the coastal ecosystem (knowledge status, economic value, who looks after/has responsibility for coastal segments and ecosystem components and who conducts research). This should include consideration of development and expansion of the concept of a central OZCoasts Portal for information and data exchange and decision support. An agreed set of data management protocols for the many coastal datasets and progress to implementing these would contribute substantially to consistency in the outputs of the vulnerability assessment. Finally, a coordinated process would be needed for a vulnerability assessment that takes a staged approach and plans a first pass assessment within a 1-2 year time-frame. The Technical Summary suggests a feasible process to assess the main systems and components and then give some consideration to interactions between systems where relevant or significant. It is also suggested that a first pass assessment concentrate on production of a set of maps, data sets and expert assessments.
_____________________________________________________________________ Coastal Vulnerability Gaps Analysis – Australian Greenhouse Office
13
Section 2. Technical Summary 2.1 Introduction to Technical Summary This work forms part of the planning and preparation by the Australian Greenhouse Office (AGO) for an assessment of vulnerability to climate change of the Australian coastal zone. The report has two parts: “Part I: Executive and Technical Summaries” and “Part II: Analysis for Coastal Zone systems and components” with the latter providing the detailed analysis and relevant sources. The methodology employed in the project involved compilation of vulnerability matrices for each sector, in order to identify the main climate drivers. A brief review of previous work performed on vulnerability assessment in each sector helped identify available options for data sources, methods and models that could be used in a nationally focused vulnerability assessment. Gaps in previous research and data were also identified, as well as crucial climatic thresholds where known and/or understood. Recommendations are made regarding the form of an initial national assessment of vulnerability of the coastal zone to climate change. The technical summary section encapsulates the nature of each of the systems under consideration for inclusion in a national assessment of vulnerability. Table 1 lists the components examined and their chapter number in Part II of the report. In the following pages, each system is presented as a two page spread with the first page identifying key characteristics of the system, what is known about potential vulnerability, and some basic information on expertise and gaps. The second page indicates what a first pass vulnerability assessment might look like – its contents and feasible options, along with an indication of what may be needed to complete a subsequent more comprehensive assessment (second pass). Each two page spread contains two tables, labeled Table 2a and 2b, and so on. This synthesis of the analyses for the systems is followed by a summary (Table 10) which shows how the assessment of the various components could be integrated. A coastal zone vulnerability assessment is a large task requiring consideration of many systems/components, some of which are interdependent. In order to provide practical and usable output in a reasonable timeframe, a phased approach is suggested. The Technical Summary tabulates basic requirements for two suggested phases, with the Second Pass suggestions being indicative only. While data and methodology gaps can be found for all systems and components, there are a few key gaps that are relevant to the overall success of a first pass vulnerability assessment. These are summarised in Table 11. Data are the foundation for a robust vulnerability assessment. A summary of relevant data classes and their status for vulnerability assessment work is provided in the last table of the technical summary (Table 12). Table 1. The components reviewed for this gap analysis Components Beaches and Dune Coasts Estuaries Mangroves, Saltmarshes and associated Tidal Wetlands Seagrasses Corals and coral reefs Water resources Infrastructure Fisheries and aquaculture Protected areas Tourism Health and safety
Code B E M
For detailed description in Part II of the report: Chapter 2 Chapter 3 Chapter 4
S C W I F P T H
Chapter 4 Chapter 4 Chapter 5 Chapter 6 Chapter 7 Chapter 8 Chapter 8 Chapter 8
Note: all acronyms and abbreviations in the following tables are supplied in an Endnote at the end of Part I. All author references are supplied in Part II of the report. _____________________________________________________________________ Coastal Vulnerability Gaps Analysis – Australian Greenhouse Office
14
Table 2a. BEACHES AND DUNE COASTS Current knowledge on vulnerability - summary (Sensitivity = L/M/H low/medium/high Confidence = W/M/G weak/moderate/good) Climate Likely impact Sensitivity Known thresholds change assessment and driver confidence Extreme storms
-Significant erosion of beach and backing dunes or land -Loss of beach and erosion buffer
H
G
M
G
-Loss of beach width and beach amenity -Potential erosion of backing dunes or land and inundation -Loss of erosion buffer for storms
H
G
M/L
G
M/L
G
-Intrusion of saline water into freshwater sandy aquifers -Loss of beach width and beach amenity -Elevated impact of waves and inundation
M
G
H
G
H
H
-Impact on coral beaches with increased bleaching events
M
G
M
G
-Alteration of interdidal biotic and chemical processes, -Altered vegetation coverage of sand coloniser plants
L/M
L/M
L/M
M
Reduced rainfall
-Reduction in coastal sediment supply -Altered vegetation coverage of sand coloniser plants.
M M
G G
- Threshold not known, depends on local conditions
Enhanced rainfall
-Increase in coastal sediment supply -Altered vegetation coverage of sand coloniser plants.
M M
G G
- Threshold not known, depends on local conditions
Increased waves and wind
KEY CHARACTERISTICS - Largest category of coastline - Some beaches mobile and vulnerable, others less vulnerable to moderate climate change SCALE - Half the coast is sandy - 10,685 individual beaches - 15 morphological types - Climatic influence on beach materials VALUES - Some beaches iconic value - Beaches high tourism value - Beaches high amenity value - Some beach dune systems of high habitat and conservation value
Rising sea level
Increased sea temperature
Increased air temperature
_____________________________________________________________________ Coastal Vulnerability Gaps Analysis – Australian Greenhouse Office
Beach response to sea-level rise
-Frequency and intensity of storm events impacts on beach recovery times -Some beaches may erode beyond point of recovery -Wave energy flux calculations indicate sediment transport capacity
-Depends on local aquifer -Bruun rule provides ratio of sea-level rise to metres of erosion (applicability limited) 0.8 degree rise (approx) causes mass bleaching, 2-3 degree rise causes coral death - Threshold not known
CATEGORISATION OF KNOWLEDGE *Excellent understanding of morphodynamics of different beach types * Good overall understanding of beach processes and sedimentation EXPERTISE AND DATA (WHO/WHAT/WHERE) * Good expertise available from coastal scientists (universities, GAii, CSIRO) * Engineering data and historical photogrammetry – most resides locally, not nationally connected
15
Table 2b. BEACHES AND DUNE COASTS: Summary of methodologies and technical requirements
First Pass Assessment
Second Pass Assessment
Synthesised from Chapter 2 of Part II (for references, refer to relevant chapter in Part II) Feasible approaches Data collection Information on beaches Models and case studies to identify impacts Information Systems: National scale National scale National scale - Databases/metadata - Geomorphic mapping - Aerial photography - Indicative assessment using basic - Geomorphic mapping - Australian beach safety - Satellite data Bruun-Rule principles - Sharples (2004) ‘first pass’ data base (Sydney - Wind/wave data indicative assessment approach University, Prof Short) - Tidal data (NTCiii) - LOICZv typology - Demographic data Regional/Local scale (subset Regional/Local scale - Improved data for study) - Requires either existing DEMiv - Only feasible to conduct more coastal geomorphic - Morphological behaviour model detailed modeling studies for high Regional/Local scale mapping (with detail on (Cowell et al 1995) priority beaches (iconic or already fundamental vulnerability - GISvi-based model (Hennecke et al vulnerable) - Beach profile data factors for coastal - Wave energy 2004) - Socio-economic valuations of flux/sediment transport hazards) or availability of - Stochasitic simulation model selected beaches aerial photography to data (Cowell et al 2006) complete gaps - Past change data National scale - Detailed national DBDEMvii - National GIS database for population, housing and infrastructure near coast Regional/Local scale - State-based data
National scale - Second pass indicative assessment Regional/Local scale - Morphological behaviour model (Cowell et al 1995) - GIS-based model (Hennecke et al 2004) - Stochasitic simulation model (Cowell et al 2006)
National scale - Second pass assessment with incorporating selected detailed regional modelling Regional/Local scale - Extend detailed morphological/GIS based modeling to key vulnerable beaches identified from first pass assessment
- CoastClim and CVIviii model validation _____________________________________________________________________ Coastal Vulnerability Gaps Analysis – Australian Greenhouse Office
16
Table 3a. ESTUARIES Current knowledge on vulnerability - summary (Sensitivity = L/M/H low/medium/high Confidence = W/M/G weak/moderate/good) Climate Likely impact Sensitivity Known thresholds change driver assessment and confidence Rising sea level
KEY CHARACTERISTICS - Interface between land catchments and coast. - Unique (endemic) biodiversity of flora & fauna. SCALE - Around 1000 estuaries. - Only 50% are considered in nearpristine condition.
- Increased inundation. - Increased erosion and sedimentation.
Sea level rise – salinity incursions
- Changes in marine and estuarine vegetation diversity and coverage i.e. increase in mangroves and seagrasses, loss of reeds and rushes. - Change from estuarine endemic to marine fauna
Storm surge
- Increased saltwater inundation. Increased erosion.
Hydrological change/flow
- Altered nutrient and sediment budgets. Altered vegetation extent and coverage. Change from estuarine to marine fauna
Rainfall/runoff/ turbidity changes
- Reduced environmental flow – increased salinity. - Restriction in use and distribution of estuarine fish species. - Increased or reduced sedimentation depending on increase or decrease in rainfall. - Altered vegetation coverage. - Altered productivity and bio diversity - Increased sedimentation. - Reduced productivity. - Altered vegetation coverage.
VALUES - Productive ecosystems sustaining coastal ecology and fisheries. - Important for recreation and as a place for settlement. Shoreline erosion Increased water and air temperatures
- Productivity changes - Diversity changes - Increased potential for pest invasion.
_____________________________________________________________________ Coastal Vulnerability Gaps Analysis – Australian Greenhouse Office
H
G
H
G
M/H
M
M/H
G
H
G
M/H
M
M
W
- Loss of estuarine vegetation species. - Landward migration of vegetation. - Linked to saltwaterfreshwater interface
- Increased occurrence of water stratification. - Increased occurrence of high salinity levels. - Loss of estuarine vegetation species. - Increased occurrence of water stratification. Reduced flushing of stagnant salt wedge types - Loss of estuarine vegetation species. - Increased nutrient enrichment - high eutrophication levels.
- Shallowing of estuary bathymetry.
CATEGORISATION OF KNOWLEDGE * Moderate understanding of ecosystem function * Weak on estuarine water quality and processes * A few estuaries well studied, others not * Multiple stress (stresses on estuaries from a number of pressures) poorly understood EXPERTISE AND DATA (WHO/WHAT/WHERE) * Much data resides locally, not nationally connected * Limited systematic data – Ozestuariesix & NLWRx Estuaries Audit, 2002. * Good expertise available in universities, AIMSxi, State and Local Government agencies. GA
- Loss/change in distribution of estuarine vegetation. - Presence of marine pest species – thresholds mostly unknown
17
Table 3b. ESTUARIES: Summary of methodologies and technical requirements
First Pass Assessment
Second Pass Assessment
Synthesised from Chapter 3 of Part II (for references, refer to relevant chapter in Part II) Data collection Information systems for Models and case studies to identify Feasible approaches estuaries impacts - Tidal and water quality models - Identify geomorphic units within Information Systems: National scale - Database of historical (consider SERM & SedNetxii) estuaries, eg. estuary mouth, and current records and - Waves/ swell/ beach run-up inflow rivers, etc, as indicator - Demographic data metadata (including methodology units to assess estuarine health for major populated types)for the SE - Runoff assessment methodology and vulnerability to change from estuaries - Map set for SE - Water temperature impact both human induced and climate Regional/Local - Requires either existing assessment methodology change processes scale coastal geomorphic - Tropical cyclone and east coast low - Using output from models, etc, mapping (with physical impact assessment method for use an expert judgment process to - Collect detail for the SE) or relevant regions provide flow-on implications for photogrammetric, availability of aerial human health (e.g. insect vectors), photographic and photographs to complete tourism, urban water supply, satellite image gaps mangroves, seagrasses and resources – Selection discharge to oceans for potential Quality control and of Estuaries (SE) impact on fisheries or coral reefs, Comparison - Required to assist etc. estuary selection - Increase number of - Same as above, but more - Improvement of models for National scale estuaries studied focused on regional integrated assessment assessments for more - Use estuary system models - Undertake more specific risk assessment - Improve the integrated detailed regional for vulnerability assessment assessments to Regional/Local scale identify risk priorities for policy action - Extend GIS based modeling to key vulnerable estuaries identified from first pass assessment
_____________________________________________________________________ Coastal Vulnerability Gaps Analysis – Australian Greenhouse Office
18
Table 4a. MANGROVES, SALTMARSHES AND ASSOCIATED TIDAL WETLANDS Current knowledge on vulnerability - summary (Sensitivity = L/M/H low/medium/high Confidence = W/M/G weak/moderate/good) Climate Likely impact Sensitivity Known thresholds change driver assessment and confidence Extreme storms -Reduced vegetation cover L/M G - Can tolerate unless combined with other stressors. Little local data, but international data available Increased -Changes in vegetation M/H M - When combined with waves and coverage sea level rise wind
KEY CHARACTERISTICS - High diversity of fauna, algae and microbial life - Stabilising properties SCALE - Occur in 2/3 of tidal-dominated estuaries and deltas - Mangroves 1m ha - Saltmarshes 1.3m ha VALUES - Critical for sustained productivity - Some protection against storm surges and tsunami - Sediment binding - Carbon storage - High value ecosystem goods and services - Crucial part of food chain
Rising sea level
Vegetation loss seaward -Migration landward
H
G
Enhanced CO2
-Increased productivity, but dependent on other limiting factors (salinity, humidity)
L
G
Increased sea temperature
-Reduced productivity
L/M
G
Increased air temperature
-Reduced productivity at low latitudes and increased productivity at high latitudes in winter - Species compositional changes
L/M
G
Humidity changes
-Productivity changes -Diversity changes
H
M
Reduced rainfall
-Forest losses, increase in salt flat cover -Mangrove invasion of salt marsh and freshwater wetlands -Reduced productivity and diversity -Increased diversity and productivity
H
G
- Unknown, natural gradients could be used to obtain first assessment
L
G
- Unknown, natural gradients could be used to obtain first assessment
Enhanced rainfall
_____________________________________________________________________ Coastal Vulnerability Gaps Analysis – Australian Greenhouse Office
- Unknown, dependent on sedimentation, groundwater inputs, tree vigour, tidal amplitude and other factors - Expect 30% enhancement in productivity, reduced by low humidity.and modified by salinity - Respiration doubles with every 10 C rise in temperature - Photosynthesis is reduced at leaf temperatures >35C, but leaf temperatures often lower than air temp. due to evap cooling and leaf orientation - Unknown, natural gradients could be used to obtain first assessment
CATEGORISATION OF KNOWLEDGE * Moderate understanding of ecosystem function * A few sites well studied, others not * Combined impact of multiple stressors poorly understood EXPERTISE AND DATA (WHO/WHAT/WHERE) * Much data resides locally, not nationally connected * No systematic metadata, some bibliographies – e.g. on Murdoch University websitexiii * Good expertise available * Mostly in Universities and AIMS and linked to State DSEsxiv, some GA
19
Table 4b. MANGROVES, SALTMARSHES AND ASSOCIATED TIDAL WETLANDS: Summary of methodologies and technical requirements
First Pass Assessment
Second Pass Assessment
Synthesised from Chapter 4 of Part II (for references, refer to relevant chapter in Part II) Data collection Information on Models, methods and case studies to identify mangroves impacts - Additional Surface - Methods are currently “general purpose” and Information Systems: elevation table (SET) - Fine-scale classification need refinement and testing for different physical monitoring of the coast into and environmental settings instrumentation typological units installations for - Utilize and improve - Use a representative subset of mangrove priority locations existing environments (e.g. a matrix spanning variation in www.ozestuaries.org tidal range, sediment inputs/rainfall etc.) - Sedimentation rates database, e.g. proportions in mangroves, of different wetland - Extrapolate Australia-wide from the saltmarshes and other habitats in estuaries, tidal representative matrix using existing metadata wetlands range etc. available from www.ozestuaries.org - Network into international SET data sets - Test whether available proxies of change are useful, e.g. can mangrove:saltmarsh ratio be used to predict rates of landward migration? - Establish a network - Improve data input for model testing and of SET improvement - Additional ground water balance data in mangroves and tidal wetlands - Carbon and nutrient storage data
_____________________________________________________________________ Coastal Vulnerability Gaps Analysis – Australian Greenhouse Office
- Improve understanding of carbon and nutrient cycling and trends, also impacts of severe storms and faunal responses to changes in habitat extent and availability
Feasible approaches - Use simple modeling approach based on Cahoon (2002, 2003), Nicholls (2004), etc. to assess impact of sea level rise. - Utilise data from SET installations (Australian and international) to verify model outputs
- Improve models for use in different geomorphological settings
- Methods to incorporate multiple stresses
20
Table 5a. SEAGRASSES Current knowledge on vulnerability - summary
KEY CHARACTERISTICS - High productivity - Complex structure - Habitat and food for other species -.Major losses in past 30 years SCALE - Extensive in all states - Coastal typically to 20m depth - Little explored inter-reefal areas and deeper waters VALUES - More than one WHAxv (Shark Bay, GBR) - Significant biodiversity - High value to fisheries, ecology, etc. - Basis of several key fisheries - Shoreline protection - Habitat and food for many other organisms -.Major habitat and food source for threatened turtles and dugong.
(Sensitivity = L/M/H low/medium/high Confidence = W/M/G weak/moderate/good) Climate Likely impact Sensitivity Known thresholds change driver assessment and confidence Extreme - Physical disturbance of M G - Observed losses with storms, tropical seagrasses particular storm events and cyclones -Some ecosystems more H G then recover. Some regions sensitive than others recovery short term, others > decadal. Increased - Coastal seagrasses, - Some species specific waves and especially intertidal, M W losses due to differing wind disturbed due to physical anchoring capacity of disturbance rhizomes. Rising sea level - Loss of deeper habitats H G - No tolerance at current depth limits. -Limitation in urbanized H M - Benefit/neutral sandy areas for recolonisation in coastal seagrass areas where shallow depths colonization possible. Enhanced CO2 - Possible increases in M W - Full impact could be seagrass productivity significant but limited - Reduced survival due to H W knowledge of combined ACIDITY excessive algal growth out impacts. competing seagrass Increased sea - Increase frequency of H G - Enhanced productivity but temperature seagrass ‘burning’ and loss of intertidal seagrasses. shallow intertidal die-off - Competition with algae - Change in species M M may increase. distribution in - Impact significant with subtropical/northern 5°C increase. temperate regions Increased air - Burning of intertidal H H - Loss of intertidal temperature seagrasses seagrasses. Humidity changes Reduced rainfall
- No net effect
L
G
- Fewer low salinity incursions
L
M
Enhanced rainfall
- Low salinity flood plumes cause local seagrass loss - Affect most coastal habitats
H
G
_____________________________________________________________________ Coastal Vulnerability Gaps Analysis – Australian Greenhouse Office
- Loss of some estuarine communities due to lack of mixing; gain of communities lost with flooding - Combination of higher frequency and magnitude of low salinity events (2025‰) would be a threshold threat
CATEGORISATION OF KNOWLEDGE * Reasonable understanding of ecosystem function in some regions * A few regions well studied & monitored (e.g. SW Australia & GBR, Moreton Bay) * Large areas poorly studied and no monitoring * Interactions of multiple stressors poorly understood EXPERTISE AND DATA (WHO/WHAT/WHERE) * Good expertise available * Universities, e.g. UWAxvi, ECUxvii, JCUxviii, UTSxix, UQxx, plus CSIRO, regional and state agencies * Data scattered and locally specific.
21
Table 5b. SEAGRASSES: Summary of methodologies and technical requirements
First Pass Assessment
Synthesised from Chapter 4 of Part II (for references, refer to relevant chapter in Part II) Data collection Information on seagrasses Models, methods and case studies to identify impacts – Compilation of national Information Systems - Priority to model seagrass distribution data - GIS database of seagrass species impacts of sea surface distributions (with metadata) temperature (SST) in shallow water seagrass -Assess/map relative habitat ecosystems availability; database of areas we predict seagrasses could grow - Compilation of species responses to different environmental conditions and disturbances - Compilation of historical seagrass habitat declines and recoveries
Second Pass Assessment
- Collect missing data on species environmental responses (disturbance responses, light and temperature in particular) - Improve data on deep water seagrasses - Improve/collect data on direct impacts of multiple stressors
- Database of disturbance responses of different seagrass communities
Feasible approaches - Concentrate on near-shore seagrasses - Utilise current species distributional models to assess thermal tolerance ranges and predict changes in species ranges. (More detailed analysis of impacts on shallow subtidal and intertidal seagrass maybe required).
- Database of seagrass losses and recovery with evidence for processes involved
- Develop a model that assesses impact of sea level rise (SLR) and light reducing factors for seagrasses in different ecosystems
Quality control and comparison - Relative standards of data collection and resulting data quality would be useful
- Use database of declines and recoveries and disturbance responses to verify model outputs
- Database by species of responses to different conditions
- Methods needed to build - Improve and automate inferences from community monitoring of key seagrass to landscape scale communities
- Sea level rise model could be developed based on physical characteristics of coastal habitats and relating to species growth rate dat
- Enhance knowledge of this largely unstudied habitat (deep water seagrasses) - Direct evidence of multiple stresses needed (may be synergistic) and needs to be tested
_____________________________________________________________________ Coastal Vulnerability Gaps Analysis – Australian Greenhouse Office
22
Table 6a. CORAL COMMUNITIES AND CORAL REEFS Current knowledge on vulnerability – summary
KEY CHARACTERISTICS - High biodiversity and many unique species - Complex structure SCALE - 2nd largest area of coral reefs in the world (19%) - ~50,000 km2 - Coastal to shelf edge - Little explored inter-reefal areas (e.g. 90% of GBR) and some less studied, eg northern and Ningaloo reefs VALUES - Largest WHA (GBR) - High biodiversity - High value to socioeconomics, tourism, regional ecology - Shoreline protection - Habitat for many other organisms Reef bases fisheries (rec and comm)
(Sensitivity = L/M/H low/medium/high Climate Likely impact change driver Extreme - Physical destruction of storms, corals tropical Loss of habitat and food for cyclones other species
Confidence = W/M/G weak/moderate/good) Sensitivity Known thresholds assessment and confidence H G - Natural stress from which reefs can recover, given time; usually localised
Increased waves and wind
- Physical destruction of corals Loss of habitat and food for other species
M
G
- Natural stress from which reefs can recover, given time; usually localised
Rising sea level
- Increase space available for some presently restricted coral communities - Loss of corals which become too deep - Reduce coral calcification - Reduce calcification of other marine calcifiers
M
M
- Likely to benefit some reef flat communities
M
M
H H
M M
- Full ramifications likely to be significant but limited knowledge
- Increase frequency of coral bleaching
H
G
- Increase in area available for reef/coral growth
M
M
- Associated reef organisms, e.g. sea birds, marine reptiles
H
M
- Reef-building corals only 1-2oC below upper thermal threshold 18oC minimum SST threshold but relatively small area increase - Documented reduction in bird populations associated with high air and SST events - Dependence of marine reptiles on ground temperature re sex of offspring
Enhanced CO2 Increased sea temperature
Increased air temperature
What about them??
Humidity changes
- No effect
L
G
Reduced rainfall
- Fewer low salinity incursions; maintenance of “winter-like” conditions - Low salinity flood plumes cause local coral death - Affect reefs further offshore
L
G
H
G
Enhanced rainfall
_____________________________________________________________________ Coastal Vulnerability Gaps Analysis – Australian Greenhouse Office
CATEGORISATION OF KNOWLEDGE * Reasonable understanding of ecosystem function * A few regions well studied & monitored (e.g. GBR) * Large areas poorly studied and no monitoring * Interactions of multiple stressors poorly understood EXPERTISE AND DATA (WHO/WHAT/WHERE) * Good expertise available * AIMS, GBRMPAxxi, JCU (ARCxxii coral reef Centre of Excellence), UQ & other universities regional and state, e.g.WA and Murdoch
- Documented death of corals with low salinity events
23
Table 6b. CORAL COMMUNITIES AND CORAL REEFS: Summary of methodologies and technical requirements Synthesised from Chapter 4 of Part II (for references, refer to relevant chapter in Part II) Feasible approaches Information for corals Models and case studies to identify impacts National scale Information Systems: National scale National scale - Satellite mapping - GBR data is good quality - Research into geographic variation - Use GBRMPA/AGO study and and monitoring - Collate data from all in vulnerability workshopping as a blueprint for - Collation of existing reefs - Classification of reefs by type and identifying critical climate change coral distribution, - Extract & expand vulnerability to different factors (e.g. factors for other reefs community structures Australian data from terrestrial inputs, connectivity (larval - Identification of possible refugia for etc into single national ReefBase supply), tropical cyclones corals and coral communities – where database (http://www.reefbase.org/) Regional/Local scale are conditions suitable for expansion? - First pass integration of main Where are conditions likely to result in Regional/Local scale - National-scale map of - Northern and coral reef and community stressors to assess combined impact - loss of ecosystems? Western reefs need distributions. - overlay maps of coral distribution Regional/Local scale new/more data Quality control and with other stressors/ threats (e.g. - Use GBRMPA/AGO study to achieve a - Document past SSTs, rivers, tropical cyclones, best yet vulnerability assessment for the Comparison changes (e.g. JCU - Use AIMS’ LTMPxxiii population density, etc) GBR ranging from geomorphology to Centre of Excellence and ReefBase protocols microbes and projected climate change GBR History project; - Survey programs for - GBR and coral communities to south impacts paleoclimatology). northern corals as case study. - Range of environments encompassed - Western Australian reefs influenced by GBR provides good models for many by Leeuwin Current as case study. other corals around Australia. - National database of all National scale Regional/Local scale National scale - Detailed national location, bathymetry, - Mesoscale modelling of changes to - Incorporate oceanic chemistry, DBDEM species etc for coral reefs modeling of potential changes in ocean currents, upwelling etc in - National GIS and communities. vicinity of coral reefs under climate Australian waters. database of coral reefs change (e.g. Leeuwin Current, East - Whole bio-geo-chemical modeling of and communities coral ecosystems Australian Current and its Regional/Local scale bifurcation point) Regional/Local scale - State-based data. - Regional projections of SST changes - Initiate ocean chemistry monitoring - Regional projections of river flow (possibly through NCRIS marine changes and extent of flood plumes. planxxiv) - Expand case studies to northern Australian reefs. Data collection
First Pass Assessment
Second Pass Assessment
_____________________________________________________________________ Coastal Vulnerability Gaps Analysis – Australian Greenhouse Office
24
Table 7a. COASTAL INFRASTRUCTURE – Buildings, Roads, Maintained Parklands, Coastal Defence Works, Ports and Harbours, Water Resources Current knowledge on vulnerability - summary (Sensitivity = L/M/H low/medium/high Confidence = W/M/G weak/moderate/good) Climate Likely impact Sensitivity Known thresholds change assessment and driver confidence Extreme - Risk to viability of small M M - Building design codes storms communities, risk to offshore set at a Category 4 platforms cyclone
KEY CHARACTERISTICS - Support and amenity structures for local communities - Subject to design and planning codes and guidelines SCALE - National (e.g. coastal roads system) to local (e.g. houses, communities) VALUES - Health, safety and comfort - Contribute to community productivity - Conduit for goods and services including food and export economy
Increased waves and wind
- More frequent damage
M
G
- When combined with sea level rise
Rising sea level
-Inundation, road damage, seepage, coastal recession and related damage, overtopping of sea walls, risk to canal estates, risks to island communities
M/H
G
- Freeboard assumed in planning
Increased sea and air temperature, more heatwaves
- More possibility of invasive species being established - Planning and design issues for town planning and housing design
M
G
- Disproportionate increase in number of hot days
Decreased runoff
- Reduced environmental flows
M
M
- Conservation or required investment in storage infrastructure
Increased rainfall intensity
-More frequent flooding
M
M
- Stormwater drain capacity
_____________________________________________________________________ Coastal Vulnerability Gaps Analysis – Australian Greenhouse Office
CATEGORISATION OF KNOWLEDGE * Only moderate knowledge of coastal physical processes * Good understanding of design standards EXPERTISE AND DATA (WHO/WHAT/WHERE) * All levels of government – Federal, State, local * Central agencies such as ABSxxv, DOTARS and GA * Insurance and investment companies * Universities and private sector – e.g. coastal geomorphologists, planners. * Engineers Australia (the National Committee on Coastal and Ocean Engineering)
25
Table 7b. COASTAL INFRASTRUCTURE – Buildings, Roads, Maintained Parklands, Coastal Defence Works, Ports and Harbours, Water resources: Summary of methodologies and technical requirements
First Pass Assessment
Second Pass Assessment
Synthesised from Chapters 5 and 6 of Part II (for references, refer to relevant chapter in Part II) Data collection Information on Models, methods and case Feasible approaches infrastructure studies to identify impacts Information Systems: National scale National scale National scale - Databases/metadata Compile a data base of - Coastal aerial photography - Analysis to create DEM of - Identify likely regions of storm surge assessments - Bathymetry, DEM required vertical accuracy (about storm wind increases and done to date - Coastal geomorphological 2m) storm surge inundation - Review of existing type maps compare with design Regional/Local scale design standards for Maps of major intrastructure standards submarine infrastructure types e.g.. ports/harbours - Wind damage as per Walsh et al - National audit of local - Compilation of estimated - Infrastructure flooding – survey planning schemes changes in environmental Stormwater Industry Association Regional/Local scale Regional/Local scale flows - Stormsurge – use database to - Bathymetry, DEM develop coherent national picture - Survey of tropical of vulnerability coastal building stock National scale - More accurate national DBDEM - National GIS database for population, housing and infrastructure near coast - Compile national valuation of infrastructure data
Regional/Local scale
National scale - Socio-economic - NCCOExxvi (2004) valuations interaction matrix for local - Laser altimetry for scale accurate coastal elevation - Local studies using GIS coupled data with socio-economic data to estimate vulnerability to climate change (especially sea level rise)
Regional/Local scale - Collect data on other infrastructure – roads, bridges etc located in potentially vulnerably areas _____________________________________________________________________ Coastal Vulnerability Gaps Analysis – Australian Greenhouse Office
26
Table 8a. FISHERIES AND AQUACULTURE Current knowledge on vulnerability - summary (Sensitivity = L/M/H low/medium/high Climate Likely impact change driver
KEY CHARACTERISTICS - Existing pressures on some fisheries, commercial & recreational - Aquaculture a growth industry - Very few assessments of impact of climate change SCALE - Throughout Australia’s national waters and in many gulfs, estuaries, and coastal rivers - Includes State and Commonwealth managed fisheries, some joint VALUES - Important food source - Important economically viable industry - Critical part of marine ecosystem
Extreme storms
- Impact on estuarine and river systems. - Aquaculture: infrastructure damage.
Altered currents
- Distribution of fisheries - Change to prey distribution. - Changes to larva distribution and hence recruitment.
Rising sea level and salinity incursions Increased sea temperature
Reduced rainfall
Enhanced rainfall
Increased Air temperature
- Impacts on estuary and river fish populations and on aquaculture
- Could cause major shifts in populations. May have ecological and socio-economic implications - Changes to fish behaviour & reproduction, and catchability. - Altered nutrient supply in near-coastal areas. - Changes to timing of spawning. - Changes to availability of recruits - Freshening of some water areas - Aquaculture: change to water quality and quanity. - Aquaculture: change in geographic suitability for pond-based systems. - Change to fish condition and disease susceptibility.
_____________________________________________________________________ Coastal Vulnerability Gaps Analysis – Australian Greenhouse Office
Confidence = W/M/G weak/moderate/good) Sensitivity assessment and Known thresholds confidence (varies between ocean, estuary or river fisheries and aquaculture, near-shore and ocean) M/H M - Can tolerate For nearshore unless frequency increases significBut for ocean: antly and combined L G with other stressors Depends on species - Species dependent
www.affa.gov.au For estuary breeding grounds M W/M For ocean: L H
G G
- Species dependent
- Species dependent
H For inshore
G
- Species dependent
H
G
- Species dependent
H
M
- Species dependent
CATEGORISATION OF KNOWLEDGE * Limited understanding of likely climate change impact * Very few species well studied, others not * Combined effect of multiple stressors poorly understood EXPERTISE AND DATA (WHO/WHAT/WHERE) * Catch data in State & federal fishery departments and CSIRO * Models & expertise in State DPIsxxvii and CSIRO * Commonwealth fisheries and aquaculture production data with BRSxxviii.and economic data with ABARE *Aquaculture disease, threshold data with research organisations (e.g. DPIs, CSIRO)
Formatted: Bullets and Numbering
27
Table 8b. FISHERIES AND AQUACULTURE: Summary of methodologies and technical requirements
First Pass Assessment
Second Pass Assessment
Synthesised from Chapter 7 of Part II (for references, refer to relevant chapter in Part II) Models, methods and case studies to Feasible approaches Data collection Information on fisheries identify impacts Information National scale & National scale National scale Systems - Capture fisheries: not appropriate to Fisheries: Regional/Local Databases/metadata assess on national scale due to - Assessment of suitable study species scale - Assess sensitivity variation among regionally specific by length of data available and, e.g., by - Compile existing to fishing levels: species. existing levels of vulnerability catch/effort data from assessment reports - Aquaculture: site location issues: no - Assessment of suitable models state government available from model available, although temperature available. fishery agencies &/or DEHxxxi website. thresholds of key species are known. Aquaculture: -utilise known federal (AFMAxxix, - Species thresholds, some studies temperature thresholds of key ABARExxx and (e.g. salinity & temperature thresholds aquaculture species to determine annual BRS -Note: no national of snapper) geographical viability of farms. “Fisheries Status assessments have Reports”) Regional/Local scale been done to date. - Compile existing - Oceanographic models that have biological data from Regional/Local scale been linked with ocean ecosystem research changes (e.g. western rock lobster: Capture fisheries: organisations (limited Caputi et al 2003, tuna: Young et al 1. Run oceanographic models with long time-series data 1997, 2001) climate change scenarios and assess available) - Empirical models (e.g. barramundi: impact of change. - Aquaculture: Robins et al 2004, King George 2. Run climate-based correlative Compile existing Whiting: Jenkins 2005, Scallops: models with climate change scenarios. production data from Caputi et al 1998) 3. Utilise models/studies done ABARE or state - Models derived in other regions for elsewhere and comparatively assess the agencies. species also found in Australia (e.g. impact. - Compile existing tuna in Eastern Pacific) disease/nutrition data from research groups. - Continue data - Expand species selection for study - Develop, test and refine collection to extend where feasible. conceptual models. species histories.
_____________________________________________________________________ Coastal Vulnerability Gaps Analysis – Australian Greenhouse Office
28
Table 9a. SELECTED OTHER COASTAL ACTIVITIES – TOURISM, PROTECTED AREAS, HEALTH AND SAFETY Current knowledge on vulnerability - summary Activity
(Sensitivity = L/M/H low/medium/high Confidence = W/M/G weak/moderate/good) Climate change driver & Sensitivity assessment Known thresholds Likely impact and confidence
National parks and protected areas
- Extreme storms & rising sea level – loss of significant park area, crucial ecosystem components, loss of corridoors - Increased sea and air temperature – ecosystem shifts
M
M M H for some very sensitive marine parks such as GBR
- Temperature thresholds well known for corals, poorly known for other park ecosystems
- Rainfall changes – ecosystem shifts
M
- Mostly poorly known
- Extreme storms & rising sea level – damage /loss tourism infrastructure and lost $$ from no access - Increased sea and air temperature – changes in tourist destinations, heat stress, altered tourism seasonal patterns
M M (highly variable between tourist destinations)
- Mostly poorly known
M M (L/M for human activity but could be H for the ecosystems that are tourist attractions)
- Mostly poorly known
- Rainfall changes – altered tourism patterns
M
- Mostly poorly known
- Extreme storms & rising sea level - altered safety risks
M/H M (dependent on location)
- Increased sea and air temperature – heat stress, altered seasonal disease patterns
M
L/M
- Thresholds understood but application to particular regions difficult - Mostly poorly known
- Rainfall changes including floods and droughts -increased stress, altered geographical patterns of disease
M
L/M
- Mostly poorly known
Photo: Qld Government
KEY CHARACTERISTICS - Coast a preferred living area - Large % of tourism is coastal - Large % of national parks and protected areas in coastal zone - Different health issues around the coast SCALE - Regional variation in these components VALUES - Significant % of national economy - Parks & protected areas provide heritage, ecosystem and tourism values - Healthy community
Tourism
Heath and safety
_____________________________________________________________________ Coastal Vulnerability Gaps Analysis – Australian Greenhouse Office
M
M
M
- Mostly poorly known
CATEGORISATION OF KNOWLEDGE * Recent assessment of general tourism risks at regional scale * Recent assessment of health consequences * A few parks well studied (e.g. GBR), others not * Possible combined impacts of human and climate change pressures not well understood EXPERTISE AND DATA (WHO/WHAT/ WHERE) * Data quantity and quality variable * Expertise: * DEH, DITRxxxii, GBRMPA, State DSEs, CRCxxxiii for Sustainable Tourism, Tourism Research Australia, ANUxxxiv, Dept. Health and Ageing
29
Table 9b. SELECTED OTHER COASTAL ACTIVITIES – TOURISM, PROTECTED AREAS, HEALTH AND SAFETY: Summary of methodologies and technical requirements
First Pass Assessment
Second Pass Assessment
Synthesised from Chapter 8 of Part II (for references, refer to relevant chapter in Part II) Data collection Information Models, methods and case Feasible approaches systems studies to identify impacts Parks and Sea level impact on size Consolidated Assess a sub-set of sites, Data from rest of FPVA protected areas of National Parks and database of all collect relevant output from study plus expert assessment areas sites rest of first pass vulnerability assessment (FPVA) Heritage sites Vulnerable parts/fractions of heritage sites Tourism Better fine scale tourism data Collect sea level Combine results from recent Map and assess outputs for Health and safety incursion and storm studies with GIS /mapping locations of significant data for major inhabited capability population densities areas Distribution data for vector spread, eg. mosquitos Parks and Data on site values – Generally Integrated assessment of Methods to assess socio- these components protected areas economic, social and improved data economic vulnerability environmental bases Heritage sites and adaptability Tourism Comparative data of vulnerability of Australian vs overseas tourist destinations Collect relevant data on Health and safety resilience
_____________________________________________________________________ Coastal Vulnerability Gaps Analysis – Australian Greenhouse Office
30
Table 10. Suggestion for assessment process for First Pass vulnerability assessment This table takes the information supplied in the system/component tables and, in schematic terms, suggests how the first pass assessment of the various components could be integrated. Code for third column: SLR= sea level rise, T= temperature, R=rainfall, SST= sea surface temperature Basic data and associated data tasks Shoreline position (R) DEM (R) DB (R) Aerial photography (C) Other visual records (C) Reefs (A and C) Selected demographic data (C) Selected Ports and harbours data (C) Fish catch (C) Basic maps of extent and location of mangroves, seagrass, reefs, estuaries, protected areas (C) Runoff and flood statistics (C) Turbidity reports (C) Selected infrastructure and local government data (C) Code: R= Refine C= Collate A= Additional
Basic tasks Select geographic distribution of study regions for components, probably by expert assessment (EA). Sea level mapping for (a) broadscale and (b) selected beaches, estuaries, ports. Storm mapping. Downscale climate change data for selected estuaries, and major regions of M,S,C,F,I (some already exists, some needed) Itemise and compile coherent picture of observed change from visual records. These are central tasks needed for many of the studies for the individual components
Components and their primary assessment Beaches (B) SLR, storms Estuaries (E) SLR,T,R Mangroves (M) SLR,SST,R Seagrass (S) SLR,SST,R Corals (C) - link to GBRMPA work Infrastructure (I) SLR,T,R,storms Water Resources (W) SLR,T,R,storms Fisheries and aquaculture (F) SLR,SST,R,currents Protected areas (P) size, viability Tourism (T) viability of tourism assets and supporting infrastructure Health (H)
Linkages
Mapping
Outputs
First-pass indications of linkages between systems and to socioeconomic vulnerability
Mapping and specification of vulnerability levels (e.g. L/M/H) as well as confidence estimates: - by component - by community, where needed - by region/ coastal segment
A collection (possibly central repository) of datasets and outputs
Possible survey re planning issues and vulnerability to climate change
Map or tabulate thresholds where relevant or understood
Set of maps Set of expert assessments Set of description templates Possible survey or other results
SLR, T, R, storms
Assess direct impacts of climate change on these components
_____________________________________________________________________ Coastal Vulnerability Gaps Analysis – Australian Greenhouse Office
Collation and integration EA to link E, M, S, C, F related and interacting impacts Secondary impacts of B,E,I,W on M,S,C,F,P,T,H (where and/or if significant)
Code: EA= expert assessment
31
Table 11. Key gaps to fill Gaps exist for all systems and components (to varying degrees of severity) and these are identified in Part II of this report. However, there are some key gaps that, if filled early, or at least a process commenced as soon as possible, would make a key difference to the ability to undertake useful vulnerability assessments. Some of these key gaps relate to refinement and/or new data, others to compilation and quality control of existing data.
Key gap
Reason
Possible mechanism to significantly close gap
Shoreline position and near-shore elevation.
For most of the coastline, existing data are inadequate for really useful estimates of coastal incursion due to sea level rise. Where possible, extra detail is needed for estuary shape, mangrove regions, saltmarsh and coastal plains and relevant offshore islands and cays. A refined coastal digital elevation model (DEM) would assist many aspects of a vulnerability assessment.
An aerial coastline lidar survey to obtain a linear transect of the coast.
Digital elevation matched to nearshore digital bathymetry (ie. seamless dataset). A collated set of visual records (primarily historical and recent aerial photography and satellite images). National status of planning schemes and local ability to use climate change information in planning. A common set of information for the coastal ecosystem (the system, not just separate components) – how economically valuable is it, knowledge status, who looks after it and researches it.
A valuable resource for assessment of change that has already occurred, and for baseline for comparing future change. Coastal vulnerability is linked to local adaptive capacity and in particular ability to plan effectively. Research is often at local scale, as is coastal management; many agencies are involved. Coastal ecosystems are valued by Australians but our information base on values is sparse. Research and monitoring could be better integrated for the important task of identifying climate change risks.
This requires removal of vegetation stands from satellite estimates of altitude, and a matching process between on-shore and offshore elevation estimates. (GA and ANU CRESxxxv are already working on the former). If data from a lidar survey were also available, a significant improvement in a national DEM could be achieved. An exercise to establish coastline segments to benefit most from collation of visual resources, to identify these resources (type, ownership, etc) and to create a relevant data set. A national audit of local planning schemes for use of climate change information, where there are consistencies and differences and what tools are available. Create a work plan to leverage key climate change information for the national coastal ecosystem, including its value and its key vulnerabilities. Create a directory of coastal management and research agencies relevant to each coastal region of Australia.
There, are also longer term needs for additional research. For example, a coordinated assessment of potential thresholds for severe ecosystem stress as a function of rate and magnitude of change would be most useful for a more comprehensive vulnerability assessment. In addition, it has been suggested that a one-stop web resource for some of the systems to be studied, e.g. coastal ecosystems, would be very valuable.
_____________________________________________________________________ Coastal Vulnerability Gaps Analysis – Australian Greenhouse Office
32
Table 12. Summary table for types of data (data classes) relevant to coastal vulnerability assessments. Types/class of data
Sub-class
Typical scope (Current available data)
DATA REQUIRED FOR ALL COMPONENTS Digital Coastline delineation National to approx. coastal and coastal zone 9 second or better elevation elevations horizontal (DEM) resolution; and approx +/- 10m vertical resolution
Sea level (history and projections)
Tropical cyclones and severe storms Visual images, e.g. photographs, satellite images, Google earth
Typical (temporal) length of record
Utility for climate change work (L/M/H)
Issues
Not relevant (NR)
H Very useful if vertical resolution of ~ 0.2m can be achieved.
Current resolution variations will lead to geographically variable accuracy of sea level intrusion maps
National
NR
M (as presently available)
Identify low-lying near coastal features that may be lost to sea level rise
National
+/- 100 years approx.
History M
Choice of scenarios will give range of future sea level
Storm surge heights
Mainly for selected populated areas (e.g. Cairns)
Historical data mostly < 50 years Projections – need generating
Tracks, strength, etc.
Tropical and subtropical
Some back 100 years, better record 40 years Variable
Photographs are from site to local to regional scale
M M
Typical ownership (and/or repository locations)
Near-shore bathymetry (oceans, estuaries, river outlets) Mean sea level heights
Projections H M/H
Likely requirements to bring to standard
Detail available for Queensland coastal vulnerability needs to be extended to other regions (including collation of longer historical records) Temporal consistency; detail available for coastal Qld needed for other states Useful for identifying change Some historical images lost or languishing
Lidar coastline survey to achieve ~ 0.1-0.2m vertical resolution New DEM data set in preparation by GA/ANU – details available soon Completion/extension of GA/ANU work Include islands, cays and reefs
Use Qld NRMWxxxvii (2004) study as prototype for other states Effort to identify & collate into single database
GA,ANU
GA, ANU Navy BoMxxxvi, CSIRO, GA, Navy BoM, GA, CSIRO, Qld Government agencies, some universities BoM; Qld NRMW (2004) All levels of government
Satellite images national scale
_____________________________________________________________________ Coastal Vulnerability Gaps Analysis – Australian Greenhouse Office
33
Climate characteristics e.g. tropical/ temperate and climatology of extremes
Climate “envelopes” for different coastal regions
National
DATA REQUIRED FOR COMPONENTS: Tropical and subSea Wave observations tropical properties and spectra (ie. wave climatology) Tides, ocean currents
Up to 100 years
H
Identify & collate into single database, high-quality climate records for coastal regions; return periods for current climate extremes & their regional variations around the coastline
BoM, BIOCLIM/ OZCLIM
Limited high-resolution data; few projections of changes in vicinity of ecosystem components (e.g. ocean currents important for coral recruitment). Vulnerability of MPAsxli, MPA design for the future, e.g. areas where corals, seagrass and mangroves could move or not. Loss of habitat for flora & fauna (e.g. seabirds). Regional projections of sea level rise
Good for GBRxxxix, some ports & harbours, but poor elsewhere
CSIRO, EPA (Qld)xl, JCU, AIMS Navy
For offshore regions: good for GBR but poor elsewhere
GBR Depth & Elevation Model GBRDEMxlii , CRC Reef; Navy; GA; JCU All levels of government, CSIRO, CRCs, some universities
H
Needed for prediction of coral bleaching events; prediction of degree of susceptibility
Useful high-resolution projections available for GBR but few if any available elsewhere. Linkage SST with ocean circulation and tides needed to develop ecosystem risk maps.
M
Needed for vulnerability of structures
Observations often < 10 years; Projections needed
M
Digital coastal and island elevation and near-shore bathymetry
High resolution needed for reefs, islands, cays, saltpans and slow, flat estuaries
Special local data may be needed for certain critical locations
NR
H
Geophysical data, e.g. beach types
Classifications of beaches/coasts, including morphodynamics. Local/regional tide and wave characteristics. Aerial photography of beaches Large-scale to subreef scale
Generally beachspecific or by classifications
Aerial photography records can provide up to 60 years of change data. Length of record NR for classifications Up to 100 years; higher resolution past 10-30 years. Some detailed projections available (e.g. ReefClim)xliii Variable mostly 360 species of hard coral and >1,500 species of fish, >4,000 species of molluscs, >400 species of sponges, 30% of the world’s soft coral species, extensive sea grass beds, internationally endangered dugongs, six of the world’s seven marine turtle species (endangered and vulnerable), several hundred species of seabirds and provides breeding grounds for humpback whales from Antarctica (www.gbrmpa.gov.au). Coral reefs occupy only ~10% of the GBR shelf and the rich biodiversity of the remaining 90% inter-reefal areas has only recently been documented through the GBR Seabed Biodiversity Project (www.reef.crc.org.au/resprogram/program/seabed/). Development of networks of highly protected areas that preserve biodiversity increases the resilience of coral reefs to cope with external stresses (e.g. Hughes et al., 2003). The number of reefs under management plans is growing and the implementation and maintenance of effective monitoring is necessary to assess the effectiveness of these plans in a changing environment.
_____________________________________________________________________ Coastal Vulnerability Gaps Analysis – Australian Greenhouse Office
66
Monitoring Programs The most extensive long-term coral reef monitoring program in the world is the Australian Institute of Marine Science (AIMS) Long-Term Monitoring Program (LTMP) started in the early 1980s (http://www.aims.gov.au/pages/research/reef-monitoring/reef-monitoring-index.html). This covers a representative sample of GBR reefs but only visits about 5% of the 2,900 reefs of the GBR, as well as some reefs off WA (Ningaloo, Scott Reef and Rowley Shoals). Other agencies and universities conduct additional coral reef monitoring on Lord Howe and the Solitary Islands, Heron Island and some reefs of northern and western Australia (Wilkinson, 2002). There is also community participation in reef monitoring along the Queensland coast (http://www.reefcheckaustralia.org/). Other agencies have programmes to monitor particular groups of organisms (eg seabirds, turtles, dugongs) in limited areas and other programmes monitor physical variables (eg water temperature) in some areas. Coral ecosystems along the western Australian coast are reasonably well documented, with some sporadic monitoring. There is, however, a significant gap across much of far northern Australia with little baseline information let alone regular monitoring of the status and trends in coral reef ecosystems.
Sensitivity of Australia’s coral and coral reefs to climate change Coral reefs ecosystems are at significant risk from climate change due to their high sensitivity and vulnerability (IPCC, 2001), see Table 13. Table 13 Predicted effects of climate change on corals and coral reefs Climate change process
Potential impact
Increased sea surface temperatures
More frequent and widespread coral bleaching events
Increased ocean acidity
Reduced ability of marine calcifiers to create CaCO3 skeletons
Increased intensity/frequency of tropical cyclones Increased intensity rainfall/river flood events Changes on ocean currents Sea-level rise
More frequent, localised destruction of reefs More frequent and possibly wider extent of low salinity/turbid waters Changed distribution of coral larvae dispersal patterns; changed nutrient supplies Changed marine area suitable for corals
Effect on ecosystem processes Coral death, partial or full recovery; reduced reproduction; degradation of coral reef structure; flow-on effects to other reef organisms; change in community structure; loss of species & biodiversity. Small increase in area suitable for coral growth. Weakening of reef structure; reduction in reef shoreline protection properties; reduction in habitat for associated organisms; change in community structure; loss of species & biodiversity Localised destruction of coral reef; degradation of coral reef structure; reduction in reef shoreline protection properties; reduction in habitat for associated organisms Localised coral death; flow-on effects to other reef organisms; change in community structure Changes to coral recruitment from connected reefs; important for recovery after disturbances; Increased area of reef habitat in some locations currently limited by sea level (e.g. reef flats); drowning of reefs that cannot keep up.
The most obvious effect is coral bleaching due to rising water temperatures. As a result of bleaching, the coral may die, partially recover or fully recover. Another potential impact of climate change on coral reefs is due to the direct effect of increasing carbon dioxide (CO2, the major greenhouse gas) on ocean chemistry. About 30-40% of anthropogenic CO2 released into the atmosphere has been absorbed by the oceans and lowered oceanic pH by 0.1. The pH is projected to drop a further 0.4-0.5 by 2100. Lower oceanic pH affects the ability of many marine-calcifying organisms to secrete calcium carbonate skeletons and shells (Buddemeier et al., 2004; The Royal Society, 2005; Hoegh-Guldberg, 2005). Changes in ocean chemistry would alter the makeup of marine ecosystems, alter food webs and weaken coral reef structures. Although there is no evidence, as yet, of calcification rate change in corals of the GBR (through analysis of long coral cores; Lough and Barnes, 2000), the potential consequences are considered significant but poorly understood (The Royal Society, 2005).
_____________________________________________________________________ Coastal Vulnerability Gaps Analysis – Australian Greenhouse Office
67
What we know about coral bleaching Coral bleaching is not a new phenomenon due to global warming. Corals bleach in response to several environmental stresses. Until the mid-1970s, however, coral bleaching only occurred on small spatial scales. What is new, and clearly linked to global warming, is an increased frequency of mass coral bleaching events where whole reefs are affected. The majority of the world’s coral reefs bleached to some extent in 1997-1998 and ~16% is estimated to have been destroyed (Wilkinson, 2004). About 40% of the GBR was affected by bleaching in 1998 and ~50% in 2002 (Berkelmans, 2002). Significant bleaching in the southern GBR occurred in 2006. Corals live only 1-2oC below their upper thermal limit and an additional 1oC results in mortality. The link between unusually warm sea surface temperatures (SSTs) in summer and coral bleaching is clear. (http://www.osdpd.noaa.gov/PSB/EPS/SST/climo.html; http://www.gbrmpa.gov.au/corp_site/info_services/science/climate_change/conditions_report.html; http://www.reeffutures.org/topics/bleach.cfm). Coral bleaching is variable and related to factors such as thermal tolerance of species (Marshall and Baird, 2000), light levels, and hydrodynamic processes (eg strong tides, water flows, Nakamura et al., 2003). For the GBR the average SSTs are now ~0.4oC higher than at the end of the 19th century. Modelling of future impacts of continued SST warming suggests that by the end of this century, 80-100% of the GBR could bleach, possibly annually (Hoegh-Guldberg, 1999; Berkelmans, et al., 2004) and that maintenance of hard coral cover on the GBR would require coral to increase their upper thermal tolerance limit by 0.1-1.0oC per decade (Wooldridge and Done, 2004: Donner et al., 2005; Wooldridge et al. 2005). Reefs of the GBR have shown substantial recovery after bleaching events, aided by the large scale of this system and availability of coral larvae from reefs upstream. Gradual coral recovery has also been observed on NW reefs, (Wilkinson, 2004). The distribution of reef-building corals is limited by annual minimum SSTs of ~18oC and rising SSTs may extend the area for coral reef development polewards. This increase in area is, however, relatively small as corals also require shallow, clear water with a hard seafloor and the necessary ocean currents for propagation (Kleypas et al., 1999).
Steady rise in sea level is unlikely to be a major problem as Australia’s coral reefs have been at current sea level for several thousand years. Corals have high enough growth rates to keep up with projected sealevel rise and higher sea levels would give shallow, reef-flat corals more living space. Higher sea levels would, however, reduce the land area of the many sandy cays and small islands, which are important nesting grounds for seabirds. The present distribution of ocean currents controls many processes fundamental to maintenance of present day coral reefs, e.g. connectivity of larval supplies between reefs. Although there are indications that the southern extension of the EAC will strengthen with global warming (Cai et al., 2005), there is little information available about how ocean currents (e.g. Leeuwin) will change. CSIRO Mk3 Climate System Model (Hobday and Matear, 2006) supports the increased southward penetration and strengthening of the EAC but shows no obvious changes in the Leeuwin Current. Many of Australia’s coral reefs are close to land and can be significantly affected by heavy rainfall and associated river flood plumes. Extensive river flooding discharges low salinity, sediment laden water onto coastal reefs. Current projections as to how the highly seasonal and highly variable rainfall and river flow regimes of northern tropical Australia will change with continued global warming are unclear. Tropical cyclones can be destructive to coral reefs. From 1969-1997, 135 tropical cyclones occurred in Queensland waters and all areas of the GBR have been affected (Puotinen et al., 1997). The impact can range from minor
Flood plumes The most pronounced ecological gradients on the GBR are between inshore and offshore reefs. Under current climate conditions nearshore GBR reefs experience river flood plumes annually; mid-shelf reefs experience freshwater flood plumes occasionally during extreme flood events and reefs located on the outer third of the continental shelf never experience freshwater flood plumes (Lough et al., 2002). The response of corals to flood plumes depends on salinity and turbidity levels of the plume as well as the length of exposure. The nearshore Keppel Islands in the southern GBR suffered 85% mortality following the 1991 Fitzroy River flood (Chin, 2003). The behaviour of flood plumes along the GBR has been modelled and mapped (King et al., 2001; http://www.aims.gov.au/pages/research/brpmcrc/burdekin-river/).
_____________________________________________________________________ Coastal Vulnerability Gaps Analysis – Australian Greenhouse Office
68
breakage of more fragile corals to dislocation of centuries-old massive corals. Even severely affected reef areas can recover from tropical cyclones as pieces of living coral remain and replenishment with larvae from connected reefs will occur. Recovery may take 5 to 20 years depending on growth rate of corals. Tropical cyclones play an important part in determining the abundance and species composition of coral communities (Chin 2003). There is not a clear picture as to how tropical cyclone location, frequency and intensity will change with global warming, though there are some suggestions that globally there may be signs of the effect of warmer waters on tropical cyclone intensity (Emmanuel, 2005; Webster et al., 2005; Hoyos et al., 2006). Even without significant changes, tropical cyclones and flood plumes will still be occasional sources of localised reef disturbance (Massel and Done, 1993), from which reefs need time to recover. Both the El Niño and La Niña phases of ENSO4 result in significant climate anomalies in the vicinity of Australia’s coral reefs (e.g. Lough, 1994). It is unclear what will happen to the frequency and intensity of ENSO extremes with global warming but they are likely to continue as a source of short-term climate anomalies affecting ecological processes on Australia’s coral reefs. Relative regional vulnerability of reefs There has been little research into the relative regional vulnerability of Australia’s coral reefs and coral communities to climate change. The long-term impact of an extreme event such as coral bleaching may be greater for isolated reefs than those with high connectivity and abundant larval supplies. Crimp et al. (2004) suggest that the Cairns section of the GBR and adjacent land area was “particularly vulnerable” because of the combined effects of low elevation, relatively high population, location near a major river system that floods, narrow continental shelf and economic reliance on tourism and agriculture.
Australia’s coral reefs and communities are clearly vulnerable to global climate change due to their high sensitivity to warming SSTs and changes in ocean chemistry with additional potential impacts associated with changes in river flows, tropical cyclones, ocean currents and ENSO events. Australia’s coral reefs and communities will not disappear entirely, particularly given their high level of resilience compared to other coral reef systems of the world. This resilience is a result of lower human pressures on Australia’s coral reefs and active management and protection strategies to maintain reef health. It is, however, highly likely that there will be a significant decline in coral populations and lower numbers of associated organisms and a likely shift from coral-dominated communities to reefs dominated by algae (HoeghGuldberg, 2005: Lough et al., 2006). Such changes will have a dramatic impact on the goods and services provided by Australia’s coral reefs.
4.3.3 Methods for assessing impacts on coral reefs “As we enter an unprecedented climate state, recent geological and biological history gives us little on which to base predictions regarding the future of coral reefs ecosystems.” “Coral reefs of the future will be fewer and probably very different in community composition than those that presently exist, and these will cause further ecological and economic loss.” (Buddemeier et al., 2004).
Coral reefs are complex and dynamic ecosystems with high biodiversity, which provide habitats for a wide range of marine organisms, stretching over a considerable depth range. Natural ecosystem dynamics and responses to “normal” environmental stresses (e.g. tropical cyclones, floods) results, on healthy coral reefs, in natural variations in coral cover and community structure – a continual cycle of decline, change and recovery. These dynamics and the scale of Australia’s coral reefs make it hard to detect long-term changes in reef health. Regular monitoring (e.g. AIMS’ LTMP), essential for detecting change, relies on in situ surveys and is expensive both in terms of expert personnel and ship time. There are established methods for surveying coral reefs and coral communities and there are many detailed surveys but these are primarily specific to a particular time and place (“snapshots”) and without the necessary continuity to detect long-term change. Some long-term perspectives on natural variability and change can be obtained by the established methods for analysing long-term growth and environmental records contained in cores from certain massive coral skeletons, which can cover the past several
4
ENSO: EL Niño-Southern Oscillation
_____________________________________________________________________ Coastal Vulnerability Gaps Analysis – Australian Greenhouse Office
69
centuries. Remote sensing of the “health” of coral reefs ecosystems is not, as yet, sufficiently advanced to detect impacts and changes. Because environmental conditions conducive to coral bleaching events can be readily monitored and critical thresholds detected (e.g. GBRMPA; AIMS Automatic Weather Stations; NOAA “hotspots”), detailed surveys of the impacts and subsequent mortality and recovery can be initiated (Berkelmans and Oliver, 1999). Similar, reactive, surveys can also be instigated after major flooding or tropical cyclones events. This is possible (given location of resources) for the GBR; such ability for Australia’s other coral reef systems is more limited. Give the size, complexity, and dynamics of Australia’s coral reef ecosystems, it is impossible to design a program for assessing all potential climate change impacts that would be equally representative, financially viable and include all significant components of the coral ecosystem.
4.3.4 Identification of gaps “Given that warming of just 1oC may exceeds the threshold of coping capacity for the Great Barrier Reef and other coral ecosystems, it may be too late to avoid substantial impacts to these systems, even with aggressive, early mitigation action. … Mitigation .… may give natural ecosystems such as coral reefs greater time to adapt. As a result, coral communities may avoid the loss of at least the more heat-tolerant species, thereby maintaining the functions, goods and services of reef ecosystems.” (Preston and Jones, 2006).
We have a reasonable knowledge of the vulnerability and sensitivity of corals to climate change impacts. We have very limited knowledge of the ancillary effects on associated reef organisms and their separate vulnerability and sensitivity to climate change. For the GBR, this is being addressed with a book coordinated by the GBRMPA Climate Change Response Team and the AGO to provide a “comprehensive synthesis of knowledge about the vulnerability to climate change of the GBR ecosystem” that should be of relevance to Australia’s other coral ecosystems. Aside from corals, topics covered include: plankton, micro-organisms, benthic algae, sea grass, mangroves, benthic invertebrates, bony fish, sharks and rays, birds, marine retiles, marine mammals, pelagic organisms, islands and cays, coastal and estuarine, geomorphology – highlighting the complexity of what makes an ecosystem such as the GBR. Ideally, such regional vulnerability assessments are necessary for all of Australia’s coral reef and coral communities. Ocean circulation and currents play a critical role in the maintenance and survival of coral reef ecosystems – there is a need for detailed, regional scale projections of how such current systems are expected to change. There is at present little knowledge of the relative vulnerability of different parts of coral reef ecosystems (e.g. along the length and breadth of the GBR) and among different coral ecosystems of Australia. There has, to date, been little effort integrating the combined effects of different climate change stresses on coral ecosystems to produce large-scale risk maps e.g. spatial extent and frequency of freshwater flood plumes, spatial occurrence, frequency and intensity of tropical cyclones, spatial risk of coral bleaching, combined with the gradual increase in sea level and reduction in ocean pH.
4.3.5 Climate-related thresholds “Vague hopes that the biology of coral reefs will keep up with the pace of change are not matched by current observations or our understanding of past changes. Evolution is a slow process that is unlikely to keep up with the rapid changes currently being exerted upon the environmental envelope surrounding corals and coral reefs.” (Hoegh-Guldberg, 2005).
The most clearly defined climate threshold for corals is that associated with coral bleaching which occurs with SSTs 1-2oC above summer maxima – levels projected to be exceeded increasingly frequently over the coming decades. Thresholds for coral mortality are only ~1oC above those for bleaching. We know that “healthy” reefs (i.e. those not subject to other human stresses) are more resilient and can recover from mass coral bleaching events – but such recovery requires time.
_____________________________________________________________________ Coastal Vulnerability Gaps Analysis – Australian Greenhouse Office
70
We also know that localised disturbance and death of corals occurs as a result of reduced salinity associated with extreme flood events and physical damage due to tropical cyclones. Both are likely to add to the stress on some of Australia’s coral ecosystems as global warming continues. Thresholds associated with changing ocean chemistry are not, as yet, clearly defined.
4.3.6 Data and research needs • Monitoring of changes in ocean chemistry (cf important overseas examples of BATS, Bermuda Atlantic Time-series Study, a long-term deep ocean time-series of data and HOTS, Hawaii Ocean Timeseries ) • Improved modelling of potential changes in oceanic currents in vicinity of coral reefs • Improved integrated assessments of combined effects of different climate changes stresses (more frequent coral bleaching, weaker coral structures, more frequent/intense freshwater events, breakage due to tropical cyclones, larval supply and changing ocean currents) on Australia’s reef landscapes. • Expand monitoring and research to wider selection of coral communities and reefs. • Completion of GBRMPA vulnerability assessment– other organisms reliant on healthy coral reef ecosystems and habitats. • Integration of climate change as a significant factor affecting marine ecosystem protection and MPA design. • Assessment of relative vulnerability of coral reefs with respect to location, key climatic drivers and other stresses (e.g. proximity to terrestrial influences).
4.3.7 Feasible assessment options – coral communities and coral reefs Given the extensive work done on the Great Barrier Reef, a first pass assessment could use this work as a model for other major Australian reefs. In order to assess the degree of threat from global warming, it would be useful to identify possible refugia (i.e. ecologically suitable locations where corals may survive in future) and how much adaptive capacity they might provide to Australia’s internationally important reef systems. For a second pass assessment, it should be possible to expand the geographic area of case studies and to undertake more detailed modelling of the bio-geo-chemical environment of corals. Additional routine ocean chemistry monitoring would greatly enhance the utility of the modelling effort.
4.4
Feasible assessment options – coastal ecosystems
Since work associated with the National Biodiversity and Climate Change Action Plan (DEH, 2004, available at URL: http://www.deh.gov.au/biodiversity/publications/nbccap/) has identified information gaps and research needs for marine, estuarine and coastal ecosystems, it would be useful to align efforts on common needs. Common needs identified under the Action Plan, and recommended for collaborative inclusion in a first pass vulnerability assessment for coastal ecosystems are: •
An annotated bibliography of current research, publications and information in the grey literature;
•
An accessible, electronic database of relevant information and data (including local, state and federal activities); and
•
Coordination of regional maps (e.g. species distributions, key habitats, protected areas).
_____________________________________________________________________ Coastal Vulnerability Gaps Analysis – Australian Greenhouse Office
71
CHAPTER 5: Coastal water resources 5.1
Introduction
Increasing population growth within the coastal zone will continue to place pressure on coastal water resources. Demand for water supply to coastal communities as well as continued demand for water for agricultural and rural pursuits will compete for the environmental flows needed to sustain coastal environments, particularly estuaries. CSIRO (2001) climate change projections have increases in temperatures for all coastal regions of Australia and decreases in rainfall for some regions, leading to decreases in streamflow and water availability. Table 14 shows a detailed vulnerability and adaptation matrix for coastal water resources. Note that not all of these adaptation measures would need to be introduced at all locations; detailed studies at precise locations would be needed before specific recommendations for management options could be made. Table 14 Vulnerability Matrix of Climate Change Impacts on Coastal Water Resources Climate effect
Potential Impact
Adaptive Mechanisms
WATER SUPPLY Sea level rise.
Increased Temperature
Incursion of saline water into fresh-groundwater aquifers – loss of supply.
Re-deployment of groundwater extraction bores.
Incursion of saline water into freshwater reaches of rivers – loss of supply (upstream extension of tidal limits in estuaries).
Re-deployment and/or construction of tidal barriers to maintain the freshwater integrity of river reaches or do nothing.
Redundancy of water extraction infrastructure such as weirs and off-takes by increased tidal influence. Increased water temperature makes coastal waters unsuited to sensitive marine species and ecosystems.
Re-deployment/re-development of water extraction infrastructure/installation of protective barrier structures. Make provision for vegetation adaptation processes.
Increased water temperature allows invasion by pests or disease.
Increased pest plant and animal monitoring and control.
Increase demand for water due to warmer weather.
Introduce water saving measures.
Reduction of flows – increased evaporation rates.
Improve water recycling use.
Increased risk of bushfires in catchments associated risk of decreased streamflows.
Improved fire fighting capacity and resources/increased fuel reduction burning pressures. Introduce water saving measures and improve water recycling use.
Reduced rainfall.
Reduced river flows including environmental flows & reduced environmental condition for water harvesting.
Increased rainfall storm events.
Flash flooding – incapacity of drainage network to cope.
Protect assets through improved floodplain management/protection.
Damage to stormwater infrastructure.
Continuous repairs and/or upgrades.
Increased sewer overflows
Continuous repairs and telemetry based monitoring of infrastructure network.
Increased erosion events.
Control sedimentation processes through use of vegetation filter strips and appropriate trapping and control structures.
_____________________________________________________________________ Coastal Vulnerability Gaps Analysis – Australian Greenhouse Office
72
Climate effect Severe weather events.
Potential Impact
Adaptive Mechanisms
Higher reach from storm surge for coastal areas.
Protect dune barriers.
Salt water contamination of freshwater reaches of rivers.
Re-deployment and/or construction of tidal barriers to maintain the freshwater integrity of river reaches.
SEWERAGE AND DRAINAGE SYSTEMS Sea level rise
Reduced rainfall.
Increased rainfall storm events.
Severe weather events.
Increased salinity levels due to rising seawater levels resulting in increased infiltration to sewerage network and at wastewater treatment plants. Increased level of poor drainage performance caused by seawater levels backing up drainage systems. Increased potential for corrosion and odours caused in the sewerage network as a result of increased sewage concentrations associated with water conservation.
Installation of barrier technology to avoid/minimise infiltration.
Increased risk of pipe failure and collapse due to dry soil conditions.
Infrastructure replacement and upgrades.
Increased incidence of sewer overflows due to increased rainfall intensity during storms.
Infrastructure capacity upgrades. Continuous repairs and telemetry based monitoring of infrastructure network.
Flash flooding – incapacity of drainage network to cope.
Stormwater system capacity upgrades.
Damage to stormwater infrastructure.
Protect assets through improved floodplain management/protection. Continuous repairs and/or upgrades. Continuous repairs and telemetry based monitoring of infrastructure network.
Increased erosion events.
Control sedimentation processes through use of vegetation filter strips and appropriate trapping and control structures. Infrastructure capacity upgrades. Stormwater system capacity upgrades.
Increased incidence of sewer overflows due to increased rainfall intensity during storms. Flash flooding – incapacity of drainage network to cope. Damage to stormwater infrastructure such as underground drains, levee banks, pump stations etc…due to higher peak flows. Increased erosion events.
Infrastructure replacement and upgrades.
Continuous repairs and/or upgrades. Continuous repairs and telemetry based monitoring of infrastructure network. Control sedimentation processes through use of vegetation filter strips and appropriate trapping and control structures.
RECEIVING WATERS Sea level rise
Increased Temperatures
Incursion of saline water into freshwater groundwater aquifers – loss of supply.
Make provision for vegetation adaptation processes.
Incursion of saline water into freshwater reaches of rivers – loss of supply (upstream extension of tidal limits in estuaries).
Make provision for vegetation adaptation processes.
Increased water temperature makes coastal waters unsuited to sensitive marine species and ecosystems.
Make provision for vegetation adaptation processes.
Increased water temperature allows invasion by pests or disease.
Increased pest plant and animal monitoring and control.
Increase demand for water due to warmer weather.
Introduce water saving measures.
Reduction of flows – increased evaporation rates.
Improve water recycling use.
_____________________________________________________________________ Coastal Vulnerability Gaps Analysis – Australian Greenhouse Office
73
Climate effect Reduced rainfall.
Potential Impact
Adaptive Mechanisms
Reduced river flows including environmental flows & reduced environmental condition for water harvesting.
Introduce water saving measures and improve water recycling use.
Increased rainfall storm events.
Reduced water quality due to concentrated levels of stormwater quality discharging into river, estuaries and embayments.
Ensure appropriate environmental flows are maintained/provided.
Increased erosion events.
Control sedimentation processes through use of vegetation filter strips and appropriate trapping and control structures. Protect dune barriers.
Severe weather events.
5.2
Higher reach from storm surge for coastal areas. Salt water contamination of freshwater reaches of rivers.
Re-deployment and/or construction of tidal barriers to maintain the freshwater integrity of river reaches.
Methods for Assessing Impacts on Coastal Water Resources
A key method for assessing the impact of climate change on coastal water resources is the use of catchment related hydrological models (Chiew and McMahon 2002), which require information about daily rainfall and evapotranspiration. Other models such as FLOWS and REsource ALlocation Model (REALM), which can simulate the operation of both urban and rural water supply systems, are important for determining environmental flows and assisting decision making with water allocations through relevant legislative frameworks at State levels. Howe et al. (2005) used a rainfall-runoff model (AWBM; Boughton, 2002). All of these models are quite complex to use and are appropriate for detailed regional studies. Recently, Jones et al. (2006) developed a rule-of-thumb technique to estimate potential changes in runoff due to climate change. This may be more suitable for broad-scale assessments. A number of regional approaches have been undertaken for urban and rural water resources (see Table 16). These regional strategies are being supported by river catchment specific Streamflow Management Plans (Victoria) and Water Sharing Management Plans (NSW). Groundwater resources are also being managed through Groundwater Management Regions and planning processes. The effects of climate change are starting to be considered in strategic investigations, but the uncertainty regarding regional climate changes has restricted significant consideration to date. This situation is changing, as exemplified by Howes et al. (2005).
5.3
Implications for Coastal Water Resources
The main implication for coastal water resources remains increasing pressure for water usage from urban, rural and environmental purposes. Critically, thresholds for environmental flows, particularly for estuaries, are required to sustain the health and productivity of ecosystems. The demands for water along the coast will compete over potentially dwindling sources of supply unless adaptive measures are instituted such as water savings and demand reduction strategies.
5.4
Review of previous vulnerability studies
A number of studies have examined the possible effect of climate change on water resources in Australia (Table 15) over a considerable number of the regions of Australia. Their results could form the basis of a first-pass vulnerability assessment for coastal water resources. Table 15 Studies of climate change impact on water flows in coastal Australia Study Chiew and McMahon (2002)
Scenario CSIRO (1996)
Region North-east coast East coast South-east coast
_____________________________________________________________________ Coastal Vulnerability Gaps Analysis – Australian Greenhouse Office
Effect on runoff -5 to + 15% by 2030 -15 to +15% by 2030 -20 to 0% by 2030
74
Chiew et al. (2003)
Several models
Howe et al. (2005)
CSIRO (2001)
Tasmania South-west coast Eastern Australia South-west Australia Central coast Victoria
-10 to +10% by 2030 -25 to +10% by 2030 -6 to -3% by 2035 -7% by 2035 -11 to -3% by 2025; -35 to -7% by 2050
A confounding factor for climate change impacts is increased water demand caused by rapid population growth in coastal regions. This is the main mechanism causing water resources to become vulnerable, with the impact of climate change often considered a secondary effect. This has been recognized in the recent water strategy documents that have been compiled in all States. Table 16 summarizes the conclusions of these documents. Vulnerability might be defined in this context by the need to invest in major infrastructure or to implement major water conservation measures. Note that not all of these recommendations have been adopted. For example, the NSW government has recently proposed that a desalination plant will be built in Sydney, despite NSW (2004) recommending this only as a last resort. This decision has not yet been finalised, however. In contrast, the government of Western Australia has approved a desalination plant as part of their core strategy for water infrastructure in the Perth region. Even so, some future scenarios of climate change indicate that some additional infrastructure beyond this may be necessary. Changes in land use may also influence water supply. Future fluctuations in demand for coastal water resources may be caused by increased rural residential development and increased development of small dams capturing water runoff. Increased timber plantation and harvesting activity, particularly within areas where timber production results in significant landscape character changes, may alter hydrological patterns, impacting on water supply to rivers, lakes and wetlands. In addition, the studies in Table 16 refer largely to maintaining urban uses of water, but a large portion of water allocation to coastal users goes to irrigation (e.g. WRSC 2002). Table 16 Recent water strategy documents Study
Region
WRSC (2002)
Victoria
NSW (2004)
Sydney
Uncertain
South Australia (2005)
Adelaide
Assumed reduction in water supply of 10% by 2025
Western Australia and CSIRO (2005)
South-west WA
Scenarios of future reduction in water availability
Howes et al. (2005)
Melbourne
See Table 15
QDNRM (2006)
South-east QLD
Notional 15% cut in water availability for scenario purposes
5.5
Climate change effect Implied a conservative water strategy needed
Major infrastructure recommended None; water conservation measures None; management and conservation measures None; management and conservation measures Current plans for desalination plant and increased groundwater use, but some additional infrastructure may be required Conservation and management; some infrastructure may be required after 2020 Major new infrastructure required
Gaps and critical thresholds
The study by Howes et al. (2005) is the most detailed to date, but the methodology used in it has not been applied uniformly in other locations in Australia. In the context of water resource issues, a critical threshold might be whether considerable additional infrastructure is required to guarantee minimum flow rates of water to users. Unfortunately, it cannot be guaranteed that individual State authorities have used nationally-consistent methodologies and approaches to assess this need. A first pass vulnerability assessment may therefore utilise previous impact studies (as summarised in Table 15) overlaid with a nationally consistent assessment of the resulting vulnerabilities to particular water flow rates.
_____________________________________________________________________ Coastal Vulnerability Gaps Analysis – Australian Greenhouse Office
75
5.6
Feasible assessment options
First pass vulnerability assessment •
Summary of previous assessments of changes in environmental flows plus Jones et al. (2006) estimates, overlain with estimates of current vulnerability.
_____________________________________________________________________ Coastal Vulnerability Gaps Analysis – Australian Greenhouse Office
76
CHAPTER 6: Coastal infrastructure 6.1
Introduction
Coastal infrastructure includes buildings, roads, maintained parklands, coastal defence works – all of the infrastructure required to support coastal communities. This section summarizes previous work that has been done on assessing the vulnerability of this infrastructure to climate change, and identifies areas where more work is required. Table 17 shows a vulnerability matrix for coastal infrastructure. Naturally, a crucial climate change variable for coastal infrastructure effects is sea level rise, as increased sea level can potentially lead to increased coastal erosion and coastline recession (Bruun 1962; Stive 2004; Zhang et al. 2004 ). Other impacts could come from the effects of changes in wind climates (speed and direction), temperatures, and rainfall intensities. Table 17 Vulnerability matrix for coastal infrastructure Infrastructure Coastal dwellings and commercial property
Climate change effect Sea level rise Increased tropical cyclone winds Sea level rise
Ports and harbours; airports; coastal refineries; marinas
Offshore platforms
Increases in wind/wave heights
Increased frequency of cyclonic winds and higher storm surge Increases in wind/wave heights and current speeds
Roads
Sea level rise; increased peak rainfall
Subterranean power lines/cables
Sea level rise Increased rainfall intensity
Storm water Sea level rise Maintained parkland
Sea level rise
Coastal defence structures
Sea level rise
Submarine pipelines
Sea level rise and increased wave heights and bed currents during storms
Beaches
Sea level rise & increased waves
Island communities (e.g. Torres Strait)
Sea level rise and increased storminess
Canal estates
Sea level rise
Potential impact More frequent inundation More frequent damage, both wind and wave (storm surge) Little impact expected under normal conditions because facilities are designed for maximum historical tides plus a storm surge event. Possible delays to ship movements with consequent disruption to ship schedules. Can affect road/rail access & product storage through wind, rain, water effects. The combined effects can also constrain production (in open cut mines, etc). Also potential damage to breakwaters, navigational aids, etc. Possible planning, safety issues for small and pleasure craft. More likelihood of damage or inundation. Shipping delays. Delayed ship loadings caused by more frequent shutdowns. Delays to support vessel functions. More frequent inundation, damage to structures protecting roads More frequent inundation; increased seepage resulting in need to protect cables More frequent flooding, combined with more frequent seaborne inundation Drainage rates/volumes decreased Erosion, coastal recession, undercutting of maintained paths/walkways More frequent overtopping of sea walls Coastal recession would require shoreward extension of jetties Seawalls and jetties may need to be raised Breakwaters may become less effective due to higher sea levels, or may fail due to larger waves Pipeline may need additional stabilization – anchors, rock backfill or burial to remain stable Loss of beach width and therefore beach amenity. Potential erosion of land if beach totally inundated Loss of erosion buffer for storms Islands are generally low lying so that sea transport facilities need to have increased levels (ramps, jetties) and land backing levels need to be raised Originally built with minimal freeboard. Land levels may need to be increased when housing rebuilt
_____________________________________________________________________ Coastal Vulnerability Gaps Analysis – Australian Greenhouse Office
77
6.2
Methods for assessing impacts on infrastructure
Climate simulations are a primary method to assess the impact of climate change on infrastructure. This section focuses on the impact models that are used once the basic climate change scenario has been constructed. Coastal erosion is the main mechanism by which climate change could have an impact on infrastructure. Methods for assessing coastal recession have been detailed in Chapter 2, which outlines the importance of both sea level rise and sediment variability. As mentioned in Chapter 2, digital elevation data are crucial for assessing the impacts of sea level rise. In the “first pass” vulnerability assessment of Sharples (2004), fundamental vulnerability factors were first identified for each shoreline type, and the vulnerability assessment was then performed based upon these factors, using a digital elevation model. The assessment was limited by the vertical resolution of the DEM, which was only 2 m, insufficient for detailed, site-specific evaluation of vulnerability. Digital elevation data must be very accurate for assessment of vulnerability to sea level rise. The best source of early data on land levels and shoreline position is historical aerial photography dating back to the 1930’s. Once coastline recession has occurred, the adjacent infrastructure may become exposed to increased episodes of sea flooding and wave damage. GIS techniques are needed to assess the cost of impacts of coastline recession (e.g. Hennecke et al. 2004). Such techniques would be very site-specific, however, and would not necessarily be needed for a first-pass assessment of vulnerability. Rather, they would be useful for more local studies later, once vulnerabilities have been identified. Some regions may be affected by increased peak wind speeds, especially tropical areas (e.g. see Walsh 2004). The impact of increases in wind speeds may be assessed by wind damage models. The prediction of damage (in dollars) from extreme winds requires two major inputs: hazard models and vulnerability curves. The hazard model focuses on the wind storm hazard itself, and makes use of historical meteorological data and statistics to predict potential wind speeds at a site into the future. Vulnerability curves attempt to predict building (and sometimes contents) damage, given the occurrence of a particular wind speed. The possible effect of climate change on increased wind speeds is primarily reflected in the hazard model. Vulnerability curves for a building are affected by a number of factors: e.g. building geometry (especially the roof), and material and type of construction. However, the major factor is the age of the building, and the building codes and standards in force at the time of construction.
Vulnerability models are usually expressed in the form of the expected fraction, or percentage, of building value destroyed, given the occurrence of a maximum wind speed during a severe storm. The latter is usually taken as a maximum gust speed. If the vulnerability curve for a single building is of interest, the gust speed at the top of a building (e.g. average roof height) would normally be used. A vulnerability curve for a population of buildings would be based on a wind gust speed at a standard reference position, such as ten metres height in open terrain.
An increase of tropical cyclone strength due to global warming has a potential to increase significantly the level of damage experienced in coastal regions in Australia. For example, the design wind speeds for the coast of Queensland and Northern Territory are equivalent to Category 4 cyclone levels, according to the Australian standard for wind actions, AS/NZS1170.2:2002 . Consequently, a genuine Category 5 cyclone at landfall on these coastlines would be expected to produce extensive wind-induced damage.
A first-pass vulnerability assessment of potential wind damage might take the form of the identification of regions where projections indicate possible increases in wind speed, combined with an assessment of whether these projected changes would exceed design standards for this region. Preliminary work along these lines has been performed by Walsh et al. (2001). Increased rainfall intensity in some locations may cause storm water infrastructure to be flooded more frequently. Methods to assess this effect would be highly site-specific, as is storm-water drainage capacity. One way to assess vulnerability may be through a survey of members of peak professional organisations such as the Stormwater Industry Association, in order to identify locations that are vulnerable to flooding in the current climate, and from there determine whether they may become more or less vulnerable in the future. _____________________________________________________________________ Coastal Vulnerability Gaps Analysis – Australian Greenhouse Office
78
At a more local and specific level, the interaction matrix approach recommended by the National Committee on Coastal and Ocean Engineering (2004) provides a way of identifying possible hazards for a specific location. It may be too detailed for a first-pass assessment, however. Many coastal locations are vulnerable to storm surge. Storm surge models can be used to assess the likely hazard from increased sea level rise, combined with changes in wind climate. Estimates of storm surge hazard, however, are highly site-specific, in that to obtain an accurate estimate of storm surge height, detailed information is required on land topography as well as ocean depth, which in practice can be quite time-consuming to obtain. On the other hand, much of this work has already been completed for many locations along the Australian coastline (e.g. Harper 1999; QDNRM 2004), so a first-pass vulnerability study may simply involve compilation of those studies into a coherent national picture.
6.3 Brief review of previous vulnerability assessments and identification of gaps 6.3.1 Wind damage studies The first vulnerability curve and risk model for cyclone damage to housing in Australia was developed by Leicester (1981). Walker (1995) developed some empirical curves for Queensland housing for the insurance industry. Since then various other insurance and government groups have developed their own in-house vulnerability models. These curves (percentage damage versus gust wind speed) typically have an ‘S’ shape with little damage below a certain threshold, then a rapid increase just above the nominal design wind speed. The vulnerabilities of other infrastructure structures, such as those in petrochemical plants, are more difficult to determine, because of the uncertainty in the coefficients in converting wind speeds into wind pressures and forces on the structures. Generally, much less effort has been devoted to the determination of these coefficients for open structures in wind tunnels than there has been for closed buildings. There have been many evaluations of severe wind risk in the current climate (e.g. AGSO 2001). There has been less work performed on wind risk in a warmer world. Comparison of wind return periods in a warmer world compared with existing design standards was detailed in Walsh et al. (2001). It was noted that in parts of northern Queensland, existing design standards might be exceeded in a warmer world under plausible climate change scenarios. Little progress has been made since then on improving the climate change scenarios that dictate the precise amount of future vulnerability.
6.3.2 Ports and harbours, marinas, and coastal airports Note that harbours here refers to the physical infrastructure around harbours and not to the actual water itself. Queensland Transport (1999) assessed vulnerability of Queensland transport infrastructure, including ports, to climate change. Additional assessments on the vulnerability of coastal infrastructure were undertaken by QDNRM (2004b). While specific case studies of the vulnerability of ports to climate change have not been performed, ports have generally used the National Committee on Coastal and Ocean Engineering guidelines (NCCOE 2004) to make allowance for climate change effects. Major new port infrastructure is thoroughly assessed for the impacts of climate change in the design phase. These studies are often documented in Environmental Impact Statements if one is prepared. For example, the proposed new offshore wharf structure and expanded coal terminal in the Port of Abbot Point in Queensland (WBM, 2006) studied a number of greenhouse potential impacts. The new facilities were designed for expected water level changes predicted over the next 100 years (conservatively estimated at 0.2 metres to 0.5 metres), plus cyclonic events that may occur at a one in 100 year frequency. New port infrastructure therefore is well prepared for the impact of climate change.
_____________________________________________________________________ Coastal Vulnerability Gaps Analysis – Australian Greenhouse Office
79
There is still significant port infrastructure in Australia more than 20 years old. Older port infrastructure has generally been designed for peak tidal events and expected storm surges. During normal conditions, this still provides a significant height buffer over the sea level change expected in the next hundred years. However, older infrastructure may have an increased frequency of impact over time in extreme storm surge conditions. Temporary damage to infrastructure or short-term interruptions to operations may occur, but ports will generally accommodate the climate change well. As new infrastructure is built to replace older infrastructure, ports will continue to improve their ability to manage the impacts of climate changes. Port facilities need adequate water depth. Thus sea level rise should be of benefit, and most ports have constructed their wharves to allow approx. 2 - 3 metres deck clearance above the expected highest tides, Changes to sediment transport due to changes to ambient flows or increased storm frequency and/or intensity may lead to requirement for more frequent maintenance dredging with associated economic and environmental impacts (e.g. dredge plumes) Refineries are often located in low-lying, coastal regions and may be potentially vulnerable to sea level rise. PB Associates and AGO (2006) concluded that the potentially vulnerability of Australian refineries to climate change was low, however. Some of Australia’s major airports are located in low-lying regions immediately adjacent to the coast: Sydney and Brisbane are two of these. Runways at Sydney Airport have been built on reclaimed land that presently sits only a few metres above sea level under normal sea level conditions. The vulnerability of Brisbane Airport to storm surge was evaluated before its construction (BBW, 1979), but to our knowledge no assessment of its vulnerability has been performed due to sea level rise. Note that the DEM data for Brisbane used by AGSO in its vulnerability assessment of South-East Queensland (AGSO 2001) pre-dates the airport and the Fisherman Island port area, both of which have been considerably filled.
6.3.3 Buildings (industrial and commercial; residential) The main threat to coastal built infrastructure is shoreline recession, as detailed in Chapter 2. Many studies have assessed the vulnerability of portions of the Australian coastline to sea level rise, but few have explicitly used detailed GIS systems to assess the resulting impact on infrastructure. Hennecke et al. (2004) performed such a study for Collaroy/Narrabeen Beach in Sydney. This study explicitly assessed the monetary cost of coastal recession and sea level rise, through use of a GIS and coastal simulations. This level of detail would be difficult to obtain nationally, yet it is essential for evaluating the actual cost of these effects at the local scale. Storm surge can affect built infrastructure, and changes in storm surge climate are one consequence of sea level rise. In some locations, this may be combined with increases in surface wind speeds, which will exacerbate the problem. Previous studies include AGSO (2001), McInnes et al. (2003) and Hardy et al. (2004), but there are others for locations around Australia. These studies have used state-of-the-art storm surge models combined with estimates of sea level rise, usually simply taken from IPCC estimates of global sea level rise, often combined with an estimate of local land/sea movement due to geological effects. Subsidence, being an extremely local phenomenon, is usually not included. Some studies (GEMS 2005) also specifically considered impact of sea level rise on wave runup.
6.3.4 Roads and bridges Coastal roads in particularly low-lying regions may be vulnerable to climate change (Austroads 2004). The causes of vulnerability would be similar to those for buildings, although bridge infrastructure is particularly long lasting, with design lifetimes of 100 years, which implies a longer planning horizon. A vulnerability assessment of coastal bridges would require first the identification of bridges in vulnerable locations, which to our knowledge has not been done comprehensively for all of Australia.
_____________________________________________________________________ Coastal Vulnerability Gaps Analysis – Australian Greenhouse Office
80
6.3.5 Subterranean infrastructure (storm water, power lines) Recent work has suggested, although not with particularly high confidence, that global warming will lead to an increase in the magnitude of severe rainfall events. The resulting impacts on urban drainage have been assessed for some regions of Australia (Smith 1999; Abbs et al. 2000). These studies involved the use of rainfall/ runoff models, combined with detailed information regarding the impact of flood heights on the infrastructure at a specific location. Coastal vulnerability of subterranean infrastructure may be exacerbated in some locations by the combination of increased high rainfall events and increased seaborne flooding caused by sea level rise.
6.3.6 Non-built infrastructure e.g. maintained parkland The vulnerability of non-built infrastructure is similar to the vulnerability of undeveloped coastlines or beaches (see Chapter 2), with coastal recession the main impact.
6.3.7 Coastal defence structures (sea walls, groynes, breakwaters, jetties) It appears that few studies have been performed on the specific vulnerability of coastal defence structures; by definition, these structures are built to last. The real question is whether they would become less effective under certain future conditions. A sea wall that is regularly overtopped provides less protection than one that isn’t. Coastline recession in some locations may require the shoreward extension of jetty structures. Breakwaters and groynes may become less effective due to changes in coastline orientation. Coastal defence structures have been built along the foreshores of most population centres and Government Defence facilities. Large portions of Port Phillip Bay, Adelaide metropolitan beaches and Brisbane metropolitan beaches have been protected from further erosion by the construction of seawalls. Seawalls or other protective structures have been built to protect historical defence facilities such as at Point Nepean and Swan Island in Victoria, Cockburn Sound and Onslow in W.A., Darwin Patrol Boat Base and naval facilities in Port Jackson. Elsewhere, large sections of the foreshore have been protected by coastal structures, though this has not always been a wise decision due to subsequent unintended impacts on coastal processes such as sediment transport. Examples occur at Lonsdale Bight, Portland and Grantville (Western Port Bay), Victoria; Sandy Bay, Tasmania; Townsville (now rectified), Qld: and Geraldton, W.A., which is now being rectified.
6.3.8 Submarine infrastructure (e.g. pipelines) Infrastructure located on the seabed is susceptible to changes in sea levels and storm intensity and frequency. The combined effects of changes to the wave and bed currents may result in increased forces on the infrastructure and may increase the mobility of seabed sediments, resulting in either scour or the undermining of the infrastructure. Increase in sea level will increase local wave heights for a given level of atmospheric forcing, but bottom effects (orbital wave velocities) may be attenuated by the concurrent depth increase. Most pipelines have stabilization in the form of anchors and rock covering, or burial by trenching. Present practice tends to exclude a direct assessment of the implications of sea level rise and other associated Greenhouse implications. Fortunately, the current practice in the oil/gas industry is to allow for the 10,000 year return period event in their design development – therefore for current or recent projects adequate consideration of sea level and climate change impacts are included. However, for older, ongoing production facilities this may not be the case. A review should be undertaken of existing submarine infrastructure to determine whether it has design recognition of the impacts of sea level rise and associated increases in wave and current strengths.
_____________________________________________________________________ Coastal Vulnerability Gaps Analysis – Australian Greenhouse Office
81
6.4
Planning issues and vulnerability assessment
6.4.1 Introduction Methods for addressing the impact of climate change on the coast include not only technical evaluations. There are several policy issues that need to be addressed, particularly when coastal infrastructure (e.g. Figure 7) is involved. Even if data and technical information were perfect, there would still be gaps in our management of coastal resources due to governance issues, and hence potential vulnerability.
Planning systems and schemes All State Governments address climate change and its relationship to coastal vulnerability under either a coastal policy or natural resource management plan. Planning schemes provide the statutory policy direction to guide planning decisions on land use and development and specify the information and the scope of assessment required for land use and development proposals. The planning schemes establish land use zones, development overlays or policy schedules which direct where different forms of land use can occur and what standards or criteria must be satisfied for development activity.
Figure 7. A coastal town that shows some of the planning issues and potential vulnerability as a result of a combination of past planning, “seachange” pressures and likely coastal impact of climate change Source: Climate Change and the Coastal Communities of NSW and SE QLD. Integrating greenhouse with strategic, urban and rural planning. - Des Schroder DIPNR (NSW), 3 June '05 - Regional Forum on Climate Change & Coastal Communities, Lismore.
6.4.2 Drivers for Planning There are a number of key drivers on the ability of land use and development planning to deal with coastal vulnerability arising from climate change (see Box).
Drivers for and constraints on planning for coastal vulnerability arising from climate change 1. Responsibilities in a federal system: Because planning is a state government responsibility, there is limited involvement or direct influence of the Federal Government on planning, legislation, policy or administration. Also, there is a fragmentation of planning policy on climate change-related coastal vulnerability and adaptation measures between state and local governments. 2. Information for planners: Information supplied by scientists is often not in a useable form, with the scientific uncertainty of climate change forecasts and coastal vulnerability a problem for communities and council representatives. There are few guidelines and tools that planners can use to address coastal vulnerability due to climate change. 3. Resources at local government level: There is a lack of resources and adequate expertise for local government to undertake coastal vulnerability studies and consequential planning scheme amendments. 4. Decision-making horizons: Short operational horizons constrain decision makers from viewing issues in the long to very long term. This is compounded by the level of uncertainty and the scope and cost of conducting investigations (Coastal Vulnerability Case Studies, (Waterman 1996). 5. Lack of information about adaptation: There is little local information on how coastal ecosystems may cope and adapt to climate change in order for appropriate planning responses to be developed. There has been limited cost benefit analysis to assess adaptation options/measures on an environmental, social and economic basis.
As a result of constraints identified in the box, to date there has been a limited response to coastal vulnerability caused by climate change. The majority of planning that has been undertaken relates either _____________________________________________________________________ Coastal Vulnerability Gaps Analysis – Australian Greenhouse Office
82
to addressing flooding issues through building floor level heights and identification of land areas liable to flood hazard; or to identification of coastal erosion hazard zones (erosion lines) usually based on 50 year scenarios e.g., Gosford City Open Coast Beaches Coastal Management Plan (WBM Oceanics, 1995). Moreover, while State coastal plans may recommend adoption of strategies to combat sea level rise and other impacts of climate change, local councils may not necessarily include such measures in their planning schemes. For example, a recent survey (Hebert and Taplin 2004) showed that less than 30% of all Sydney Coastal Councils had any reference to climate change in their planning and management policies. Thus a national audit of local planning schemes could serve as an initial vulnerability assessment for planning.
6.4.3 Gaps in planning that affect vulnerability Plan making needs to identify, assess and seek to implement appropriate adaptation strategies/ measures for climate change induced coastal vulnerability (See Box). General principles for planning for coastal vulnerability due to climate change: • Identify the key vulnerable areas or communities threatened by coastal vulnerability due to climate change. • Evaluate effects and identify appropriate adaptation responses for vulnerable areas. • Develop standards for methodologies employed to quantify risks • Co-ordinate coastal vulnerability and climate change data - provide information to assist decision-makers in risk assessment and make reference to existing documents, maps, overlays, digital data and studies. • Identify tools (planning codes, incentive programs or landholder agreements) to facilitate or enhance vegetation linkages currently in private ownership, particularly through climatic regions. • Recommend that States develop planning policies for climate change along the coast. • Make recommendations for incorporation into tools such as planning schemes, local laws or guidelines/codes of practice specifically addressing climate change issues.
Strategic planning should be proactive, to reduce costs associated with asset protection and repair, interference and dislocation of community lifestyle and amenity, loss of infrastructure and community facilities such as protective structures, water and sewerage infrastructure, roads and sporting facilities. A related benefit of strategic planning may be a reduction of insurance cost increases. Planning therefore has considerable scope to increase adaptability and reduce vulnerability of communities. A comprehensive vulnerability assessment that Gaps in planning needs (for planning to reduce vulnerabilities) included consideration of adaptive capacity 1. Risk management methodologies to assess and prioritise action may therefore include consideration of for responding to coastal vulnerability impacts, coupled to existing gaps in planning needs. cost/benefit analyses of adaptation options.
6.4.4 Planning options for Coastal Vulnerability
2. Strategic plans to include climate change assessment and adaptation options.
With respect to planning for climate change, 3. Improved technical capabilities of planners: an improved understanding of the nature and extent of vulnerability to events State and local governments who are such as flooding, landslides, coastal inundation, erosion, and responsible for planning do have some ecosystem changes. issues to address, including co-ordinating 4. Access to data, information and implementation tools by how they establish the thresholds for planners, which are relevant to coastal vulnerability risks. vulnerability and the appropriate courses of action that may be required to avoid, minimise and manage climate change processes and effects. The key information required from a planners’ perspective is how far the sea will reach landward (and how often) so that setbacks and buffer zones can be established with credibility that is defensible in forums such as the Land and Environment Court, VCAT, and so on. A national first approach to assessing climate change coastal vulnerability is critical to identify key areas and environments that would be subject to impact. This would be followed by a second, more detailed and specific assessment of vulnerability which targets areas where impact of climate change on the coast will affect communities. Local governments, through planning schemes, are in a key position to implement strategies to meet the challenges associated with climate change induced coastal vulnerability impacts. For example, adaptation _____________________________________________________________________ Coastal Vulnerability Gaps Analysis – Australian Greenhouse Office
83
strategies could be incorporated into planning schemes, using general coastal management principles such as protection, accommodation, adaptation and retreat. A national audit of local planning schemes would enable assessment of the current state of preparation for climate change at the local level. Locations with a large amount of potentially vulnerable infrastructure and little planning response for climate change issues would be candidates for detailed local study. Moreover, a national audit would enable localities to highlight the resource limitations that in many cases may be limiting their planning. Thus the first-pass vulnerability assessment would serve as a means of identifying priority locations for second-pass study.
6.5
Climate-related thresholds
Sea level rise Planning schemes in most Australian local authorities rely upon estimates of the recurrence interval of floods to determine siting regulations for developments: for instance, the 1 in 100 year flood event. Often, a freeboard is imposed above this level, indicating that the floor height of any new construction should be at least above that level. If sea level rise were to occur, this freeboard height may disappear, increasing the risk of unacceptable levels of flooding. This constitutes a climate-related threshold for sealevel rise. Many councils already include an allowance for sea level rise in their planning schemes (e.g. Betts 2001).To assess the prevalence of such thresholds, local planning schemes would need to be collated and compared. Other thresholds could occur for sea defences if sea level rise led to their being overtopped on a much more regular basis than their design threshold. These effects would be highly site-specific. In most locations, an obvious threshold for infrastructure would occur if coastline recession reached the point where it began to undermine the foundations of built infrastructure along the coast. This is already occurring in a number of locations in Australia e.g. Byron Bay, and is the subject of vigorous local debate. In some jurisdictions event based guidelines have been developed; for example, in Western Australia planning may be based on storm surge and wave run-up associated with a design storm occurring concurrently with the mean high water spring tide and the accepted (State) prediction for sea level rise. Increased tropical cyclone winds One important threshold here is the design standard for building construction. If increased tropical cyclone wind speeds caused this to be exceeded, the standard might have to be revised in the future, although this is by no means certain. Another important threshold is posed by the prospect of increased inundation caused by a combination of slightly stronger tropical cyclones and sea level rise. An example has been given for Cairns by McInnes et al. (2003). The effect of this increased occasional inundation would be for more regions of a city to become lower than the 1 in 100 year flood level, a commonly-used threshold for development permission. Increased rainfall intensity Crucial thresholds here include exceedance of design standards for urban stormwater removal infrastructure, and increased riverine flooding, leading to more regions of the city exceeding the planning threshold for flood recurrence.
6.6
Data and research needs
There is always a need for improvement in basic climate data and climate change scenarios, but many other studies have detailed these requirements. This section focuses on the specific needs of coastal vulnerability assessment of infrastructure.
_____________________________________________________________________ Coastal Vulnerability Gaps Analysis – Australian Greenhouse Office
84
One key data gap is separating the effects of natural erosion, relative sea level rise caused largely by man-made factors, and subsidence. As mentioned in Chapter 2, a key data resource in this effort is aerial photography, which has been undertaken since the 1930s and provides a valuable archive to determine the actual rate of coastal recession. Much of these data are poorly maintained and archived, and a program of recovery and cataloguing is needed. Accurate elevation data appears to be crucial in any assessment of the vulnerability of infrastructure to sea level rise. Such data is not always easy to obtain. A good starting point is a DEM developed by Geoscience Australia, which is accurate to at least 0.3 to 0.5 m for some regions such as South-East Queensland – still only marginal for estimating the effects of sea level rise. Even so, not all areas of the coastline are at fine resolution (AGSO, 2001). The national 9 second DEM currently available from AGSO has a vertical resolution of 10 m, completely inadequate for sea level rise studies. Sharples (2004) performed additional analysis to achieve a vertical resolution of 2 m, which is more useful for coastal vulnerability studies, when combined with information on the geomorphic type of the coastline. A technique that offers considerable promise is laser altimetry, which has been employed on the U.S. West Coast to map the height of the coastline to an accuracy of 10-15 cm, which is adequate for sea level rise studies (Sallenger et al. 1999). Mapping the entire Australian coastline using this technique would cost several million dollars, but results could be obtained in less than a year. Detailed modelling studies to investigate impacts on storm surge and related wave runup levels are also highly dependent on the availability of accurate bathymetric data. An assessment is required to determine the seaward coverage, resolution and accuracy of such data to meet the modelling requirement. The establishment of a catalogue identifying existing coverage held in public and private data-bases would be of value, with priorities for new data collection then to be established. GeoScience Australia has an existing bathymetric gathering program in support of its tsunami risk program. The vulnerability of coastal infrastructure would be determined in large part by the value of that infrastructure. Thus GIS systems incorporating land use and economic value data are needed for vulnerability assessment. A number of such GIS systems have been developed for various locations. Again, Geoscience Australia would be an appropriate starting point for accessing such data. The current vulnerability to tropical cyclone wind damage for engineered structures is well estimated by the Australian Standard for wind loading, which divides Australia into a number of zones depending upon the estimated return period of extreme winds. Increased damage to engineered buildings, from climate change would come not from an increase in winds itself, but from any exceedance of loads in the current design Standard. Thus this would need to be evaluated. The construction of domestic housing and other small buildings should be governed by the Building Code of Australia, which uses the Australian Standard for guidance on wind loads. However, it is by no means clear that the latter is being adhered to, and the vulnerability of these buildings is also affected by local construction practices and inspection procedures. For example, there is strong evidence that the increased wind loads experienced by buildings in exposed topographic situations are not being properly accounted for. To assess properly the vulnerability of coastal infrastructure to wind damage requires detailed surveys of existing building stock, and of significant features such as roof shape, construction materials, and whether fully engineered or not (commercial and industrial buildings are usually fully designed by professional engineers, whereas housing is usually not). Such surveys are required for all communities within about 100 kilometres of the coastline in the tropics. Geoscience Australia is carrying out such surveys, but only for a couple of specific cases (i.e. Cairns, and Innisfail after Cyclone ‘Larry’). After establishing the relevant properties, vulnerability curves (i.e. percentage damage versus gust wind speed) are required to predict damage. Again, Geoscience Australia, with assistance from several other groups, has a programme to achieve this, but with limited funding support.
_____________________________________________________________________ Coastal Vulnerability Gaps Analysis – Australian Greenhouse Office
85
6.7
Feasible assessment options
First pass vulnerability assessment • A collation of coastal aerial photography to establish a time history of coastline position • Collection of existing coastal DEM information, including analysis to improve vertical resolution where needed, combined with information on coastal geomorphological types • National audit of local coastal planning schemes to determine their level of adaptation to climate change • Survey of coastal tropical housing stock, followed by comparison of existing design standards to projected changes in wind speeds • National database of storm surge estimates • Survey of Stormwater Industry Association members to evaluate current vulnerability of stormwater infrastructure Second pass vulnerability assessment • Laser altimetry of coastline, especially areas of high vulnerability identified in the first pass assessment • Local studies using GIS coupled with socio-economic data to estimate economic vulnerability to climate change (especially sea level rise) •
National GIS database of population, housing and infrastructure near the coast.
_____________________________________________________________________ Coastal Vulnerability Gaps Analysis – Australian Greenhouse Office
86
CHAPTER 7: Aquaculture and fisheries 7.1
Introduction
Australian fisheries (commercial and recreational) target finfish, crustacean, and molluscan species from marine, estuarine, and freshwater habitats. In 2003-4 the value of Australia fisheries production was $2,095 million from a catch of 273 kt. Much of the increase in fisheries production (Figure 8) has been a result of the rapid growth in aquaculture in recent years. This growth is mainly due to developments in Tasmanian salmon production and tuna ranching operations of South Australia (Newton, et al. 2006). Figure 8. Real value of Australian fisheries production and exports. Source: ABARE 2005
For the purposes of this report, commercial and recreational fisheries are referred to as capture fisheries and aquaculture refers to the cultivation of marine (mariculture either offshore or onshore) and freshwater species for the purpose of harvesting for a commercial purpose. Overseas studies have variously shown relationships between near-shore fish stocks or catches and a wide range of climate-related variables: sea surface temperatures, currents, upwelling, downwelling, winds, turbulence, monsoons, rainfall, river flow, salinity and sunshine. Both simultaneous and lagged relationships have been found, and it has been observed that some species vary simultaneously over wide regions. A very useful summary can be found in Balston (In prep.). There are, however, very few assessments of the impact of climate change on either Australian fisheries or aquaculture in the literature. Table 18A, located at the end of the chapter, summarises studies of sensitivity of various Australian species. A report currently with the AGO by CSIRO (Hobday et al, In press) provides a review of the work relating fisheries/aquaculture to climate variability and change, and considers what the impact of climate change may be on these systems. The authors also recommend five possible studies that would provide the industry in general with the greatest immediate understanding of the impact of climate change. These are outside the scope of a first pass vulnerability assessment. This chapter will complement and extend Hobday et al (In press) by: • providing details of relevant models, methods and data, • detailing the existing vulnerability of the industry • providing more information on estuarine, freshwater, and aquaculture systems • providing an assessment of the best methods and data to use for a first pass vulnerability assessment.
7.2
Brief review of Fisheries and Aquaculture
7.2.1 Sensitivity of Fisheries and Aquaculture to Climate Change A general framework in which to assess the impact of climate change on fisheries is presented in Figure 9. There are many direct and indirect ways by which climate forces affect biological processes in the coastal zone ecosystems. Changes in the processes of the pathways shown over a range of spatial and temporal scales will most likely have a large impact on living marine resources and the economies and communities that depend on them.
_____________________________________________________________________ Coastal Vulnerability Gaps Analysis – Australian Greenhouse Office
87
Figure 9 A general framework for assessment of the sensitivity of fisheries to climate variability and change (adapted from Mahon (2002)).
Figure 10 summarises species studied in the context of climate variability and the key climate parameters that influence them. These are only a fraction of the species targeted by Australia’s fishing industries. Most of the studies dealing with impacts of climate variability on Australian fisheries involve tracking indicators of change, studying cause-effect relationships, and modelling. Details of methods and data are discussed in following sections. The levels of vulnerability in the diagram (Figure 10) are referring to the status of the fishery in terms of fishing sustainability (as explained in detail in the note below the diagram). As shown, there is a wide range of levels depending on the fishery. Most of the fisheries designated over-fished or fully fished have active management programs addressing the situation. These management programs do not incorporate any climate change impacts. Global assessments The sensitivity of fisheries to climate fluctuations has been assessed in many regions of the world. Most of these fisheries operate in nutrient rich areas of eastern ocean boundary currents where the long-term climate signals are easier to identify (e.g. Peruvian fisheries). Useful comparisons between these studies and Australian fisheries are most valuable when considering the impact of climate change on the geographical limits of species distribution. However, due to the uncertainty regarding the mechanisms linking climate and biological systems such transference of results regarding population size is limited.
_____________________________________________________________________ Coastal Vulnerability Gaps Analysis – Australian Greenhouse Office
88
B▼
Darwin
●●
Leanyer Swamp
BP □ ○ ► ■~▼ TP ▼○
Gulf of Carpentaria
Burdekin R.
●
B►
Species (Vulnerable (V), Not vulnerable (N), Uncertain (U)):
Climate drivers: ↨ Air pressure ○ ENSO Australian salmon AS(V) ► Freshwater flows Pilchards SA P(N) Exmouth Gulf Banana prawn BP(U) » Leeuwin Current Barramundi B(V) Saucer scallops S(V) ▼Rainfall Brown trout BT(U) School prawn SP(U) ● Salinity Shark Bay Gemfish Eastern G(V) Shark Bay scallops SS(V) □ Sea level Gemfish Western G(U) Tiger prawn TP(N) ◙ Storms Jack mackerel JM(U) Western rock lobster WL(V) ■ Temperature Dongara King George Whiting K (U) Whitebait W(U) ~ Wind ◙ »▼ Lobster L(U) Western king prawn Shark Bay WP(V) Mud crab MC(V) Western king prawn Broome WP(N)
TP ▼ ◙
Australian herring AH(U)
●
S» WP »
Penaeid prawns PP(N) Pilchards WA P(V)
B▼► BP ▼ Fitzroy R. ● MC ▼ ►
●
W» AS » AH »
● Perth
Yellowfin Tuna Y (U)
Clarence R. Hunter R.
● ●
●
PP ■ ▼ BP ■ ▼ SP ►
SP ►▼
Sydney ●
Albany
● P»
AS » AH »
● Adelaide ●
WA / SA / VIC Herring and Salmon fisheries
Melbourne
Y■
K~
G~
● ●
Great Lakes Hobart
BT ■ JM ~
L↨
Lo bst er
WL □
●
Brisbane ● Logan R.
TA fish S / V eri IC / es NS W
SS □
Figure 10 A summary of species which previous studies have identified are sensitive to climate variability. Also shown are their main areas of harvest and levels of vulnerability Note: The references for climate sensitivity studies are in Table 18A, located at the end of the chapter and in Appendix C. Definitions: Vulnerable (overfished or fully fished): a depleted fish stock (a biomass below the limit reference limit). Not vulnerable (underfished): a fish stock that has potential to sustain catches higher than those currently taken. Uncertain: a fish stock that might be not overfished, underfished, or subject to overfishing, but for which there is inadequate information to determine its status. (Adapted from Balston 2006). (Source of status information: http://www.deh.gov.au/coasts/publications/index.html#fisheries.).
Table 18 summarises the sensitivity of each of the large-scale systems to climate-drivers and the level of understanding of that sensitivity. The key risks posed by climate impacts for capture fisheries include: • Changes to habitat • Changes to nutrient supply • Changes in productivity, migration, health of these systems and stocks • Changes in population sizes, abundance • Large and small scale shifts in geographic distribution of species •
Social & economic risks due to reduced catches and unavailable species.
The key risk areas for aquaculture include: • Growth • Disease resistance, type, and frequency • Nutrition issues (appetite, feed efficiency) • Water quality/quantity • Industry Development: site selection • Destruction of cages •
Effect of climate change on food sources (e.g. pilchards for Southern Bluefin Tuna)
_____________________________________________________________________ Coastal Vulnerability Gaps Analysis – Australian Greenhouse Office
89
In summary, there are enough examples of climate-related variability to indicate that fish populations and the fishing sector will be sensitive to climate change. In addition, the current levels of vulnerability (as defined by level of over/under fishing) vary considerably between species, and will influence how vulnerable that particular species is to climate change. Currently however, there is not enough evidence to say conclusively what the impacts of climate change will be for individual species. Table 18 Systems and their Drivers Fisheries Ocean Estuarine River Aquaculture Components that may Productivity, Disease, Productivity, migration, health of these systems and stocks need consideration nutrition Climate-related drivers: sea level L H H H1 sea level- salinity H H incursions near-shore ocean H1-3 depending on H L L1 circulation patterns species wave climate -- waves/ M H H M1 swell/ beach runup storm surge M Coastal wind M1-3 M L M1 hydrological change/ L H H flow Rainfall/runoff/turbidity L H H H2 Tropical Cyclones(and extra-tropical, e.g. east L H H H1 coast lows) water temperature H3 H H H3 (ocean & fresh) Cloudiness and solar L M M M1 radiation, evaporation Air temperature L M M H2 Note: The anticipated impact of changes in the driver on the system is indicated by H, M, L. The level of understanding of the impact the driver has on a system in indicated by 1,2,3 where 1 is high understanding and 3 low. For example, an H3 category indicates a high impact on the system but with a low level of understanding of exactly what that impact will be.
7.3 Assessing potential impacts of climate change on Fisheries and Aquaculture 7.3.1 Methods In a review of conference proceedings, Brian Schuter (Aquatic Ecosystems Group, Ontario Ministry of Natural Resources) suggests that there are both direct and indirect methods with which to infer the sensitivity of fish populations to climate over time and space. The direct methods include: • assessing direct associations between observed variation over time in climatic and biological variables (e.g. (Staunton-Smith, Robins et al. 2004), • assessing direct associations between observed variation over space in climatic and biological variables (e.g. (Young et al. 2001). The indirect methods include: • Identifying synchronous biological variability between discrete stocks spread across broad geographic areas that can therefore only be explained by climate variability (e.g. (Klyashtorin 1998), • Using a mechanistic model to characterise climate-fish sensitivity in principle.
_____________________________________________________________________ Coastal Vulnerability Gaps Analysis – Australian Greenhouse Office
90
The range of models and techniques used for assessing climate sensitivity of species is presented in Table 19 . The choice of model or technique is dependent on the type of data available and the knowledge of the species. However, there are few if any Australian studies of the impact of climate change on fisheries. Most assessments of the resource base are focussed on the dynamics of a single species. Important processes that are often not incorporated include spatial dynamics such as oceanographic processes, habitat dynamics, and food chain dynamics. These components are limited by a lack of observational data and poor theory. In terms of specifically addressing the impacts of various climate change scenarios on aquatic resources, methods include:
Uncertainties There is significant debate in the literature regarding the ability of climate parameters to forecast recruitment and other biological measures required for effective fishery management. Much of this is due to the uncertainty regarding the mechanisms linking many physical and biological systems. However, as climatebased forecasts of recruitment appear to be most reliable at the limit of their geographical range, it does suggest that forecasts of recruitment could be essential for assessing the response of the geographical range of species and pest species to global warming. Such models of recruitment are presently available only for a limited number of species. Although it is generally known that aquaculture and mariculture farm productivity is related to climate-dependant processes (such as disease resistance), the quantification of this and the development of appropriate management tools has not yet occurred. The assessment of the vulnerability of aquaculture and mariculture industry development in other locations provides a useful technique to assess the impact on Australian industries, particularly with respect to site selection. However, as different species have different optimal environmental conditions, transfer of results from international regions needs to be done with caution.
•
Variations of the historical approach using statistical climate-fish relationships to predict future impacts on the particular population,
•
The mechanistic approach where mechanistic models are used to predict future impacts.
Table 19 Models, data, and system knowledge Classes of model and/or system knowledge Fisheries Stock assessment models based on biological processes & including climate parameters. Correlative model between climate and fishery parameters, e.g. Robins et al 2005 Ocean circulation models (larvae dispersal). e.g. Caputi et al 2003 Aquaculture Disease model Nutrition model
Data required & quality (availability, length)
Typical scope & scales (temporal & spatial)
Utility for climate change work
Deficiencies
issues
Typical ownership
Many do not have climate parameters. Parameter estimation. Nonstationarity. Lack of spatial dynamics.
Poor observational data resulting in poor accuracy & precision. Age data is preferred.
Data: State or Commonwealth Government depending on who manages the fishery.
Possible spatial resolution
Poor observati onal data.
Data: Research organisation.
Production (catch) Effort/vessel details, age, recruitment
Single species Localised
If the model includes climate parameters: high. If not: nil.
Catch/effort, recruitment
Single species
As above
Multi species Spatial scale limited by processes considered
high
Disease
Species specific
Nutrition requirements
Site location
All approaches are data intensive: they require long-term monitoring programs which, although in place in Australia, are either restricted to a few species (e.g. King George Whiting) or have only been _____________________________________________________________________ Coastal Vulnerability Gaps Analysis – Australian Greenhouse Office
91
implemented in recent years. However, in many cases there is still sufficient information to assess climate sensitivity at some level: such information would include catch data, international studies of same/similar species, or from a conceptual model, for example. In summary, the climate sensitivity of the range of species identified in Figure 10 may well have been determined by a range of techniques depending on the species (e.g. knowledge of life cycle etc) and the data available. A first pass assessment of the impact of climate change will require knowledge of the technique used to assess the specific species climate sensitivity (as further explained in Section 7.4.1).
7.3.2 Data required To assess effectively the impact of climate change on fisheries a wide range of data “types” is required. The data required for much of the modelling in Table 19 are available for only a few species, and collection is usually an expensive long-term exercise. Such data include post-larval data (e.g. Jenkins 2005 collected data from 1993 to 2003), rock lobster puerulus (e.g. Caputti et al 2001 display data from 1969 to 2001), year-class data (e.g. (Staunton-Smith, Robins et al. 2004). Researchers are strongly recommended to examine the report by Bruce, Bradford et al (2002) reviewing the biological and ecological information and data available for the south-east marine region. There appears to be no similar such detailed review for other regions or fisheries. The alternative is to monitor changes in the fishery itself, that is, to use catch and effort statistics. The Fisheries Statistics Working Group (FSWG) that reports to the Standing Committee on Fisheries and Aquaculture, has the mandate of facilitating national fisheries statistics reporting and improving the coordination of fisheries data collection. In most states these catch data are a legislative requirement of all fishery license holders. The information is reported by days (usually averaged into months) across a grid of statistical squares. The length of the catch and effort data is summarised in Table 20. When using these data it is important to be aware of caveats including the use of voluntary logbooks in early datasets and the lack of recorded information regarding vessel and gear details. The problem of scale is particularly relevant in analysing climate related impacts on fish populations (Cushing 1982). Climate change on the scale of five to ten decades or so extends much further than most of the Australian fisheries data which extend to between 20 and 40 years. Fisheries arise and disappear on the scale of many decades primarily owing to changes in the recruitment, changes in the incoming year classes to the stocks. Published papers of Australian climate-fish relationships that have covered long timeframes include: King George whiting 1945-2004 (Jenkins 2005), banana prawns 1970-1998 (Vance et al 1998), western rock lobster 1971-2002 (Caputi et al 2003), spiny lobster and southern blue fin tuna 1945-1985 (Harris et al 1988), barramundi, mudcrabs, and prawns 1945-2000 (Robins et al 2005). Table 20 Summary of the period and length of State and Federal catch and effort databases Fishery
Time period
Dates range from starting from 1976 to 1997 running til present. Most start between 1985 and 1990. Annual catch summaries 1940 til 1993 NSW Most monthly catch & effort 1984 til present 1993 til present Northern Territory Marine scalefish daily/monthly catch/effort 1976 til present Inland waters, rock lobster 1983 til present South Australia Prawn trawl, scallop, pilchards 1990 til present Aquaculture 1992 til present Most from 1985 til present Tasmania 1978 til present Victoria Aquaculture 1998 til present Compulsory logbooks: monthly catch/effort data 1965 til present. Western Australia Other start dates range from 1962 to1998 Key fisheries 1988 til present Queensland Note: There are data that will fall outside of these summaries. Most, but not all, data are in electronic databases Commonwealth Fisheries/Industry
_____________________________________________________________________ Coastal Vulnerability Gaps Analysis – Australian Greenhouse Office
92
7.3.3 Research needs Further research is needed in order to enable mitigation or adaptation of the possible effects of climate change on the fishery sector in Australia. There is presently not enough conclusive evidence of climate change impacts to enable fishery managers to address the issue legislatively. Internationally, the sector is more advanced due to the large amount of research on effects of El Niño and decadal climate oscillations on fisheries environments and resources. Although Australian fisheries lack quantitative predictions of climate change impacts, there is evidence suggesting affects on fisheries could be expected via an intricate set of direct and indirect mechanisms including effects on fisheries habitat, fish populations, their prey, the harvesting sector and fishing communities. General issues to be dealt with in terms of gaps in research, data, and methods include: • Long-term monitoring of aquatic biota. • Analysis of local, regional, and national changes in the response of the resource to climate change. • Analysis of aquaculture sustainability (e.g. changes in culture systems, species, location). • Analysis of socio-economic impacts of any changes. • Enhancement of funding. • Enhanced debate at regional levels.
7.4
Feasible assessment options
7.4.1 First pass vulnerability assessment (FPVA) Given the likely time frame of 12-24 months in which to complete a FPVA, Figure 11 is presented as a possible methodology for analysis of capture fisheries. It is limited to species that already have a climateparameterised model (i.e. mostly those in Figure 10) that can be appropriately adapted to receive climate data from climate change models. Such a model can range from a larvae-dispersal model (e.g. Caputi et al. 2003) which includes boundary wind or current parameters modified for global warming scenarios, or a simple ocean-model that has characteristics known to influence population distribution (e.g. Young et al 2001), to a regression-based model again with suitable climate parameters (e.g. Robins et al 2005). The former technique requires no additional fishery data (e.g. larvae data), while the latter technique can be developed two ways. Firstly, the empirical model can be used “as is”: that is without any additional fisheries data, simply using climate parameters from climate change scenarios. Secondly, the empirical model can be tested and extended using updated climate and fisheries data, and then for the assessment using the climate change data for the required climate parameter. This second option of testing and further developing the empirical model is clearly the preferred option, however may be limited by unavailable fisheries data depending on what sort of data the model requires. Biological data may well not have been updated, however updated catch data most likely will be available. Nevertheless, the appropriateness of using models based on catch data must be assessed as there are many caveats.
_____________________________________________________________________ Coastal Vulnerability Gaps Analysis – Australian Greenhouse Office
93
Figure 11 Possible framework for a first pass vulnerability assessment for capture fisheries (adapted from Robins et al, 2005) Table 18A Studies of the sensitivity of various fisheries species to climate variability or change in Australia Reference (see below) 3, 15 15
Species Australian Herring Arripis geogianus Australian Salmon Arripis truttaceus
6, 17, 22, 26, 27, 31, 33, 34, 35, 38
Banana prawn Penaeus merguiensis
5, 7,10, 11, 22, 23, 25, 28
Barramundi Lates calcarifer
13 18 30 12 37 13 22 29 3, 8, 15
Brown Trout Salmo trutta trutta Damsel fish Pomacentridae sp. Gemfish Rexea solandri Jack Mackerel Trachurus declivis King George Whiting Sillaginodes punctata Lobster Mud crab Syclla serrata Penaeid prawns Various species Pilchards Sardinops sagax neopilchardus
Key Findings Recruitment affected by the strength of the Leeuwin current (SA). Strength of recruitment affected by the strength of the Leeuwin Current (SA). Positive correlation between catch & SOI (NT), rainfall (QLD, GoC), tide levels (GoC), summer flow (GoC), temperature (GoC), winds (GoC). Emigration out of rivers affected by monsoon rainfall (GoC). Temperature and rainfall explain variation in postlarval and juvenile catch (QLD). Recruitment affected by variations in salinity (QLD) & timing, intensity and duration of the monsoon wet season rainfall (NT, GoC) & river flows (QLD). Abundance & growth rates positively correlated with fresh water flow (QLD). Catch affected by flow & rainfall 2 years previous (QLD). Correlation between air temperature and numbers (TAS). Onshore wind & larval supply (GBR QLD) Peaks recruitment match periods of strong zonal westerly winds (TAS). Changes in geographical distribution in response to SSTs, ENSO and Zonal Westerly Winds (TAS). Strength of zonal westerly winds correlated with catch 3 to 5 years later. Significant positive correlation between ENSO and catch at 0 lag (Port Phillip Bay). Significant relationship between TAS, NSW and NZ lobster catch and ZWW, Darwin, Hobart and Macquarie Island atmospheric air pressure. Variation in catch explained by autumn fresh water flow & annual rainfall (QLD). Catch related to temperature of inshore water & rainfall at some previous optimal time lag (QLD). Strength of 2 year old recruits, population structures and production affected by the Leeuwin Current (WA).
_____________________________________________________________________ Coastal Vulnerability Gaps Analysis – Australian Greenhouse Office
94
Saucer scallop Amusium balloti School prawn Metapenaeus macleayi Shark Bay Scallops Amusium balloti
14, 15 9, 24 4
Strength of recruitment affected by the strength of the Leeuwin Current (WA). Monthly production & seaward migration affected by freshwater flow (NSW). Correlation between rainfall and catch (NSW). Inverse relationship between sea level & recruitment (WA).
32, 34, 39
Tiger prawn Penaeus semisulcatus Penaeus esculentus
Rainfall the most important environmental variable in abundance of post-larval prawns (GoC) and total catch (WA). Significant negative correlation between monthly SOI for August – December and total annual catch residuals of P. semisulcatus and August – April for P. esculentus (GoC).
15
Western King Prawn Peneaus latisulcatus
Strength of recruitment affected by the strength of the Leeuwin Current (WA).
1, 19, 36, 41
Western Rock Lobster Panulirus cygnus
16, 18, 20, 21 3 40
Various species Whitebait Hyperplphus vittatus Yellowfin Tuna Thunnus albacares
Environmental variables, including rainfall, the strength of the Leeuwin current, winter/spring storms & sea level fluctuations driven by ENSO the main cause of fluctuation in lobster settlement (WA). The number of species, abundance and biomass of fish in rivers rose with increases in salinity & temperature (WA). Positive correlation between catch rate of recreational and commercial fish river flow (QLD). Positive correlation between catch and strength of Leeuwin Current (WA). Warm eddy areas increase the levels of chlorophyll a, zooplankton and micronekton and correlate with CPUE.
References key for Table 18A (above) 1. 3. 5. 7. 9. 11. 13. 15. 17. 19. 21. 23. 25. 27. 29. 31. 33. 35. 37. 39. 41.
(Caputi and Brown 1993) (Caputi, Fletcher et al. 1996) (Davis 1985) (Dunstan 1959) (Glaister 1978) (Griffin 1986) (Harris, Davies et al. 1988) (Lenanton, Joll et al. 1991) (Love 1987) (Pearce 1988) (Platten 1999) (Robins, Mayer et al. 2006) (Sawynok 1998) (Staples and Vance 1987) (Stephenson and Williams 1981) (Vance, Staples et al. 1985) (Vance, Haywood et al. 1998) Vance, D.J. et al. (2003) Jenkins, G.P. (2005) Penn, J.W. & Caputi, N. (1986) Caputi, N. et al. (2001)
2. 4. 6. 8. 10. 12. 14. 16. 18. 20. 22. 24. 26. 28. 30. 32. 34. 36. 38. 40.
(Caputi, Chubb et al. 1993) (Caputi, Penn et al. 1998) (Dredge 1985) (Fletcher, Tregonning et al. 1994) (Griffin 1985) (Harris, Griffiths et al. 1992) (Joll and Caputi 1995) (Loneragan, Potter et al. 1987) (Milicich 1994) (Platten 1996) (Robins, Halliday et al. 2005) (Ruello 1973) (Staples and Vance 1986) (Staunton-Smith, Robins et al. 2004) (Thresher 1994) (Vance, Haywood et al. 1996) Catchpole, A & Auliciems, A. (1999) Caputi, N. et al. (2003) Meager, J.J. et al. (2003) Young, et al. (2001)
Key for Table 18A: CPUE – Catch per unit effort GBR – Great Barrier Reef GoC – Gulf of Carpentaria ENSO – El Niño Southern Oscillation NT – Northern Territory, Australia NZ – New Zealand NSW – New South Wales, Australia QLD – Queensland, Australia SA – South Australia SOI – Southern Oscillation Index SST – Sea Surface Temperature TAS – Tasmania, Australia VIC - Victoria, Australia WA – Western Australia ZZW – Zonal Westerly Winds _____________________________________________________________________ Coastal Vulnerability Gaps Analysis – Australian Greenhouse Office
95
CHAPTER 8: Selected other coastal activities 8.1
Introduction
This section will concentrate on tourism, national parks, protected coastal and marine areas, health and safety. These are important but selective elements of human activity in the coastal zone with potential economic impacts. While there are human coastal activities (such as population movements and pressures) for which governance and jurisdictional issues may need to be addressed when considering capacity to adapt to climate change, they were beyond the scope of this report and may be considered for later vulnerability studies. Refer to Chapter 6, section 4 on planning issues for an indication of the issues for planning and management for the coastal zone. Table 21 shows a vulnerability matrix for this specified set of coastal activities. Vulnerability for infrastructure, beaches, natural systems, etc., has already been discussed in previous chapters. The vulnerabilities of the human activities are mostly linked to the vulnerabilities in those systems. Table 21 Vulnerability matrix for selected other coastal activities Coastal activity
Relevant vulnerable systems
Potential impact
Tourism and recreation
Infrastructure Beaches Visited coastal environments
Seasonal shifts or changes in tourism numbers Potential damage to tourism destinations Additional costs to tourism industry Extra days lost in some locations; more outdoor days in others
National parks and protected areas
Coastal environments Including: Beaches, Coral reefs, Mangroves, seagrasses, estuarine environments
Loss or shift of eco-zone visited by tourists Viability of park or protected area to fulfil its original conservation or heritage function
Health and safety
Infrastructure, estuaries, ecosystems, water resources
Increased or decreased mortality and morbidity Shifts in geographic range of some diseases
8.1.1 Tourism
Tourism industry
A large part of Australian tourism has a The contribution of an industry to the overall production of goods and services in an economy is measured by gross coastal or part coastal orientation. Of the ten value added (GVA). The tourism industry share of total most popular attractions to international GVA is of the order of 3.5% (source ABS website), and the visitors to Australia, eight are within the share of total employment is around 5.6%. Therefore the coastal zone, namely Phillip Island, the tourism industry is a significant industry sector with Great Barrier Reef and islands, the Great possibly some risks from climate change. Ocean Road, Noosa, the Gold Coast, the Wet Tropics coastal area, and Fremantle (Henrick et al 2000).
8.1.2 Australia’s RAMSAR5 sites and other protected areas Australia has 64 declared RAMSAR sites of which 35 are coastal and 6 are located on offshore islands (on North Keeling Island, the Coral Sea reserves, Elizabeth and Middleton Reefs Marine National Nature Reserve, the Dales on Christmas Island, Ashmore reef and Hosnie's spring on Christmas Island). Australia has 10 marine protected areas (MPA) under Commonwealth protection, located in all climate zones around our coastline. Under a national agreement, the National Representative System of Marine Protected Areas, covering about 7% of Australia’s territorial waters (excluding those of the Australian Antarctic Territory), aims to cover representative biodiversity around the coast. 5
The Convention on Wetlands, signed in Ramsar, Iran, in 1971, is an intergovernmental treaty, and protected sites are commonly known as RAMSAR sites. _____________________________________________________________________ Coastal Vulnerability Gaps Analysis – Australian Greenhouse Office
96
Australia has 24 properties/places on the National Heritage List (as of April 2006) of which around four are coastal. In addition, there are four coastal places with assessment under way for addition to the National Heritage List. There are 16 Australian properties/places on the World Heritage list (as of April 2006) of which eight are coastal or marine. Each of these has specific values related to World Heritage values.
8.1.3 National parks – Commonwealth and State The Federal Government manages 18 sites that are coastal or marine national parks, including places as far away from the mainland as Macquarie Island Marine Park and Heard Island and McDonald Islands Marine Reserve and Conservation Zone. Individual States manage many additional coastal national parks and marine national parks and marine sanctuaries. For example, Victoria has 24 marine national parks and marine sanctuaries and 19 coastal parks, plus 5 coastal parks or reserves or river entrances around Port Phillip Bay. Many of these are quite small and occupy narrow coastal zones, so could in theory be quite vulnerable to climate change. States, Northern Territory and Federal websites for parks and reserves are given in the box (the ACT, being land-bound, does not have any coastal parks or reserves). States, Northern Territory and Federal websites for parks and reserves www.parkweb.vic.gov.au/ www.epa.qld.gov.au/parks_and_forests/ www.epa.qld.gov.au/parks_and_forests/marine_parks/ www.calm.wa.gov.au/national_parks/index.html www.calm.wa.gov.au/national_parks/marine/index.html www.environment.sa.gov.au/coasts/gabmp/ www.nationalparks.nsw.gov.au/ parks.nsf/ http://www.service.tas.gov.au/Nav/Heading.asp?Topic=Environment%2C+land+and+water&Heading=National+park s+and+wilderness+areas http://www.nt.gov.au/nreta/parks/ http://eriss.erin.gov.au/parks/index.html
For the parks and reserves managed by the Australian Government, each protected area has a Management Plan created using the collective knowledge of traditional owners, the community and relevant stakeholders (http://www.deh.gov.au/parks/managementplans.html). Many of the management plans do not include a requirement to consider or conduct an assessment of vulnerability to climate change.
8.1.4 Health and safety Altered health and safety risks as a result of climate change include increased heat stress, reduced winter cold stress, changing disease patterns linked to temperature and water quality (e.g. food poisoning), risks to health and safety from altered severe wind regimes or flooding regimes and spread or amplification of infection risk from insect born diseases (e.g. dengue fever). The magnitude of health impacts will be influenced by the local environmental conditions and social behaviors (resilience), and the range of possible adaptations by individuals or communities. Therefore a comprehensive vulnerability assessment will need to incorporate some study of resilience and adaptability. In the first instance, regions, zones and communities with potential risk can be identified.
8.2
Methods for assessing impacts and identification of gaps
For protected areas, the methods for assessing impacts are basically the same as for other non-protected geographic areas (see the chapters on beaches, coastal environments and coastal infrastructure). These _____________________________________________________________________ Coastal Vulnerability Gaps Analysis – Australian Greenhouse Office
97
include the feasible methods for assessing impacts of sea level rise, storminess, salt intrusion and thermal stress, identified in those chapters. There are some specific issues associated with national parks and heritage sites which are discussed below.
8.2.1 Nat parks, marine parks and offshore sites Not enough is known on whether our parks and protected areas are generally viable in size to withstand natural climate variability, usage and other pressures, let alone whether they are adequate in size to cope with climate change. Thus information is sparse on whether there is sufficient redundancy built in to our national parks systems. There is inadequate knowledge on whether the ecosystems within national parks can adapt at a pace rapid enough to keep pace with the possible rate of climate change. The issue of whether some of the ecosystems will adjust gradually or intermittently (e.g. the freshwater saltwater interface in Kakadu National Park) is complex, requires “The absence of a time series of reference data hinders the vulnerability assessment. … there is a strong case for a national environmental reference station further research and may not be concentrating on time series broad scale biophysical monitoring of coastal change assessable within a first pass in the wet-dry tropics.” vulnerability assessment. “Long-term monitoring of the biophysical parameters in the wetlands and their
catchments and adjacent seas are required in order to provide an adequate spatial There is a gap in knowledge and temporal database that itself must be contained within an effective information about tourist visitation to management system.” protected areas (data are often not broken down by individual Supervising Scientist Report No 123: Vulnerability assessment of predicted national parks, protected areas, climate change and sea level rise in the Alligator River region, Northern Territory of Australia. marine protected areas, etc). Fire risk is one of the biggest issues for many land based national parks, including coastal national parks and the combined effect of human modification of the landscape and climate change with regard to fire behaviour is inadequately understood for a comprehensive vulnerability assessment for national parks (discussions with various DEH staff).
The parks and reserves managed by the Australian Government do not have detailed digitised topographic maps to the vertical resolution (less than about 0.5m) needed for sea level rise incursion studies and there is no central repository for these data (information from the Office of the Director of National Parks); and this would be true for most of the coastal parks around the Australian coastline managed under other jurisdictions. Nevertheless, broad estimates of the potential fractional loss of area at coastal sites due to sea level rise could be obtained from overlaying GIS shapefiles of known heritage and park localities with the 3 second digital elevation model (DEM) for Australia, although the uncertainty of the estimates will vary because of inconsistencies in the DEM. This may be a starting point for vulnerability assessment for these sites. Within DEH, ERIN has developed distribution maps of flora and fauna listed under the EPBC Legislation and have GIS mapping capability for these. These distribution maps are first-pass indicative maps which provide a broad database at national scale. They have been derived using a range of assessments and empirical relationships. It may be possible to develop vulnerability assessments for biomes of protected areas based on models such as BIOCLIM/OZCLIM, testing the impact of climate scenarios from climate model outputs, combined with an expert assessment process6. For RAMSAR sites, the Inland Waters Section of DEH is gradually and progressively compiling ecological character descriptions for all the sites – these ecological character descriptions will contain in descriptive terms information relevant to determination of social and environmental values of the sites; these may therefore be useful as a starting point to extend vulnerability assessments for the sites beyond impact assessments.
6
A number of groups have the capability to run the models BIOCLIM/OZCLIM and map outputs using GIS, including ERIN, CSIRO, some CRCs and universities. _____________________________________________________________________ Coastal Vulnerability Gaps Analysis – Australian Greenhouse Office
98
For protected areas that depend on estuaries, impacts on the littoral zone and sedimentation assessment are important to assessing the sensitivity of the sites to environmental impacts. Sensitivity studies could be undertaken for estuaries based on storminess, rainfall and temperature inputs to sedimentation and estuarine response models. A couple of models are potentially useful (e.g. SEDnet and SERM – see Chapter 3 for further information). All of the above suggests a need for a coordinated study to tease out information for a second pass vulnerability assessment (VA).
8.2.2 World Heritage (WH) and National Heritage (NH) sites Where the world heritage or national heritage site is an environmental site, the issues are the same as described above for protected areas. Some sites contain buildings or artefacts of national or international significance; additional issues are listed in Table 22. Table 22 World Heritage and National Heritage coastal sites that contain buildings or artefacts Type of listing National Heritage (Australian heritage database: www.deh.gov.au/heritage/na tional/ Australia’s World Heritage http://www.deh.gov.au/herita ge/worldheritage/
Site
Status
Sydney Opera House Port Arthur Historic Site Fremantle Prison Recherche Bay (possible remains of garden from d'Entrecasteaux expedition) Great Ocean Road Sydney Opera House Kakadu National Park (paintings and rock art)
Listed Listed Listed Listed pending Listed
Additional issues
Possible loss, partial loss or damage to buildings or artefacts Possible additional management of underground seepage
Need for vulnerability assessment?
Mainly a sea level issue
Listed
Key gaps for parks and heritage sites are: • Whilst a national assessment has not been made of the proportion of each site at possible risk from sea level rise, capability exists to determine this to the accuracy available from topographic maps and in particular the best available DEM; • The sites normally do not have general vulnerability/risk assessments; • Values of the sites are not fully identified. Cultural or heritage values are often known and well described, socioeconomic valuations less so. In principle, social and environmental values could be identified for listed heritage places. The Australian Heritage Assessment Tool (DEH) can provide information on species richness and endemism values for affected areas that should give an indication of biodiversity impacts.
8.2.3 Tourism and recreation While tourism is a crucial industry for the Australian coastal zone, it also creates pressures on the natural and cultural environment, affecting resources, economic activities and land uses in local communities. In order to assess impacts of climate change on tourism, assessment of the underlying tourist destinations is first required (see Beaches, Estuaries and Coastal Ecosystems), followed by an assessment of risks to tourist infrastructure. There are few studies along these lines. Recent studies of climate change and assessment of risk for tourism have been regional, local or featurespecific in focus (e.g., Specht, In prep., for the Cooperative Research Centre [CRC] for Sustainable Tourism). A national approach could assess the tourist-based industries, tourist sites and tourist-related infrastructure that have the highest economic value.
_____________________________________________________________________ Coastal Vulnerability Gaps Analysis – Australian Greenhouse Office
99
8.2.4 Health and safety A major study on climate change and Baseline health information human health was conducted by A recent report that may be useful to determine current McMichael et al (2003), and followed up baselines in health is Australia's Health No. 9 (2004), the ninth a year later with a report prepared for the biennial health report of the Australian Institute of Health and Australian Medical Association and the Welfare, providing a national source of information on Australian Conservation Foundation patterns of health and illness, determinants of health, the supply and use of health services, and health services (Woodruff 2004). These reports provide a expenditure. A general environmental health risk assessment national perspective, already contain methodology applicable to the range of environmental health useful national maps and can therefore hazards has been developed under the framework of the form the basis for a vulnerability National Environmental Health Strategy and Department of assessment for those aspects of human Health and Ageing. The methodology, “Environmental Health Risk Assessment: Guidelines for assessing human health risks health and safety which affect coastal from environmental hazards: June 2002” is available from regions of Australia. The data from these http://www.health.gov.au. studies could be combined with results from the first-pass vulnerability assessments for potential infrastructure damage, flood risk, estuarine intrusion, etc, using a combination of expert assessment and mapping to create a useful first past assessment of vulnerability within the coastal zone to the health risks identified in these studies.
8.3
Climate-related thresholds
For protected areas, parks and heritage sites, significant thresholds are mainly linked to a sea level rise above a level that would inundate the building or artefact or protected flora or faunal habitat7, or result in large shifts in the salt-fresh water interface. The degree of threat that projected sea level rise poses over a future time horizon has not been systematically assessed for parks and protected areas, although tools such as GIS and protected species data bases make this possible in principle, at least to a first order, first pass assessment (DEH communication). Critical thresholds for tourism in the coastal zone relate to thresholds that significantly reduce tourism economic activity (loss of beaches or iconic destinations, reduction in coral reef size, tourist health concerns, significantly higher frequency of tourism site outages, etc.). For human health and safety, thresholds relate to events that overload the health/hospital system, events that exceed building design or coastline setback standards and hence put lives at risk, and introduction/generation of large new health risks (e.g. endemic malaria). These are complex and may best be left to a second phase of a vulnerability assessment.
8.4
Data and research needs
Previous chapters have specified the underpinning data and research needs for the environmental and infrastructural systems on which the human activities discussed in this chapter depend. For heritage sites, an excellent source of basic data are the ERIN databases, www.deh.gov.au/erin/, although these are snapshot data, with no trend or change information for considering temporal trends. For parks and protected areas, priorities are to digitise detailed maps, assess the need for flora and fauna corridors, and improve the assessments of viability of ecosystems as a function of size. Gaps identified for the different types of site are provided in Table 23.
7
Note that there are very few fauna totally dependent on a sea edge that does not move and therefore potentially vulnerable to sea level rise – most are capable of moving inland if necessary. There are some fauna whose habitat is confined to the back part of mangrove forests and therefore may be at risk. _____________________________________________________________________ 100 Coastal Vulnerability Gaps Analysis – Australian Greenhouse Office
Table 23 Suggested gaps to fill for parks and protected areas Type RAMSAR MPA NH WH Nat Parks
Priority gaps to fill Improve salt-fresh water interface understanding Better understand degree of robustness to gradually rising SST and air temp Improve tourism/visitor data Improve tourism/visitor data Probability estimates of loss of size Overall national assessment of robustness of “total” parks and protected areas system
Common requirement(s)
2nd pass priority Differentiate data needs for low, mid and high latitude sites
Survey of elevation and sea incursion risk for subset of sites from each category
Species movement Survey of elevation and sea incursion risk for all sites. Redundancy assessment for each park. Vulnerability to lack of flora/fauna corridors
For tourism, a collation of information for the highest value tourism precincts would be a useful start. A comparative assessment of the vulnerability of Australian vs. overseas tourist destinations would also be useful. For a second pass vulnerability assessment, it may be useful to review the Tourism Carrying Capacity (TCC) approach and assess its utility for assessing vulnerability to climate change. The basic concept is to determine the capacity of local systems to sustain tourism (http://ec.europa.eu/comm/environment/iczm/pdf/tcca_en.pdf). To this end, it may be useful to encourage a small study of this approach for the Australian situation. Tourism in protected areas is often associated with appreciating and observing nature. Carrying capacity relates not only to the protection of nature and the functioning of ecosystems but also the quality of experience of visitors. Changes in carrying capacity, if they could be calculated, may provide a good marker of the vulnerability of this type of tourism to climate change. Tourism in coastal zones may be linked to construction, infrastructure and land development. Carrying capacity issues include tourist density, the use of beaches and tourist infrastructure, congestion of facilities and sea pollution. Using a “changes in carrying capacity” approach may be useful for coastal zone tourism generally. For human health and safety, the primary requirement is probably to link the results from recent studies with the detailed mapping capabilities coming from the other components of the vulnerability assessment.
_____________________________________________________________________ Coastal Vulnerability Gaps Analysis – Australian Greenhouse Office
101
8.5
Feasible assessment options
The following are suggested for a first pass vulnerability assessment.
8.5.1 Parks and protected areas Given resources and priorities, a first pass vulnerability assessment (FPVA) would probably concentrate on collation of information and mapping for a subset of sites, as follows: 1. Using expert assessment, choose a subset of iconic and /or critical parks and heritage sites, with representation from each State and the Northern Territory, and including offshore sites and location in different climate zones; 2. for the subset, collect photographic and satellite image resources and survey data (historical where available and current, to create a baseline of visual information); create a database; 3. map possible sea level incursion for these sites (as part of the mapping requirement for the overall vulnerability assessment); 4. link with estuaries, beach, mangroves and corals studies for relevant impact data; 5. review possible threats from hydrology change or bushfire change where relevant; 6. use an expert judgment process to provide implications for system vulnerability; 7. map or tabulate the above results in terms of low, medium or high vulnerability, and assessed certainties and uncertainties.
8.5.2 Tourism 1. Collect and refine tourism data to finer geographic scale, select high-earning locations for study; 2. tabulate potential site impacts and tourism infrastructure at risk; 3. using first pass vulnerability assessment from other relevant sectors to assess impacts on tourism; 4. map or tabulate the above results in terms of low, medium or high vulnerability, and assessed certainties and uncertainties.
8.5.3 Health and safety Combine McMichael et al (2003) report data with vulnerability maps produced for sea level rise, temperature change and estuary impact and produce maps for the various health risks.
*********
_____________________________________________________________________ Coastal Vulnerability Gaps Analysis – Australian Greenhouse Office
102
Appendix A The nature and type of vulnerabilities that are possible for the coastal zone. These can be summarised as follows: • Loss of land • Loss of historic or iconic sites • Loss or degradation of world heritage or national heritage sites • Impacts on coastal cities and towns • Increased maintenance costs • Higher disaster preparedness and rehabilitation • Increased mortality and morbidity – heat stress, water quality, arbovirus, food poisoning • Increased health costs • Litigation – coastal planning • Ecosystem function loss • Interacting/compounding impacts – e.g., bilge contamination and other water stresses in harbours For climate related events such as floods and hurricanes/tropical cyclones, infrastructure is the dominant financial loss category (Albala-Bertrand 1993), and this could be expected to increase in some locations under current climate change scenarios. Internationally, infrastructure losses to extreme climate events tend to be concentrated in regions subject to hurricanes/tropical cyclones and floods, and almost half of all losses are associated with flood related damage to roads. Different types of infrastructure face different risks from changes in climate variability and changes in extremes, and flooding and wind storms appear to have the most widespread impacts on infrastructure such as buildings, bridges, roads and water systems. A full vulnerability assessment would eventually need to take this differentiation into account for an economic vulnerability assessment. It should be noted that while droughts appear to impact on infrastructure to a milder degree, they have a heavy impact on agricultural sectors.
_____________________________________________________________________ Coastal Vulnerability Gaps Analysis – Australian Greenhouse Office
103
Appendix B List of acronyms AGO ....................... AGSO..................... AIMS...................... AIMS-LTMP.......... AWBM................... BIOCLIM/OZCLIM CAPAD (DEH) ..... CRC........................ CSIRO .................... CVI......................... DEH ....................... DEM....................... DINAS-Coast ......... EAC........................ ENSO ..................... EPBC...................... ERIN ...................... FLOWS .................. FPVA ..................... FSWG .................... GA.......................... GBR ....................... GBRMPA............... GDP........................ GEMS..................... GIS ......................... GVA ....................... IGBP....................... IMCRA................... IPCC....................... LIDAR.................... LOICZ.................... MEA....................... MP.......................... MPA ....................... MSL ....................... NASA..................... NASA/JPL SRTM.. NCCAP ................. NCCOE .................. NH.......................... NLWRA………. .... NOAA .................... NRSMPA ............... NSW....................... NT .......................... OzEstuaries ............ QDNRM................. Qld.......................... RAMSAR............... REALM..................
Australian Greenhouse Office Australian Geological Survey Organisation (now GA) Australian Institute of Marine Sciences AIMS Long Term Monitoring Plan a catchment water balance model Biome-climate models with scenario generation capability Collaborative Australian Protected Areas Database ( CAPAD ) Department of Environment and Heritage Cooperative Research Centre Commonwealth Scientific and Industrial Research Organisation Coastal Vulnerability Index Department of the Environment and Heritage Digital Elevation Model Dynamic and Interactive Assessment of National, regional and global vulnerability of Coastal Zones to Climate Change and Sea-level Rise East Australian Current El Niño Southern Oscillation Environment Protection and Biodiversity Conservation (Act 1999) Environmental Resources Information Network a hydrologoical model First Pass Vulnerability Assessment Fisheries Statistics Working Group GeoScience Australia Great Barrier Reef Great Barrier Reef Marine Park Authority Gross Domestic Product Global Environmental Modelling Systems (Pty. Ltd.) Geographic Information System Gross Value Added International Geosphere Biosphere Program Interim Marine and Coastal Regionalisation for Australia Inter-governmental Panel on Climate Change Light Detection and Ranging Land-Ocean Interactions in the Coastal Zone Millennium Ecosystem Assessment Marine Park Marine Protected Area Mean Sea Level National Aeronautics and Space Agency National Aeronautics and Space Administration/Jet Propulsion Laboratory Shuttle Radar Topography Mission (SRTM) National Climate Change Adaptation Programme. National Committee on Coastal and Ocean Engineering National Heritage National Land and Water Resources Audit National Oceanic and Atmospheric Administration National Representative System of Marine Protected Areas New South Wales Northern territory Website and database developed by the National Land and Water Resources Audit and the Coastal CRC Queensland Department of Natural Resources and Mines Queensland Ramsar, Iran, the location where the Convention on Wetlands was signed in 1971 Resource ALlocation Model
_____________________________________________________________________ Coastal Vulnerability Gaps Analysis – Australian Greenhouse Office
104
SA........................... SedNet .................... SERM..................... SET......................... SRTM..................... SST......................... SURVAS ................ TAR........................ UK.......................... UN.......................... UNEP ..................... UNEP-WCMC ....... UNFCCC................ US........................... USA........................ USGS ..................... UVB ....................... VA.......................... VCAT..................... WA ......................... WCMC ................... WH ......................... WRSC .................... WMO .....................
South Australia Model relating to sediment and nutrient budgets Simple Estuarine Response Model Surface Elevation Table Shuttle Radar Topography Mission Sea Surface Temperature Synthesis and Upscaling of Sea-level Rise Vulnerability Assessment Studies Third Assessment Report United Kingdom United Nations United Nations Environment Program UNEP World Conservation Monitoring Centre United Nations Framework Convention on Climate Change United States United States of America United States Geological Survey Ultra-violet -B Vulnerability Assessment Victorian Civil and Administrative Tribunal Western Australia World Conservation Monitoring Centre World Heritage Water Resources Station Catalogue World Meteorological Organization
_____________________________________________________________________ Coastal Vulnerability Gaps Analysis – Australian Greenhouse Office
105
Appendix C References Chapter 1 Australian Greenhouse Office (2003). Climate change: An Australian guide to the science and potential impacts. Pittock, A.B. (ed.). Available at http://www.greenhouse.gov.au/science/guide/index.html. IPCC (2001) Climate Change 2001: The Scientific Basis. Houghton, J.T., Ding, Y., Griggs, D.J., Noguer, M., Van der Linden, P.J., and Xioasu, D. (eds.), Cambridge and New York: Cambridge University Press. 881 pp. IPCC CZMS (1992) A common methodology for assessing vulnerability to sea level rise, 2nd revision. In: Global Climate Change and the Rising Challenge of the Sea. Report of the Coastal Zone Management Subgroup, Response Strategies Working Group of the Intergovernmental Panel on Climate Change, Ministry of Transport, Public Works and Water Management, The Hague.
Chapter 2: Beaches Baily B & Nowell D, 1996, Techniques for monitoring coastal change: a review and case study, Ocean and Coastal Management, 32(2), pp. 85 – 95. Bird ECF (1993) Submerging coasts: the effects of a rising sea level on coastal environments. John Wiley and Sons, Chichester Bruun P (1962) Sea-level rise as a cause of shore erosion. Journal of Waterways and Harbors Division (ASCE) 88:116-130 Carter RWG & Woodroffe CD, Late Quaternary Shoreline Morphodynamics, Cambridge University Press, 1994. Carter RWG, Coastal Environments: an introduction to the physical, ecological and cultural systems of coastlines, Academic Press, London, 1988. Chapman DM, Geary M, Roy PS & Thom BG, Coastal Evolution and Coastal Erosion in New South Wales, Report for the Coastal Council of New South Wales, 1982. Chapman DM, Geary M, Roy PS, Thom BG, Coastal Erosion and Coastal Evolution in New South Wales, Coastal Council of NSW, 1982. Church, J., Hunter, J., McInnes, K. and White, N.J., 2004: Sea-level rise and the frequency of extreme event around the Australian coastline. Coast to Coast '04: Australia's National Coastal Conference, Hobart, Tasmania. Church, J. A., and N. J. White (2006), A 20th century acceleration in global sea-level rise, Geophys. Res. Lett., 33, L01602, doi:10.1029/2005GL024826. Chen, K. and J. McAneney, (in press): High resolution estimates of the world’s coastal population vulnerable to natural catastrophes. Geophysical Research Letters Chen, K. and J. McAneney, (in press): High resolution estimates of Australia’s coastal population with validations of global population, shoreline and elevation datasets. Geophysical Research Letters Cooper, J.A.G. and Pilkey, O.H., 2004. Sea-level rise and shoreline retreat: time to abandon the Bruun Rule. Global and Planetary Change, 43: 157-171. Cowell, P J and Thom, B G (1994) Morphodynamics of coastal evolution. In R W G Carter and C D Woodroffe (Eds) Coastal Evolution: Late Quaternary shoreline dynamics, Cambridge Unversity Press, (pp 33-86) Cowell, P J, Roy, P S and Jones, R A (1995) Simulation of large-scale coastal change using a morphological behaviour model. Marine Geology 126: 45-61 Cowell, P J, Thom, B G , Jones, R A, Evert, C H and Simanovic, D (2006) Management of Uncertainty in Predicting ClimateChange Impacts on Beaches, Journal of Coastal Research, 22: 232-245 Dean R G and and Maurmeyer, E M (1983) Models of Beach profile response, in P Komar and J Moore (eds) CRC Handbook of Coastal Processes and Erosion, CRC Press, Boca Raton, FL, 151-165 DEH 2005: Adelaide’s Living Beaches: A Strategy for 2005-2025, Department of Environment and Heritage, Government of South Australia Department of the Environment and Natural Resources, Report of the Review of the Management of Adelaide Metropolitan Beaches, Report of the Ministerial Reference Group, Government of South Australia, July 1997. Goodwin, I.D. 2005: A mid-shelf, mean wave direction climatology for southeastern Australia, and its relationship to the El Nino-Southern Oscillation since 1878 AD, International Journal of Climatology, 25: 1715-1729 Goodwin, I.D., Stables, M.A and Olley, J.M. 2006: Wave climate, sand budget and shoreline alignment evolution of the IlukaWoody Bay sand barrier, northern New South Wales, Australia, since 3000 yr BP, Marine Geology: 226: 127-144 Gordon AD, Lord DB & Nolan MW, Byron Bay - Hastings Point Erosion Study, Dept of Public Works NSW, 1978. Harvey, N and Caton, B (2003) Coastal Management in Australia, Oxford University Press, (342p), ISBN 0 19 553794 7 Hennecke, W., C. Greve, P. Cowell, and B. Thom, 2004: GIS-Based Coastal Behaviour Modeling and Simulation of Potential Land and Property Loss: Implications of Sea-Level Rise at Colloroy/Narrabeen Beach, Sydney (Australia). Coastal Management, 32, 449-470Komar PD (Ed) (1983) CRC Handbook of Coastal Processes and Erosion, CRC Press Boca Raton Komar PD (1976) Beach Processes and Sedimentation, Pentice-Hall, New Jersey Leatherman SP (2001) Rating beaches. In Schwartz M (ed) Encyclopedia of coastal science. Kluwer Academic Publishers, Dordrecht Leatherman SP, Zhang K, Douglas BC (2000) Sea level rise shown to drive coastal erosion. EOS 81(6):55-57 _____________________________________________________________________ 106 Coastal Vulnerability Gaps Analysis – Australian Greenhouse Office
Masselink G & Short AD, (1993) The Effect of Tide Range on Beach Morphodynamics and Morphology: A Conceptual Beach Model, Journal of Coastal Research, 9(3), 785 - 800. McLean, R and Shen, J S (2006) From foreshore to foredune: Foredune development over the last 30 years at Moruya Beach, News South Wales, Australia, Journal of Coastal Research, 22,1 (pp 28-36) Nott, J.F. (2003) Intensity of prehistoric cyclones, Journal of Geophysical Research, 108(D7), 4212, doi:1029/2002JD002726 Psuty N, (ed.) (1988) Beach and Foredune Interactions, Journal of Coastal Research Special Issue 3 Ranasinghe, R., R. McLoughlin, A. D. Short, and G. Symonds, 2004: The Southern Oscillation Index, wave climate and beach rotation. Marine geology, 204, 273-287. Sharples, C., 2004: Indicative Mapping of Tasmania Coastal Vulnerability to Climate Change and Sea Level Rise: Explanantory Report.Deaprtment of Primary Industries, Water & Enviornment (Tasmania), 126 pp. Short AD (1993) Beaches of the New South Wales Coast: Sydney, Australia: Australian Beach Safety and Management Project, 358p Short AD (1996) Beaches of the Victorian Coast and Port Phillip Bay: Sydney, Australia: Australian Beach Safety and Management Project, 298p Short AD (2000) Beaches of the Queensland Coast: Cooktown to Coolangatta. Sydney, Australia: Australian Beach Safety and Management Project, 360p Short AD (2001) Beaches of the Southern Australian Coast and Kangaroo Island: Cooktown to Coolangatta. Sydney, Australia: Australian Beach Safety and Management Project, 346p Short AD (2005) Beaches of the Western Australian Coast: Eucla to Roebuck Bay. Sydney, Australia: Sydney University Press Short AD (2006) Australian Beach Systems – Nature and Distribution, Journal of Coastal Research, 22, pp 11-27. Short AD (in press) Beaches of the Tasmanian Coast and Islands. Sydney, Australia: Sydney University Press Viles H & Spencer T, Coastal Problems: Geomorphology, Ecology and Society at the Coast, Edward Arnold, London, 1995. Wright LD & Short AD, 1984, Morphodynamic Variability of Surf Zones and Beaches, Marine Geology, 56, 93 - 118. Wright LD, Neilson P & Short AD, 1982, Morphodynamics of a macro-tidal beach, Marine Geology, 50, 97 - 128.
Chapter 3 Estuaries Australian Bureau of Statistics, 1996. Census of Population and Housing, cat. No. 2035.0, ABS, Canberra. Eliot, IG, Saynor, MJ, Eliot, M, Pfitzner, K, Waterman, P & Woodward, E 2005 (in prep), Assessment and development of tools for assessing the vulnerability of wetlands and rivers to climate change in the Gulf of Carpentaria, Australia, report prepared by the Environmental Research Institute of the Supervising Scientist and the National Centre for Tropical Wetland Research for the Australian Greenhouse Office, Canberra. Harvey, N, Clouston, B & Carvalho, P 1999a, ‘Improving coastal vulnerability assessment methodologies for integrated coastal management: an approach from South Australia’, Australian Geographical Studies, vol. 37, pp. 50-69. National Land and Water Resources Audit, 2002 Australian Catchment, River and Estuary Assessment 2002. Commonwealth of Australia, Canberra. Prosser, I., P. Rustomji, W. Young, C. Moran and A.O. Hughes, 2001. Constructing River Basin Sediment Budgets for the National Land and Water Resources Audit, CSIRO Land and Water, Canberra, Technical Report, 15/01, July 2001. Turner L, Tracey D, Tilden J, & Dennison W.C., 2004 Where River Meets Sea: Exploring Australia’s Estuaries. Cooperative Research Centre for Coastal Zone Estuary and Waterway Management. Brisbane.
Chapter 4: Coastal ecosystems MANGROVE AND SALT MARSH Adam, P. (1990). Saltmarsh ecology. Cambridge University Press, Melbourne. Adam, P. (1995). Salt marshes. In: Zann, P. L. (ed), Our Sea, Our Future Major findings of the State of the Marine Environment Report for Australia. Great Barrier Reef Marine Park Authority, Townsville Queensland Department of the Environment, Sport and Territories, Canberra. Adam, P. (2002) Saltmarshes in a time of change. Environmental Conservation. 29 (1): 39-61. Alongi, D.M., Sasekumar, A., Chong, V.C., Pfitzner, J., Trott, L.A., Terendi, F., Dixon, P., Brunskill, G.J. (2004) Sediment accumulation and organic material flux in a managed mangrove ecosystem: estimates of land-ocean-atmosphere exchange in peninsular Malaysia. Marine Geology 208: 383-402. Alongi, D.M., Trott, L.A., Wattayakorn, G., Clough, B.F. (2002) Below-ground nitrogen cycling in relation to net canopy production in mangrove forests of southern Thailand. Marine Biology. 140: 855-864. Alongi, D.M., (2002) Present state and future of the world’s mangrove forests. Environmental Conservation 29: 331-349. Applegate, R.J. (1999). Saltwater intrusion and the Mary River Wetlands of the Northern Territory. In: Streever, W.J. (ed.), An International Perspective on Wetland Rehabilitation, Kluwer Academic Publishers, Dordrecht, The Netherlands, pp. 113–120. Baldwin, A.,Egnotovich, M., Ford, M., Platt, W. (2001) Regeneration in fringe mangrove forests damaged by Hurricane Andrew. Plant Ecology 157: 149–162. Ball, M.C., and Munns, R. (1992) Plant responses to salinity under elevated atmospheric concentrations of CO2. Australian Journal of Botany 40: 515-525. Ball, M.C., Cocharane, M.J., Rawson, H.M. (1997) Growth and water use of the mangroves Rhizophora apiculata and R. stylosa in response to salinity and humidity under ambient and elevated concentrations of atmospheric CO2. Plant Cell and Environment 20: 1158-1166. Ball, M.C. (1998) Mangrove species richness in relation to salinity and waterlogging: a case study along the Adelaide River floodplain, northern Australia. Global Ecology and Biogeography Letters 7: 73-82. _____________________________________________________________________ Coastal Vulnerability Gaps Analysis – Australian Greenhouse Office
107
Bardsley, K. (1985). The effects of Cyclone Kathy on mangrove vegetation. In: Bardsley, K., Davie, J., and Woodroffe, C. (eds.), Coasts and tidal wetlands of the Australian monsoon region. Canberra, Australian National University North Australia Research Unit. pp. 167-185. Bucher, D., and Saenger, P. (1991) An inventory of Australian estuaries and enclosed marine waters: an overview of results. Australian Geographical Studies 29: 370-381. Cahoon, D.R., Reed, D.J., Day, J.W. (1995) Estimating shallow subsidence in microtidal salt marshes of the southeastern United States: Kaye and Barghoorn revisited. Marine Geology 128: 1-9. Cahoon, D.R., Day, J.W., Reed, D.J. (1999) The influence of surface and shallow subsurface soil processes on wetland elevation: a synthesis. Current Topics in Wetland Biogeochemistry 3: 72-88. Cahoon, D.R., Hensel, P., Rybczyk, J., McKee, K.L., Proffitt, E.D., Perez, B.C., (2003) Mass tree mortality leads to mangrove peat collapse at Bay islands, Honduras after Hurricane Mitch. Journal of Ecology 91: 1093-1105. Cahoon, D.R., and Lynch, J.C. (1997) Vertical accretion and shallow subsidence in a mangrove forest of southwestern Florida, U.S.A. Mangroves and Salt Marshes 1: 173-186. Cahoon, D.R., Lynch, J.C., Hensel, P., Boumans, R., Perez, B.C., Segura, B., Day., J.W. (2002a) High-precision measurements of wetland sediment elevation: I. Recent improvements to the sedimentation-erosion table. Journal of Sedimentary Research 72: 730-733. Cahoon, D.R., Lynch, J.C., Perez, B.C., Segura, B., Holland, R.D., Stelly, C., Stephenson, G., Hensel, P. (2002b) High-precision measurements of wetland sediment elevation: II. The rod surface elevation table. Journal of Sedimentary Research 72:,730-733. Caldwell, M.M., Ballaré, C. L., Bornman, J. F., Flint, S. D., Björn, L. O., Teramura, A. H., Kulandaivelu, G. Tevini, M. (2003) Terrestrial ecosystems, increased solar ultraviolet radiation and interactions with other climatic change factors. Photochemical and Photobiological Science 2:29–38. Chapman, V.J. (1974). Salt Marshes and Salt Deserts of the World. Cramer, J. (Ed. 2), supplemented reprint. Lehre. Cheeseman, J.M. (1994). Depressions of photosynthesis in mangrove canopies. In: Baker, N.R. and Bowyer, J.R. (eds.), Photoinhibition of Photosynthesis: From Molecular Mechanisms to the Field. Bios Scientific Publishers, Oxford. pp. 377-389. Cheeseman, J.M., Clough, B.F., Carter, D.R., Lovelock, C.E., Eong, O.J. and Sim, R.G. (1991) The analysis of photosynthetic performance in leaves under field conditions: A case study using Bruguiera mangroves. Photosynthesis Research 29: 1122. Cheeseman, J.M., Herendeen, L.B., Cheeseman, A.T., and Clough, B.F. (1997) Photosynthesis and photoprotection in mangroves under field conditions. Plant Cell and Environment 20: 579-588. Chen, R., and Twilley, R.R. (1998) A gap dynamic model of mangrove forest development along gradients of soil salinity and nutrient resources. Journal of Ecology 86: 37-51. Chmura, G.L., Anisfeld, S.C., Cahoon, D.R., Lynch, J.C. (2003) Global carbon sequestration in tidal, saline wetland soils. Global Biogeochemical Cycles 17: 1111-1120. Clark, D.A. (2004) Sources or sinks? The responses of tropical forests to current and future climate and atmospheric composition. Philosophical Transactions of the Royal Society B: Biological Sciences 359: 477 – 491. Clough, B.F., SIm R.G. (1989) Changes in gas exchange characteristics and water use efficiency of mangroves in response to salinity and vapour pressure deficit. Oecologia 79: 38-44. Costanza, R et. al. (1997) The value of the world’s ecosystem services and natural capital. Nature 387: 253-260. Danielsen,F., Sørensen, M.K., Olwig, M.F., Selvam, V., Parish, F., Burgess, N.D., Hiraishi, T., Karunagaran, V.M., Rasmussen, M.S., Hansen, L.B., Quarto, A., Suryadiputra, N. (2005) The Asian Tsunami: A Protective Role for Coastal Vegetation. Science 310: 643. Day, T.A., Neale, P.J. (2002) Effects of UV-B radiation on terrestrial and aquatic primary producers. Annual Review of Ecology and Systematics 33: 371-396. Drake, B.G., Muehe, M.S., Peresta, G., Gonzalez-Meler, M.A., and Matamala, R. (1996) Acclimation of photosynthesis, respiration and ecosystem carbon flux of a wetland on Chesapeake Bay, Maryland to elevated atmospheric CO2 concentration. Plant and Soil 187:111-118. Drake, B.G., Gonzalez-Meler, M.A., and Long, S.P. (1997) More efficient plants: a consequence of rising atmospheric CO2? Annual Review of Plant Physiology and Plant Molecular Biology 48: 607-737. Eliot, C., Finlayson, M. and Waterman, P. (1999) Predicted climate change, sea-level rise and wetland management in the Australian wet-dry tropics. Wetlands Ecology and Management 7: 63–81. Ellison, J.C. (1998) Impacts of sediment burial on mangroves. Marine Pollution Bulletin. 37: 8-12. Ellison, A.M., Farnsworth, E. J. (1996) Spatial and temporal variability in growth of Rhizophora mangle saplings on coral cays: Links with variation in insolation, herbivory, and local sedimentation rate. Journal of Ecology 84: 717-731. Ellison, J.C., Stoddart, D.R. (1991) Mangrove Ecosystem Collapse During Predicted Sea-Level Rise - Holocene Analogs and Implications. Journal of Coastal Research 7: 151-165. Ewel, K.C., Twilley, R.R., Ong J.E. (1998) Different kinds of mangrove forests provide different goods and services. Global Ecology Biogeography Letters 7: 83-94. Farnsworth, E.J., Ellison, A.M., Gong, W.K. (1996) Elevated CO 2 alters anatomy, physiology, growth, and reproduction of red mangrove (Rhizophora mangle L.). Oecologia 108:599-609. Galloway, R.W., (1982). Distribution and physiographic patterns of Australian mangroves. In: Clough, B.F. (ed). Mangrove ecosystems in Australia: Structure, function and management. ANU Press: Canberra. pp. 31-54. Gattuso, J.P., Frankignoulle, M., Wollast, R. (1998) Carbon and carbonate metabolism in coastal aquatic ecosystems. Annual Review of Ecology and Systematics 29:405–34. Heap, A.D., Bryce, S., Ryan, D.A. (2004) Facies evolution of Holocene estuaries and deltas: a large-sample statistical study from Australia. Sedimentary Geology. 168: 1-17. Hughes, L. (2003) Climate change and Australia: Trends, projections and impacts. Austral Ecology 28:423-443. _____________________________________________________________________ Coastal Vulnerability Gaps Analysis – Australian Greenhouse Office
108
IPCC (2002a). Climate Change 2001: Impacts, Adaptation & Vulnerability. McCarthy, J.J., Canziani, O.F., Leary, N.A., Dokken, D.J., and White, K.S. (Eds.), Contribution of Working Group II to the Third Assessment Report of the Intergovernmental Panel on Climate Change (IPCC). Cambridge University Press, UK. IPCC (2002b). Climate Change and Biodiversity. Gitay, H., Suárez, A., Watson, R.T., Dokken, D.J. (Eds). Krauss, K.W., Allen, J.A., Cahoon, D.R. (2003). Differential rates of vertical accretion and elevation change among aerial roots types in Micronesian mangrove forests. Estuarine Coastal Shelf Science 56: 251-259. Lee, S.Y. (1999) Tropical mangrove ecology: Physical and biotic factors influencing ecosystem structure and function. Australian Journal of Ecology 24: 355-366. Loneragan, N.R., Bunn, S.E., Kellaway, D.M. (1997) Are mangroves and seagrasses sources of organic carbon for penaeid prawns in a tropical Australian estuary? A multiple stable-isotope study. Marine Biology 130(2): 289-300. Lugo, A.E. and Snedaker, S.C. (1974) The Ecology of mangroves. Annual Review of Ecology and Systematics 5: 39-64. Macintyre, I.G., Littler, M.M., Littler, D.S. (1995) Holocene history of Tobacco Range, Belize, Central America. Atoll Research Bulletin 430:1-18. McKee, K.L. (1996) Growth and physiological responses of neotropical mangrove seedlings to root zone hypoxia. Tree Physiology 16: 883-889. Millenium Ecosystem Assessment 2005. Available at: http://www.millenniumassessment.org/en/index.aspx Morris, J.T., Sundareshwar, P.V., Nietch, C.T., Kierfve, B., Cahoon D.R. (2002) Responses of coastal wetlands to rising sea level. Ecology 83: 286-287. Mumby, P.J., et al. (2004) Mangroves enhance the biomass of coral reef fish communities in the Caribbean. Nature 427: 533536. Nicholls, R.J. (2004) Coastal flooding and wetland loss in the 21st Century: Changes under the SRES climate and socioeconomic scenarios. Global Environmental Change 14: 69-86. Nicholls, R.J., Hoozemans, M.J., and Marchand, M. (1999) Increasing flood risk and wetland losses due to global sea-level rise: regional and global analyses. Global Environmental Change 9: S69-S87. Pezeshki, S. R., DeLaune, R.D., and Pardue, I.M. (1992) Sediment addition enhances transpiration and growth of Spartina alternijova in deteriorating Louisiana Gulf Coast salt marshes. Wetlands Ecology and Management. 1:185-189. Poorter, H., and Perez-Soba, M. (2001) The growth response of plants to elevated CO2 under non-optimal environmental conditions. Oecologia 129: 1-20. Primavera, J.H. (1996) Stable carbon and nitrogen isotope ratios of penaeid juveniles and primary producers in a riverine mangrove in Guimaras, Philippines. Bulletin of Marine Science 58: 675-683. Ridd, P.V., Sandstrom, M. W., and Wolanski, E. (1988) Outwelling from tropical tidal salt flats. Estuarine Coastal and Shelf Science 26: 243-253. Rivera-Monroy, V.H. et al. (2004) A conceptual framework to develop long-term ecological research and management objectives in the wider Caribbean region. Bioscience 54: 843-856. Robertson, A.I., and Blaber, S.J.M. (1993). Plankton, epibenthos and fish communities. In: Robertson, A.I., and Alongi, D.M. (eds.), Tropical Mangrove Ecosystems. Coastal and Estuarine Studies. vol 41. American Geophysical Union, Washington DC. pp 173-224. Robertson, A.I., and Duke, N.C. (1987). Mangroves as nursery sites: Comparisons of the abundance and species composition of fish and crustaceans in mangroves and other nearshore habitats in tropical Australia. Marine Biology 96: 193-205. Rodriguez, C., and Stoner, A.W. (1990) The epiphyte community of mangrove roots in a tropical estuary distribution and biomass. Aquatic Botany 36: 117-126. Rogers, K., Saintilan, N., Cahoon, D.R. (2005a). Surface elevation dynamics in a regenerating mangrove forest at Homebush Bay, Australia. Wetland Ecology and Management 13: 587-598. Rogers, K., Saintilan, N., Heijnis, H. (2005b) Mangrove Encroachment of Salt Marsh in Western Port Bay,Victoria: The Role of Sedimentation, Subsidence, and Sea Level Rise. Estuaries 28: 551-559. Rogers, K. (2005) Mangrove and saltmarsh surface elevation dynamics in relation to environmental variables in Southeastern Australia. PhD Thesis. Earth and Environmental Sciences. University of Wollongong. Saenger, P., and Snedaker, S.C. (1993) Pantropical trends in mangrove above-ground biomass and annual litterfall. Oecologia. 96: 293-299. Saintilan, N. & Williams, R.J. (1999) Mangrove transgression into saltmarsh environments in south-east Australia. Global Ecology & Biogeography 8: 117–123. Semeniuk, V.(1994) Predicting the Effect of Sea-Level Rise On Mangroves in Northwestern Australia. Journal of Coastal Research 10: 1050-1076. Sherman,http://www.bioone.org/perlserv/?request=get-document&issn=0006-3606&volume=033&issue=03&page=0393 AFF1 R.E., Fahey,http://www.bioone.org/perlserv/?request=get-document&issn=00063606&volume=033&issue=03&page=0393 - AFF1 T.J., Martinez, P. (2001) Hurricane Impacts on a Mangrove Forest in the Dominican Republic: Damage Patterns and Early Recovery. Biotropica 33: 393–408 Simas, T., Nunes, J.P., Ferrier. J.G. (2001) Effects of global change on coast salt marshes. Ecological Modeleling 139: 1-15. Skilleter, G.A., Warren, S. (2000) Effects of habitat modification in mangroves on the structure of mollusc and crab assemblages. Journal of Experimental Marine Biology and Ecology 244: 107-129. Smith, T. J., III. (1992). Forest structure. In: Robertson, A.I., and Alongi, D.M. (eds.), Tropical Mangrove Ecosystems. Coastal and Estuarine Studies. vol 41. American Geophysical Union. Washington DC. pp. 101-136. Smith, T.J. III and Duke, N.C. (1987) Physical determinants of inter-estuary variation in mangrove species richness around the tropical coastline of Australia. Journal of Biogeography 14: 9–19. Smith, T.J., III, Robblee, M.B., Wanless, H.R., and Doyle T.W., (1994) Mangroves, hurricanes and lightning strikes. BioScience 44: 256-262. Snedaker, S.C. (1995) Mangroves and climate-change in Florida and the Caribbean region – Scenarios and hypotheses. Hydrobiologia 295: 43-49. _____________________________________________________________________ Coastal Vulnerability Gaps Analysis – Australian Greenhouse Office
109
Spalding, M.D., Balsco, F., Field, C.D. (1997). World mangrove atlas. The International Society for Mangrove Ecosystems. Okinawa, Japan. Sobrado, M.A. (1999) Drought effects on photosynthesis of the mangrove, Avicennia germinans, under contrasting salinities. Trees, Structure and Function 13: 125-130. Steinke, T.D. and Naidoo, Y. (1991) Respiration and net photosynthesis of cotyledons during establishment and early growth of propagules of the mangrove, Avicennia marina, at three temperatures. South African Journal of Botany 57: 171-174. Stiling, P., Rossi, A.M., Hungate, B., Dijkstra, P., Hinkle, C.R., Knott, W.M. and Drake, B. (1999) Decreased leaf-miner abundance in elevated CO2: reduced leaf quality and increased parasitoid attack. Ecological Applications 9: 240-244. Tomlinson, P.B. (1986) The botany of mangroves. Cambridge University Press, Cambridge. Twilley, R.R., Chen, R., Hargis, T. (1992) Carbon sinks in mangroves and their implication to carbon budgets of tropical ecosystems. Water, Air and Soil Pollution 64:265-268. Valiela, I., Bowen, JL., York, J.K. (2001) Mangrove forests: one of the world’s threatened major tropical environments. BioScience 51: 807-815. Whelan, K.R.T., Smith, T.J. III, Cahoon, D.R., Lynch, J.C., Anderson, G.H. (2005) Groundwater control of mangrove surface elevation: Shrink and swell varies with soil depth. Estuaries 28: 833–843. Wolanski, E., Mazda, Y., Furukawa, K., Ridd, P.V., Kitheka, J., Spagnol, S., and Stieglitz, T. (2000) Water circulation in mangroves, and its implications for biodiversity. In: Wolanski, E. (ed.). Oceanographic Processes of Coral Reefs, CRC. Boca Raton. pp. 53-76. Wolanski, E., Mazda, Y., and Ridd, P. (1992) Mangrove hydrodynamics. In: Robertson, A.I., and Alongi, D.M. (eds.), Tropical Mangrove Ecosystems. Coastal and Estuarine Studies. vol 41. American Geophysical Union. Washington DC. pp. 436462. Woodroffe, C.D. (1990) The impact of sea-level rise on mangrove shore lines. Progress in Physical Geography 14: 583-520. Woodroffe, C.D. (1992). Mangrove sediments and geomorphology. In: Robertson, A.I., and Alongi, D.M. (eds.), Tropical Mangrove Ecosystems. Coastal and Estuarine Studies. vol 41. American Geophysical Union. Washington DC. pp. 7-42. Woodroffe, C.D. (1995) Response of tide-dominated mangrove shorelines in northern Australia to anticipated sea-level rise. Earth Surface Processes and Landforms 20: 65-85. Woodroffe, C.D., and Grime, D. (1999) Storm impact and evolution of a mangrove-fringed chenier plain, Shoal Bay, Darwin, Australia. Marine Geology 159: 303-321. Young, B.M., Harvey, L.E. (1996) A spatial analysis of the relationship between mangrove (Avicennia marina var australasica) physiognomy and sediment accretion in the Hauraki Plains, New Zealand. Estuarine and Coastal Shelf Science 42: 231246. SEAGRASSES Abal, E. G., and W. C. Dennison. 1996. Seagrass depth range and water quality in southern Moreton bay, Queensland, Australia. Marine and Freshwater Research 47:763-771. Beck, M. W., K. L. Heck, K. W. Able, D. L. Childers, D. B. Eggleston, B. M. Gillanders, B. Halpern, C. G. Hays, K. Hoshino, T. J. Minello, R. J. Orth, P. F. Sheridan, and M. R. Weinstein. 2001. The identification, conservation, and management of estuarine and marine nurseries for fish and invertebrates. Bioscience 51:633-641. Bulthuis, D. A. 1983. Effects of in situ light reduction on density and growth of the seagrass Heterozostera tasmanica (Martens Ex Aschers) Den Hartog in Western Port, Victoria, Australia. Journal of Experimental Marine Biology and Ecology 67:91-103. Bulthuis, D. A., and W. J. Woelkerling. 1983. Biomass accumulation and shading effects of epiphytes on leaves of the seagrass, Heterozostera tasmanica, in Victoria, Australia. Aquatic Botany 16:137-148. Cambridge, M. L., and A. J. McComb. 1984. The Loss of Seagrasses in Cockburn Sound, Western-Australia .1. The Time Course and Magnitude of Seagrass Decline in Relation to Industrial-Development. Aquatic Botany 20:229-243. Campbell, S. J., and L. J. McKenzie. 2004. Flood related loss and recovery of intertidal seagrass meadows in southern Queensland, Australia. Estuarine Coastal and Shelf Science 60:477-490. Campbell, S. J., L. J. McKenzie, and S. P. Kerville. 2006. Photosynthetic responses of seven tropical seagrasses to elevated seawater temperature. Journal of Experimental Marine Biology and Ecology 330:455-468. Carruthers, T. J. B., W. C. Dennison, B. J. Longstaff, M. Waycott, E. G. Abal, L. J. McKenzie, and W. J. L. Long. 2002. Seagrass habitats of northeast Australia: Models of key processes and controls. Bulletin of Marine Science 71:11531169. Coles, R., L. McKenzie, and S. Campbell. 2003. The seagrasses of Eastern Australia. Pp. 119-133 in E. P. Green and F. T. Short, eds. World atlas of seagrasses, prepared by the UNEP world conservation monitoring centre. University of California Press, Berkley USA. Collier, C. J. 2006. Characterising responses of the seagrass Posidonia sinuosa to changes in light availability. Edith Cowan University, Perth. PhD (in examination May 2006). Costanza, R., R. d'Arge, R. de Groot, S. Farber, M. Grasso, B. Hannon, K. Limburg, S. Naeem, R. V. O'Neill, J. Paruelo, R. G. Raskin, P. Sutton, and M. van den Belt. 1997. The value of the worlds ecosystem services and natural capital. Nature 387:253-260. Dennison, W. C., R. J. Orth, K. A. Moore, C. J. Stevenson, V. Carter, S. Kollar, P. W. Bergstrom, and R. A. Batiuk. 1993. Assessing water quality with submerged aquatic vegetation. BioScience 43:86-94. Duarte, C. M. 2002. The future of seagrass meadows. Environmental Conservation 29:192-206. Duarte, C. M., and C. L. Chiscano. 1999. Seagrass biomass and production: a reassessment. Aquatic Botany. 65:159-174. Fourqurean, J. W., J. N. Boyer, M. J. Durako, L. N. Hefty, and B. J. Peterson. 2003. Forecasting responses of seagrass distributions to changing water quality using monitoring data. Ecological Applications 13:474-489. _____________________________________________________________________ Coastal Vulnerability Gaps Analysis – Australian Greenhouse Office
110
Gordon, D. M., K. A. Grey, S. C. Chase, and C. J. Simpson. 1994. Changes to the structure and productivity of a Posidonia sinuosa meadow during and after imposed shading. Aquatic Botany 47:265-275. Hemminga, M. A., and C. M. Duarte. 2000. Seagrass Ecology. Cambridge University Press, Cambridge. Inglis, G. J. 2000. Disturbance-related heterogeneity in the seed banks of a marine angiosperm. Journal of Ecology 88:88-99. Kirkman, H. 1997. Seagrasses of Australia, Australia: State of the Environment Technical Paper Series (Estuaries and the Sea). Pp. 36. Department of the Environment, Canberra. Lanyon, J. M., C. J. Limpus, and H. Marsh. 1989. Dugong and turtles: grazers in the seagrass system. Pp. 610-634 in A. W. D. Larkum, A. J. McComb and S. A. Shepherd, eds. Biology of seagrasses: a treatise on the biology of seagrasses with special reference to the Australian region. Elsevier, Amsterdam. Larkum, A., R. Orth, and C. Duarte. 2006. Seagrasses: Biology and ecology and conservation. Springer, Dordrecht, The Netherlands. Lee Long, W. J., R. G. Coles, and L. J. McKenzie. 2000. Issues for Seagrass conservation management in Queensland. Pacific Conservation Biology 5:321-328. Longstaff, B. J., and W. C. Dennison. 1999. Seagrass survival during pulsed turbidity events: the effects of light deprivation on the seagrasses Halodule pinifolia and Halophila ovalis. Aquatic Botany 65:105-121. Longstaff, B. J., N. R. Loneragan, M. J. O'Donohue, and W. C. Dennison. 1999. Effects of light deprivation on the survival and recovery of the seagrass Halophila ovalis (R.Br.) Hook. Journal of Experimental Marine Biology and Ecology 234:1-27. McMahon, K. 2005. Recovery of subtropical seagrasses from natural disturbance. University of Queensland, Brisbane. PhD. Orth, R. J., T. J. B. Carruthers, W. C. Dennison, C. M. Duarte, J. W. Fourqurean, K. L. Heck Jr., A. R. Hughes, G. A. Kendrick, W. J. Kenworthy, S. Olyarnik, F. T. Short, M. Waycott, and S. L. Williams. 2006. A global contemporary crisis for seagrass ecosystems. Bioscience submitted Preen, A. 1995. Impacts of dugong foraging on seagrass habitats: observational and experimental evidence for cultivation grazing. Marine Ecology Progress Series 124:201-213. Preen, A., and H. Marsh. 1995. Response of dugongs to large-scale loss of seagrass from Hervey Bay, Queensland, Australia. Wildlife Research 22:507-519. Preen, A. R., W. J. Lee Long, and R. G. Coles. 1995. Flood and cyclone related loss, and partial recovery of more than 1000 km2 of seagrass in Hervey Bay, Queensland, Australia. Aquatic Botany 52:3-17. Ralph, P. J., D. Tomasko, K. Moore, S. Seddon, and C. M. Macinnis-Ng, O. 2006. Human impacts on seagrasses: Eutrophication, sedimentation and contamination. Pp. 567-593 in A. Larkum, R. Orth and C. Duarte, eds. Seagrasses: Biology and ecology and conservation. Springer, Dordrecht, The Netherlands. Short, F. T., and H. A. Neckles. 1999. The effects of global climate change on seagrasses. Aquatic Botany 63:169-196. Short, F. T., and S. Wyllie-Echeverria. 1996. Natural and human-induced disturbance of seagrasses. Environmental Conservation 23:17-27. Thayer, G. W., K. A. Bjorndal, J. C. Ogden, S. L. Williams, and J. C. Zieman. 1984. Part A: Faunal Relationships in Seagrass and Marsh Ecosystems. Estuaries 7:351-376. Udy, J. W., and W. C. Dennison. 1997. Growth and physiological responses of three seagrass species to elevated sediment nutrients in Moreton Bay, Australia. Journal of Experimental Marine Biology and Ecology 217:253-277. Udy, J. W., W. C. Dennison, W. J. L. Long, and L. J. McKenzie. 1999. Responses of seagrass to nutrients in the Great Barrier Reef, Australia. Marine Ecology-Progress Series 185:257-271. Uku, J., S. Beer, and M. Bjork. 2005. Buffer sensitivity of photosynthetic carbon utilisation in eight tropical seagrasses. Marine Biology 147:1085-1090. Walker, D., W. C. Dennison, and G. Edgar. 1999. Status of Australian seagrass research and knowledge. Pp. 1-23 in A. Butler and P. Jernakoff, eds. Seagrass in Australia: strategic review and development of an R & D plan. CSIRO Publishing Australia, Collingswood Victoria. Walker, D. I. 2003. The seagrasses of Western Australia. Pp. 109-118 in E. P. Green and F. T. Short, eds. World atlas of seagrasses, prepared by the UNEP world conservation monitoring centre. University of California Press, Berkley USA. Walker, D. I., G. A. Kendrick, and A. J. McComb. 2006. Decline and recovery of seagrass ecosystems-the dynamics of change. Pp. 551-565 in A. Larkum, R. Orth and C. Duarte, eds. Seagrasses: Biology and ecology and conservation. Springer, Dordrecht, The Netherlands. Walker, D. I., and A. J. McComb. 1992. Seagrass degradation in Australian coastal waters. Marine Pollution Bulletin 25:191195. West, R. J., A. W. D. Larkum, and R. J. King. 1989. Regional studies-Seagrasses of south-eastern Australia. Pp. 230-260 in A. W. D. Larkum, A. J. McComb and S. A. Shepherd, eds. Biology of seagrasses: A treatise on the biology of seagrasses with special reference to the Australian region. Elsevier, Amsterdam. Wright, J., and C. Jones. 2006. The concept of organisms as ecosystem engineers ten years on: progress, limitations, and challenges. Bioscience 56:203-209. CORALS Access Economics (2005). Measuring the economic and financial value of the Great Barrier Reef Marine Park. Report by Access Economics Pty Ltd for Great Barrier Reef Marine Park Authority, June 2005, 61pp. Berkelmans, R. (2002). Time-integrated thermal bleaching thresholds of reefs and their variation on the Great Barrier Reef. Mar. Ecol. Prog. Ser. 229, 73-82. Berkelmans, R. and Oliver, J.K. (1999). Large scale bleaching of corals on the Great Barrier Reef. Coral Reefs 18, 55-60. Berkelmans, R, De’ath, G.,Kininmonth, S. and Skirving, W. (2004). A comparison of the 1998 and 2002 coral bleaching events on the Great Barrier Reef: spatial correlations, patterns and predictions. Coral Reefs 23, 74-83. Bryant, D., Burke, L., McManus, J. and Spalding, M. (1998). Reefs at Risk: A map-based indicator of threats to the world’s coral reefs. World Resources Institute, 56pp. Buddemeier, R.W., Kleypas, J.A. and Aronson, R.B. (2004). Coral Reefs and Global Climate Change. Potential Contributions of Climate Change to Stresses on Coral Reef Ecosystems. Pew Center on Global Climate Change, Arlington, USA, 44pp. _____________________________________________________________________ Coastal Vulnerability Gaps Analysis – Australian Greenhouse Office
111
Cai W, Shi, G., Cowan, T., Bi, D. and Ribbe, J. (2005). The response of the Southern Annular Mode, the East Australian Current and the southern mid-latitude ocean circulation to global warming. Geophys. Res. Lett. 32: L23706. Department of the Environment and Heritage (2003). Terrestrial and Marine Protected Areas in Australia: 2002 Summary Statistics from the Collaborative Australian Protected Areas Database (CAPAD) 2003. The Department of the Environment and Heritage, Canberra. Chin, A. (2003), Corals. In: Chin, A, (ed) The State of the Great Barrier Reef On-line, Great Barrier Reef Marine Park Authority, Townsville. http://www.gbrmpa.gov.au/corp_site/info_services/publications/sotr/corals/index.html Crimp, S., Balston, J. and Ash, A. (2004) Climate Change in the Cairns & Great Barrier Reef Region. Scope and Focus for an Integrated Assessment, Australian Greenhouse Office, Canberra, Australia, 101pp. Donner S.D., Skirving, W.J., Little, C.M., Oppenheimer, M. and Hoegh-Guldberg, O. (2005). Global assessment of coral bleaching and required rates of adaptation under climate change. Global Change Biology 11, 2251-2265. Emmanuel, K. (2005). Increasing destructiveness of tropical cyclones over the past 30 years. Nature 436, doi: 10.1038/nature03906. Harriott, V.J., Harrison, P.L. and Banks, S.A. (1995). The coral communities of Lord Howe Island. Mar. Freshwater Res. 46, 457-465. Hilbert, D.W., Hughes, L., Johnson, J., Lough, J.M., Low, T., Pearson, R.G., Sutherst, R.W. and Whitaker, S. (2006). Research needs and information gaps for the implementation of the key objectives of the National Biodiversity and Climate Change Action Plan: Synthesis and summary report of a workshop. Report to the Australian Government, Department of Environment and Heritage by CSIRO Sustainable Ecosystems and the Workshop Facilitators (in press). Hobday, A. and Matear, R. (2005). Editors. Review of climate impacts on Australian fisheries and aquaculture: implications for the effects of climate change. Report to the Australian Greenhouse Office, Canberra, Australia, 43pp. Hoegh-Guldberg, O (1999). Coral bleaching, Climate Change and the future of the world's Coral Reefs. Mar. Freshwater Res. 50, 839-866. Hoegh-Guldberg, O. (2005). Low coral cover in a hig-CO2 world. J. Geophys. Res. 110, C09S06, doi:10.1029/2004JC002528 Hoyos, C.D., Agudelo, P.A., Webster, P.J. and Curry, J.A. (2006). Deconvolving of the factors contributing to the increase in global hurricane intensity. Science 312, 94-97. Hughes, T.P., Baird, A.H., Bellwood, D.R., Card, M., Connolly, S.R., Folke, C., Grosberg, R., Hoegh-Guldberg, O., Jackson, J.B.C., Kleypas, J., Lough, J.M., Marshall, P., Nystrom, M., Palumbi, S.R., Pandolfi, J.M., Rosen, B. and Roughgarden, J. (2003). Climate change, human impacts and the resilience of coral reefs. Science 301, 929-933. Interim Marine and Coastal Regionalisation for Australia Technical Group, (1998). Interim Marine and Coastal Regionalisation for Australia: an ecosystem-based classification for marine and coastal environments. Version 3.3. Environment Australia, Commonwealth Department of the Environment. Canberra, 102pp. IPCC (2001). Climate Change: Impacts, Adaptation and Vulnerability Summary for Policymakers, Intergovernmental Panel on Climate Change. www.unep.ch/ipcc King, B., McAllister, F., Wolanski, E., Done, T. and Spagnol, S. (2001). River plume dynamics in the central Great Barrier Reef. In: Wolanski, E. (ed). Oceanographic processes of coral reefs: physical and biological links in the Great Barrier Reef. CRC Press, Boca Raton, pp. 145-159. Kleypas, J.A., McManus, J.W. and Menez, L.A.B. (1999). Environmental limits to coral reef development: where do we draw the line? American Zoologist 39, 146-159. Little A.F., van Oppen, M.J.H. and Willis, B.L. (2004). Flexibility in algal endosymbioses shapes growth in reef corals. Science 304, 1492-1494. Lough, J.M. (1994). Climate variation and El Nino-Southern Oscillation events on the Great Barrier Reef: 1958 to 1987. Coral Reefs 13, 181-195. Lough, J.M. (1998). Coastal climate of northwest Australia and comparisons with the Great Barrier Reef: 1960 to 1992. Coral Reefs 17, 351-367. Lough, J.M. and Barnes, D.J. (2000). Environmental controls on growth of the massive coral Porites. J. Exp. Mar. Biol. Ecol. 245, 225-243. Lough, J.M., Barnes, D.J. and McAllister, F.A. (2002). Luminescent lines in corals from the Great Barrier Reef provide spatial and temporal records of reefs affected by land runoff. Coral Reefs 21, 333-343. Lough, J., Berkelmans, R., van Oppen, M., Wooldridge, S. and Steinberg, C. (2006). The Great Barrier Reef and climate change. Bull. Aust. Meteor. Ocean. Soc. (in press). Marshall, P.A. and Baird, A.H. (2000) Bleaching of corals on the Great Barrier Reef: differential susceptibilities among tax. Coral Reefs 19, 155-163. Massel, S.R. and Done, T.J. (1993). Effects of cyclone waves on massive coral assemblages on the Great Barrier Reef: meteorology, hydrodynamics and oceanography. Coral Reefs 12, 153-166. Millennium Ecosystem Assessment (2005). Ecosystems and human well-being: wetlands and water. Synthesis. World Resources Institute, Washington, DC Nakamura, T., Yamasaki, H. and van Woesik, R. (2003). Water flow facilitates recovery from bleaching in the coral Stylopora pistillata. Mar. Ecol. Prog. Ser. 256, 287-291. Pandolfi, J.M., Jackson, J.B.C., Baron, N., Bradbury, R.H., Guzman, H.M., Hughes, T.P., Kappel, C.V., Micheli, F., Ogden, J.C., Possingham, H.P. and Sala, E. (2005). Are U.S. coral reefs on the slippery slope to slime? Science 307, 1725-1726. Preston, B.L. and Jones, R.N. (2006). Climate change impacts on Australia and the benefits of early action to reduce global greenhouse gas emissions. CSIRO, Australia, 41pp. Puotinen, M.L., Done, T.J. and Skelly, W.C. (1997). An atlas of tropical cyclones in the Great Barrier Reef region, 1969-1997. CRC Reef Research Centre Technical Report No. 19 Townsville; CRC Reef Research Centre, 210pp. ReefBase http://reefgis.reefbase.org/mapper.asp Spalding, M.D., Ravilious, C. and Green, E.P., (2001). World Atlas of Coral Reefs. Prepared at the UNEP World Conservation Monitoring Centre. University of California Press, Berkeley, USA, 421pp. _____________________________________________________________________ Coastal Vulnerability Gaps Analysis – Australian Greenhouse Office
112
The Royal Society (2005). Ocean Acidification due to Increasing Atmospheric Carbon Dioxide. Policy Document 12/05, London UK, (www.royalsoc.ac.uk), 60pp. Thornhill D.J., LaJeunesse, T.C., Kemp, D.W., Fitt, W.K. and Schmidt, G.W. (2006). Multi-year seasonal genotypic surveys of coral-algal symbioses reveal prevalent stability or post-bleaching reversion. Mar. Biol. 148, 711-722. UNEP-WCMS (2006). In the front line: shoreline protection and other ecosystem services from mangroves and coral reefs. UNEP-WCMC, Cambridge, UK, 33pp. van Oppen, M.J.H., Mahiny, A.J. and Done, T.J. (2005). Geographic distribution of zooxanthella types in three coral species on the Great Barrier Reef sampled after the 2002 bleaching event. Coral Reefs 24, 482-487. Veron, J.E.N. (1986). Corals of Australian and the Indo-Pacific. Angus and Robertson, Australia, 644pp. Veron, J.E.N. (2004). Coral survey at selected sites in Arnhem Land. Produced for National Ocean Office. Australian Institute of Marine Science, Townsville, 12pp. Veron, J.E.N. and Marsh, L.M. (1988). Hermatypic corals of Western Australia: Records and annotated species list. Records of the Western Australian Museum, Supp. 29, Perth, Australia. Webster, P.J., Holland, G.J., Curry, J.A. and Chang, H.-R. (2005). Changes in tropical cyclone number, duration and intensity in a warming environment. Science 309, 1844-1846. Wilkinson, C. (2002). Status of Coral Reefs of the World: 2002. GCRMN, ICRI, AIMS. Wilkinson, C. (2004). Status of Coral Reefs of the World: 2004. GCRMN, ICRI, AIMS. Wooldridge, S. and Done, T. (2004). Learning to predict large-scale coral bleaching from past events: A Bayesian approach using remotely sensed data, in situ data and environmental proxies. Coral Reefs 23, 96-108. Wooldridge, S., Done, T., Berkelmans, R., Jones, R. and Marshall, P. (2005). Precursors for resilience in coral communities in a warming climate: a belief network approach. Mar. Ecol. Prog. Ser. 295, 157-169.
Chapter 5 Coastal Water Resources Boughton, W.C. (2002) AWBM catchment water balance model: calibration and operation manual version 4. 0. Unpublished report. CSIRO (2001). Climate change projections for Australia. 8 pp. Howe C., Jones R.N., Maheepala S. and Rhodes B. (2005) Implications of Potential Climate Change for Melbourne’s Water Resources. CSIRO Urban Water and Climate Impact Groups and Melbourne Water. Melbourne. Jones, R.N., Chiew, F.H.S., Boughton, W.C. and L. Zhang. 2006. Estimating hydrological model sensitivity to climate change. Advances in Water Resources, in press. NSW (2004). Water and Sydney’s Future: Balancing the Values of our Rivers and Economy. 125 pp. Queensland Department of Natural Resources and Mines (2006) South East Queensland Regional Water Supply Strategy. Stage 2 Interim Report. 24 pp. South Australia (2004) Water proofing Adelaide: a thirst for change, 2005-2025. 60 pp. Victorian Government (2006) Draft Central Region Sustainable Water Strategy. Our Water Our Future. Melbourne. Western Australia and CSIRO (2005) Context report on south west water resources for expert panel examining Kimberley water supply options. 117 pp. WRSC (2002) Planning for the future of our water resources. 21st century Melbourne: a WaterSmart city. Final report. 98 pp.
Chapter 6: Coastal Infrastructure Abbs, D. J., Maheepala, S., McInnes, K. L., Mitchell, G., Shipton, B., and Trinidad, G. (2000). Climate change, urban flooding and infrastructure. In: Hydro 2000: 3rd International Hydrology and Water Resources Symposium of the Institution of Engineers, Australia: proceedings, Perth, W.A., Institution of Engineers, Australia, p. 686-691. AGSO (2001) Natural hazards and the risks they pose to South-East Queensland. Department of Industry, Science and Resources. 24 pp plus CD-ROM. Austroads (2004) Impact of climate change on road infrastructure. Report AP-R243A. BBW (1979) Storm surge and tide investigations for the new Brisbane Airport. Blain Bremmer and Williams Pty Ltd. Betts, H. (2001) The incorporation of climate change in flood plain planning at the Gold Coast City Council. City of the Gold Coast, Australia: Gold Coast City Council, 14pp. Bruun, P. 1962. Sea level rise as a cause of shore erosion. Journal of Waterways Harbors Division 88: 117-130. GEMS 2005. Cyclonic Inundation Modelling for Coral Bay and the Blowholes; Final Report Prepared for Ningaloo Sustainable Development Office. Hardy, T., B. Harper and L. Mason. 2004. Potential impacts of climate change in modifying the Queensland storm tide hazard. In Proceedings of International Conference on Storms, Brisbane, Australia, 5-9 July, 2004, 176-177. Harper, B. 1999. Storm tide threat in Queensland: history, prediction and relative risks. Queensland Department of Environment and Heritage. 24 pp. Hebert, K. and R. Taplin, 2004. Climate Change Impacts and Coastal Planning in the Sydney Greater Metropolitian Region. Ecopolitics XV Conference, 12-14 November 2004, Sydney. Hennecke, W.G., C.A. Greve, P.J. Cowell and B.G. Thom .2004. GIS-based coastal behavior modeling and simulation of potential land and property loss: Implications of sea-level rise at Collaroy/Narrabeen Beach, Sydney (Australia) Coastal Managment 32 (4): 449-470 OCT-DEC 2004 Leicester, R.H. (1981) A risk model for cyclone damage to dwellings. Proceedings, 3rd. International Conference on Structural Safety and Reliability, Trondheim, Norway. McInnes, K.L., K.J.E. Walsh, G. D. Hubbert and T. Beer, 2003: Impact of sea-level rise and storm surges on a coastal community. Natural Hazards, 30, 187-207. NCCOE, 2004: Guidelines for responding to the effects of climate change in coastal and ocean engineering. 58 pp. _____________________________________________________________________ Coastal Vulnerability Gaps Analysis – Australian Greenhouse Office
113
PB Associates and AGO, 2006. Assessment of the Vulnerability of Australia’s Energy Infrastructure to the impacts of Climate Change. Unpublished report. Planning Institute of Australia Queensland Division (2004) Sustainable Regional and Urban Communities Adapting to Climate Change – Issues Paper. Queensland. Queensland Department of Natural Resources and Mines, 2004: Queensland Climate Change and Community Vulnerability to Tropical Cyclones. Synthesis Report. 35 pp. Queensland Transport, CSIRO and PPK, 1999: The Ffects of Climate Change on Transport Infrastructure in Regional Queensland: Synthesis Report. Brisbane, Australia, 18 pp. Sallenger, A. H., W. Krabill, J. Brock, R. Swift, M. Jansen, S. Manizade, B. Richmond, M. Hampton, and D. Eslinger, 1999, Airborne laser study quantifies El Nino-induced coastal change: EOS, Trans. Am. Geophysical Union, v. 80, p. 89, 9293. Smith, D.I. 1998. Urban flood damage under greenhouse conditions: what does it mean for policy? Aust. J. of Emergency Management 13, 56-61. Stive, J.F. ,2004. How important is global warming for coastal erosion? Climatic Change 64, 27 – 39. Walsh K., K. Hennessy, R. Jones, K. McInnes, C. Page, A. B. Pittock, R. Suppiah and P. Whetton, 2001: Climate change in Queensland under enhanced greenhouse conditions: Third Annual Report, 108 pp. Victorian Coastal Strategy. 2002. Available at http://www.vcc.vic.gov.au/strategy/. Walsh, K., 2004: Tropical cyclones and climate change: unresolved issues. Climate Research, 27, 77-83. Walker, G.R. 1995. Wind vulnerability curves for Queensland houses. Alexander Howden Insurance Brokers (Australia) Ltd. Waterman, P. 1996, Australian coastal vulnerability assessment project report. DEST. 75 pp. WBM Oceanics. 1995. Coastal Management Study and Coastal Management Plan –Gosford City Open Coast Beaches Zhang, K., B.C. Douglas and S. P. Leatherman, 2004. Global warming and coastal erosion. Climatic Change 64: 41-58.
Chapter 7: Fisheries and aquaculture EN.REFLIST
Chapter 8: Selected other coastal activities Australian Institute of Health and Welfare, 2004. Australia's health No. 9 2004. ISBN 1 74024 382 X; 528pp.; http://www.aihw.gov.au/publications/index.cfm/title/10014 Environmental Health Risk Assessment: Guidelines for assessing human health risks from environmental hazards: June 2002. http://www.health.gov.au/internet/wcms/publishing.nsf/Content/health-pubhlth-publicat-document-metadata-env_hra.htm Hamilton, J. M. (2005). Tourism, Climate Change and the Coastal Zone by: http://www.unihamburg.de/Wiss/FB/15/Sustainability/Thesis_Hamilton.pdf Henrick B & L Johnson (2000), ‘Visiting Australia’s Popular Attractions – Measuring International Day and Overnight Visitor Activity’, BTR Tourism Research Report, Vol 2, No.2. McMichael, A. et al 2003. Human Health and Climate Change In Oceania: A Risk Assessment 2002. Available at www.health.gov.au/pubhlth/strateg/envhlth/climate/ Woodruff R et al (2005) Climate Change Health Impacts In Australia: Effects Of Dramatic Co2 Emission Reductions. Report for the Australian Conservation Foundation and the Australian Medical Association. Available at: http://www.acfonline.org.au/news.asp?news_id=565 Specht, A. (In press) Extreme Natural Events And Their Effect On tourism – Central East Coast Of Australia. A Report for the CRC for Sustainable Tourism, Southern Cross University.
Appendix A Albala-Bertrand, J. M. 1993. The Political Economy of Large Natural Disasters. Oxford, United Kingdom: Clarendon Press.
-*-
_____________________________________________________________________ Coastal Vulnerability Gaps Analysis – Australian Greenhouse Office
114
ENDNOTES to Part I -*i Adapted from: Preston, BL (2006) Climate change and coastal Australia. Climate Change and the Coast: Decision-Maker Needs and Research Directions - Stakeholder Workshop, Port Douglas, QLD, 6 April, Australian Greenhouse Office, Canberra, Commonwealth of Australia. ii iii iv v vi vii viii ix x xi xii xiii xiv xv xvi xvii xviii xix xx xxi xxii xxiii xxiv
xxv xxvi xxvii xxviii xxix xxx xxxi xxxii xxxiii xxxiv xxxv xxxvi xxxvii xxxviii xxxix xl xli
xlii xliii
xliv xlv xlvi xlvii
GA = GeoSciences Australia NTC = National Tidal Centre DEM = Digital Elevation Model LOICZ = Land-Ocean Interactions in the Coastal Zone (LOICZ) project, a core project of the International Geosphere Biosphere Program (IGBP) GIS = Geographic information System DBDEM = Digital Bathymetry and Digital Elevation Model CoastClim and CVI are vulnerability assessment methods/tools Ozestuaries website: www.ozestuaries.org NLWR (or NLWRA) = National Land and Water Resources Audit AIMS = Australian Institute of Marine Sciences SERM = Simple Estuarine Response Model; SedNet = model for sediment and nutrient budgets Mangrove bibliography at http://wwwscience.murdoch.edu.au/centres/others/mangrove/ DSEs = Departments of Sustainability and Environment WHA = World Heritage Area UWA = University of Western Australia ECU = Edith Cowan University, Western Australia JCU = James Cook University UTS = University of Technology Sydney UQ = University of Queensland GBRMPA = Great Barrier Reef Marine Park Authority ARC = Australian Research Council LTMP = Long Term Monitoring Plan NCRIS = National Collaborative Research Infrastructure Strategy, a Federal Government initiative: one component is an Integrated Marine Observing System Investment plan ABS = Australian Bureau of Statistics NCCOE = National Committee on Coastal and Ocean Engineering DPIs = Departments of Primary Industry BRS = Bureau of Rural Sciences AFMA = Australian Fisheries Management Authority ABARE = Australian Bureau of Agricultural and Resource Economics DEH = Department of Environment and Heritage DITR = Department of Industry Tourism and Resources CRC = Cooperative Research Centre ANU = Australian National University ANU CRES = Australian National University Centre for Resource and Environmental Studies BoM = Bureau of Meteorology NRMW = Department of Natural Resources, Mines and Water (Queensland) BIOCLIM/ OZCLIM are biome-climate relationship models operated by a number of agencies GBR = Great Barrier Reef EPA (Qld) = Environment Protection Agency (Qld) MPA = Marine Protected Area GBRDEM, Great Barrier Reef Depth and Elevation Model:, CRC Reef Research Centre Ltd ReefClim has been used to generate scenarios of daily variability of summer sea temperatures, e.g. the 2003 report to Queensland government from CSIRO, AIMS and CRC Reef Research Centre BATS = Bermuda Atlantic Time-series Study, a long-term deep ocean time-series of data HOT = Hawaii Ocean Time-series MPA = Marine Protected Area RAMSAR wetlands: Those declared under the Convention on Wetlands, signed in Ramsar, Iran, in 1971.
_____________________________________________________________________ Coastal Vulnerability Gaps Analysis – Australian Greenhouse Office
115